Adiabatic Mass Loss and the Outcome of the Common Envelope Phase of Binary Evolution
Abstract
We have developed a new method for calculating common envelope (CE) events based on explicit consideration of the donor star’s structural response to adiabatic mass loss. In contrast to existing CE prescriptions, which specify a priori the donor’s remnant mass, we determine this quantity self-consistently and find it depends on binary and CE parameters. This aspect of our model is particularly important to realistic modeling for upper main sequence star donors without strongly degenerate cores (and hence without a clear core/envelope boundary). We illustrate the central features of our method by considering CE events involving 10 donors on or before their red giant branch. For such donors, the remnant core mass can be as much as 30% larger than the star’s He-core mass. Applied across a population of such binaries, our methodology results in a significantly broader remnant mass and final orbital separation distribution and a 20% increase in CE survival rates as compared to previous prescriptions for the CE phase.
Subject headings:
binaries: close – stars: evolution1. Introduction
The common envelope (CE) phase of binary evolution has become a standard paradigm for the formation of short period systems containing a compact object since it was introduced by Paczynski (1976) (see reviews by Iben & Livio 1993; Taam & Sandquist 2000). While we lack quantitative criteria for determining whether the envelope is successfully ejected in a CE event and a short-period binary system formed, prescriptions have been proposed to approximate the relation between the properties of the post-CE binary and its pre-CE progenitor system. The major source of uncertainty in these prescriptions is parameterized by a factor, , denoting the efficiency by which orbital energy is converted to the kinetic energy of the ejected envelope (see Iben & Tutukov 1985) or a factor, , describing the specific angular momentum of the ejected matter (see Nelemans et al. 2000; Nelemans & Tout 2005).
In recent years, significant effort has been devoted to understanding the early evolution of CE events in three dimensions (e.g. Ricker & Taam 2008) in order to elucidate the relevant hydrodynamic processes. However, a detailed description of the final phase, where the envelope is fully ejected and the remnant binary system forms, is difficult to obtain via hydrodynamic simulations since resolving the spatial scales of the donor’s core required prohibitively short time steps. The main goal of this letter is to describe a physically motivated yet computationally tractable methodology for determining the end-state of this final CE phase.
The outcome of a CE event depends not only on the rate at which mass is ejected, but also on the ability of the donor’s remnant layers to contract in response to the rapid mass loss. The initial response of stars to adiabatic mass loss was carried out in the pioneering work of Hjellming (1989), where the central focus was on determining when dynamical mass transfer instabilities occur. However the donor’s response down to the removal of nearly the entire envelope (relevant to the final phase of CE evolution) was not considered. Here we report on our efforts to extend the work of Hjellming (1989) by determining the structural response of donor stars to adiabatic mass loss sequences that terminate deep within the donors’ core. In §2, we briefly describe these computations and their results. In §3, we apply these results to develop a new procedure for determining the outcome of the CE phase. We compare the results of an analysis for a binary population of a donor with those based on previous prescriptions for the properties of the remnant core in §4 and summarize in the last section.
2. Methodology and Donor Response
The structure and response of a donor star is calculated using a code developed and described in Deloye et al. (2007) in the limit of adiabatic mass loss (i.e., we assume that in the CE, mass loss proceeds at a sufficiently high rate that energy transport between mass layers can be neglected). The equations governing the donor’s structure are given by the condition of mechanical equilibrium subject to the constraint that the entropy of a given mass layer is fixed. The set of equations used to calculate the donor’s structure is equivalent to the following:
| (1) |
| (2) |
| (3) |
where , , , , and are the density, temperature, pressure, radius, and specific entropy for each mesh shell, and is the mass interior to it. The initial entropy and composition profile, , is determined from a donor’s initial structure.
We apply standard boundary conditions except that in lieu of the effective temperature-luminosity relation, we enforce the fixed-entropy condition at the exterior boundary. To enforce mass loss on the donor’s structure, the outer mesh point equals the varying total donor mass, .
In reality, the above set of equations is cast in terms of modified , , , and variables and supplemented by a mesh spacing function that automatically adjusts the non-Lagrangian mesh as the evolution proceeds (Eggleton 1971). This recasting was adopted so that our equations had the same form as the stellar evolution code used to calculate the initial models, providing for a more robust ability to reconverge these initial models. Along a mass loss sequence, the mass at each grid point varies. To calculate and the composition, at each grid point, we interpolate the initial profiles using Akima splines.
While we focus here on donors with zero-age main sequence (MS) masses of , we calculated the adiabatic mass-loss response of donors with in the range between – with the mass loss starting at evolutionary phases from the terminal age MS through the red giant and asymptotic giant branch phases. The models from which we initiated mass-loss sequences we calculated using the STARS code (Eggleton 1971, 1972, 1973; updated as described in Pols et al. 1995) for a metallicity of Z = 0.02. We reconverged each input initial model (to an accuracy of in a norm of summed, squared relative residuals) in our own code with held fixed. We then calculated the mass loss sequences by decrementing by a small amount , based on both and the current surface entropy gradient, and converging the model at this new value. The results of the full study will be presented in a follow-up paper.
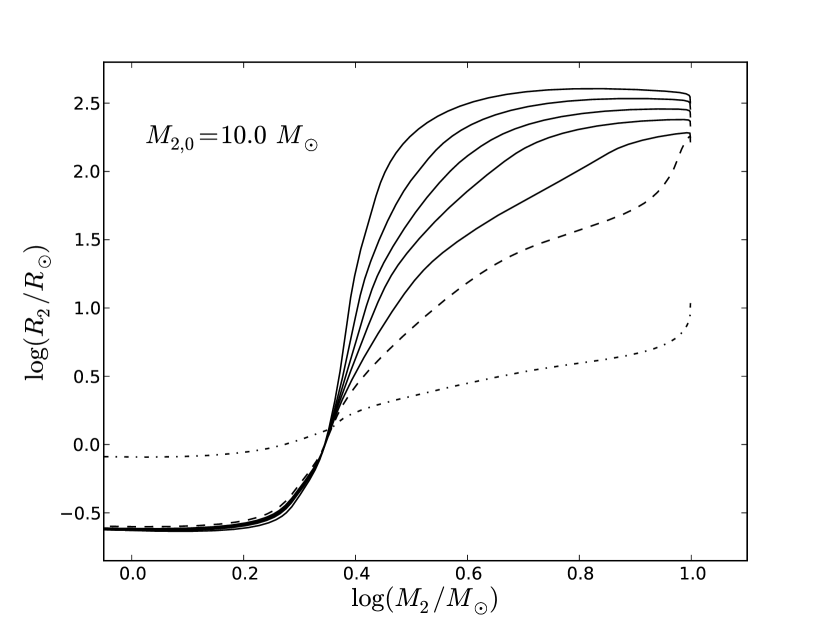
Our mass loss sequences were calculated with a numerical resolution of 599 grid points. The variation of stellar radius, , with for several of our sequences is shown for donors at the end of the MS, near the end of the Hertzsprung gap (HG) , and within the red giant branch (RGB) in Fig. 1. The marked difference in the initial response between the RGB model’s mild expansion and the other phase’s rapid contraction is due to the transition from a radiative envelope in the less evolved donors to the development of a nearly flat entropy profile in the RGB stars’ convective envelopes. As the donor moves up the RGB, the HHe burning shell thins and increases in luminosity. This, in tandem with the resulting deepening of the convective envelope, produces a steepening entropy profile in the core/envelope transition region. The steepening of the response near the core/envelope boundary for more evolved models results from this entropy gradient. Correspondingly, the more gradual contraction experienced during the later evolution of the less evolved donors results from a shallower entropy gradient throughout the donor’s interior. The intersection of curves at corresponds to the mass at the top of the H-burning shell.
We emphasize that in the adiabatic limit, the response to mass loss depends only on the donor’s initial structure through its -profile. Thus, in a CE event, the vs. evolution is independent of other external factors (such as binary parameters) under the assumption that the binary companion does not affect the donor’s structure. This allows us to calculate in advance a library of – tracks that form the essential input for an improved CE event outcome determination methodology.
3. A Self-Consistent Method for Determining CE Outcomes
During a CE phase, mass from the donor’s envelope is stripped and then ejected from the binary at the expense of the orbital energy. Current prescriptions for the final outcome of this process, in terms of post-CE orbital separation, , take as an a priori input the donor’s post-CE remnant mass, . This mass is typically taken to be the mass of the donor’s evolved core as determined via one of several criteria applied to isolated stellar evolution models. For lower MS stars on their giant branches, this approximation is reasonable given the steep entropy profiles across their thin-shell burning regions. However, stars on the upper main sequence can have significantly shallower entropy gradients in the core/envelope boundary region. This leads to ambiguity in defining the core mass in these cases and produces a significant variation in predicted CE event outcomes (see, e.g., Tauris & Dewi 2001).
More importantly, in such cases, the physical motivation for correlating core mass with no longer holds. That is, the adiabatic mass loss sequence for lower MS donors have – tracks that are similar to the track starting from the most-evolved donor with largest in Fig. 1, where the steep drop-off in near the core essentially guarantees the donor contracts within its Roche lobe with nearly equal to the core mass. For cases with more gradual evolution this is not guaranteed to be the case and the basic premise of using an a priori determined becomes suspect.
To address this issue, we have developed a new method for determining CE event outcomes based not on specifying , but on the evolution. Specifically we assume that the CE event ends at the point the donor contracts within a critical radius, which we take as its Roche radius. To determine this point, both and the donor’s Roche lobe radius, , are calculated as a function of during the CE event. Our mass loss – tracks provide the first necessary input. To determine the – track during the CE event we assume the standard CE energy conservation (i.e., ) prescription for determining applies along the entire course of the CE event. That is, the orbital separation, during the CE phase is given by
| (4) |
where is Newton’s gravitational constant, is the CE efficiency, and is the mass of the donor’s companion. Quantities with -subscripts represent quantities at the onset of the CE event.
The quantity is the difference in the donor’s total energy (gravitational potential plus internal thermal) between its initial and current configuration. We emphasize that this represents a subtle distinction relative to all previous applications of this prescription. Historically, would represent the total binding energy of the envelope as determined from the initial donor model. There is a difference between the initial envelope binding energy as a function of and the donor’s total binding energy at the corresponding total along the mass loss sequence. This difference reflects the work done on overlying layers as the donor’s mass shells expand under mass loss. This means that for a given is always greater than the initial binding energy at the corresponding . Thus, use of the initial model overestimates the amount of orbital contraction produced in a CE event.
We choose such that , using the expression from Eggleton (1983) to calculate . Modulo a few complications that arise in some cases (e.g., systems that experience delayed dynamical instabilities) is calculated during a CE event using as calculated from equation (4), assuming the mass transfer is completely non-conservative throughout, i.e., (see Hjellming & Taam 1991). To initiate the unstable mass transfer that leads to a CE event, initially, guaranteeing that for some time after the onset of the CE event. We determine the end of the CE event to be the point at which first becomes less than .
Several points deserve to be made about this method for calculating CE outcomes. First, the donor’s remnant mass, is an output of our model, not a predetermined input. That is, our method provides a self-consistent determination of and . Second, is a function of , and , meaning that explicitly depends on not only the initial binary parameters, but also on . This is in stark qualitative contrast with previous CE prescriptions.
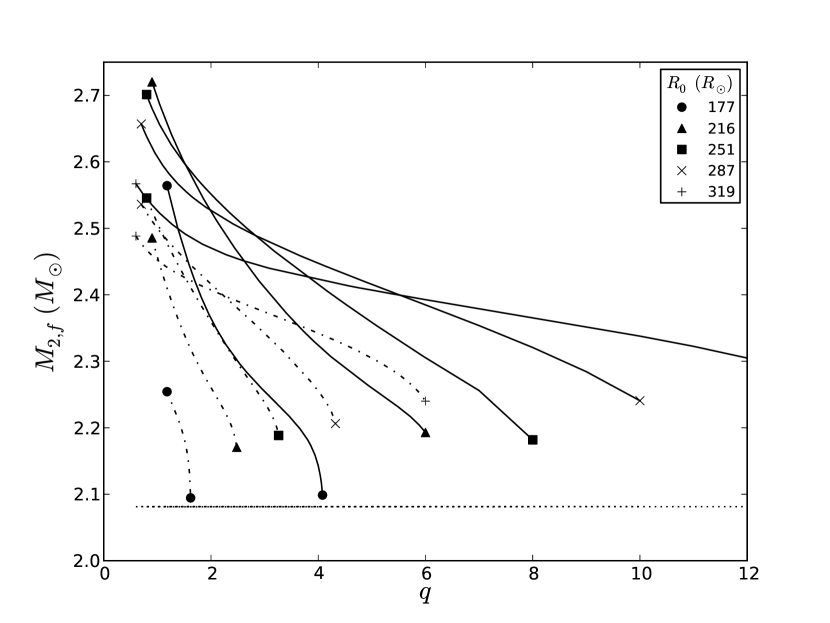
Our method is also in contrast with the existing CE prescriptions in terms of quantitative predictions for CE event outcomes. We illustrate this for the case of a donor in Figure 2. Here, we show as a function of the binary’s zero-age MS mass ratio, and . The systematically smaller for smaller values result from a greater degree of orbital contraction. For the fiducial case, can vary by as much as over the range producing non-merger CE events. The development of a deep convective envelope and steep entropy gradient near the core/envelope boundary on the upper RGB produces the transition from a sharply varying remnant core mass with respect to q to a more gradual decrease with increasing q seen with increasing .
For comparison, the dotted lines in Fig. 2 show the outcomes if one were to use a composition criteria to determine the core mass. We note that this value is roughly constant from the HG to the RGB for a star. determined via our method can be as much as greater than this core mass.
4. Comparison with -Prescription Results
To illustrate the impact of our methodology on CE event outcomes as compared with the standard -prescription we consider a population of binaries whose more massive component had an initial MS mass of 10 . Some subset of this population will undergo a CE event as this star evolves across the HG and up its RGB. This initial CE event is a key step in the formation of many neutron star (NS) binary systems (e.g., Bhattacharya & van den Heuvel 1991; Terman et al. 1996, 1998, Kalogera & Webbink 1998). For this comparison, a population of 500,000 binaries was constructed, fixing and considering a set of that yield a uniform distribution of initial . The initial orbital separation, , of this population was distributed evenly in . For a given pairing, the at which the 10 star first filled its Roche lobe was determined. If a CE event occurred for this system we determined the resulting values of and using both our self-consistent CE method and the standard -prescription, taking in both cases.
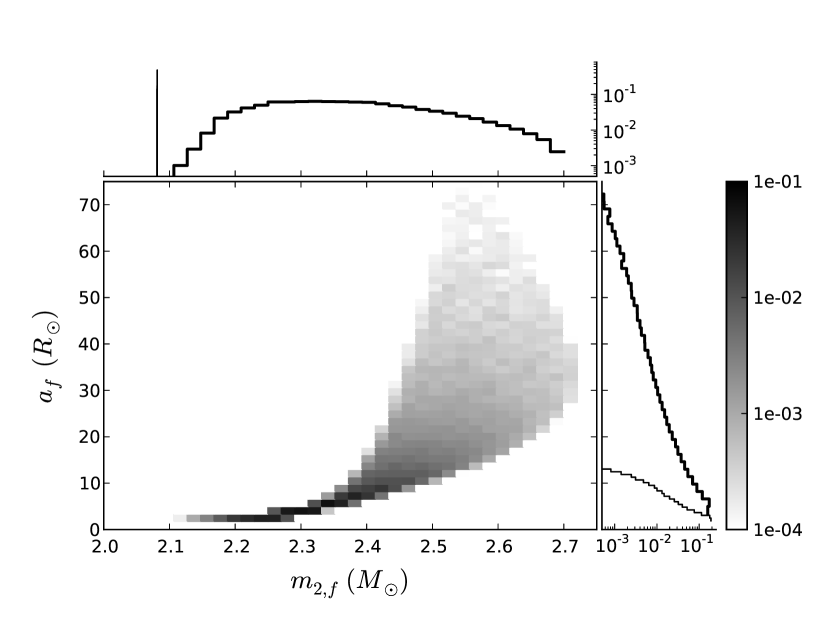
The outcome of this exercise in the form of – distributions for those systems that underwent and survived a CE event is shown in Figure 3. The main panel displays the distribution of post-CE systems in this parameter space as calculated with our method. This distributions peaks between 2.25 and 2.45 in and below in . However, both distributions are rather broad; the distribution has a tail that extends to significantly larger values. The comparison to the -prescription derived distributions are displayed in the side panels, which show the 1-D projected distributions. Our distribution is shown by the bold-line histogram, the -prescription results by the normal-weight lines with the latter scaled to the total number of systems in our distribution. As could be easily inferred from Fig. 2, the distribution in the latter case is nearly a -function since the core mass of the 10 donor does not vary significantly over its evolution up the RGB. The distribution in is also significantly narrower using the standard prescription as compared to our method.
How these differences impact the subsequent evolutionary outcomes of this binary population remains to be examined. However, we can provide some qualitative discussion here. Our method results in a higher post-CE survival rate relative to the standard prescription. This may not directly translate into a commensurate increase in the overall number of NS binaries produced in this channel since the core of the 10 donor will begin core He-burning and continue its subsequent evolution to a core-collapse supernova. The kick imparted to the system during the supernova alters the orbital parameters and may unbind the system. Taken over a distribution of kick velocities and directions, binaries with larger orbital separations are more likely to be unbound during the supernova and have a wider distribution in post-supernova eccentricity (Kalogera 1996). Considering the subsequent evolution of those binaries that will eventually form a double NS system via both a second CE event and supernova (Bhattacharya & van den Heuvel 1991), the use of our method can be expected to broaden the final eccentricity distribution of this population. However, our method’s overall impact on the production rate of this (and other NS binary) population is unclear given the various competing processes.
5. Summary
We have outlined a new method for calculating CE event outcomes that provides a self-consistent determination of post-CE core remnant masses and orbital separations in the framework of the parameterization. This method takes full account of the donor’s structural response to adiabatic mass loss based on the donor’s internal entropy profile at the onset of the CE event.111It has come to our attention that the recent paper by Ge et al. (2010) also treats the adiabatic mass loss evolution. The focus there is on the calculation methodology (which is similar to ours); they do include a limited discussion of the implications of their work that is complementary to the considerations presented here. The essence of our method is the use of pre-calculated mass loss sequences to determine when, if ever, the donor is able to contract within its Roche radius during the course of the CE event. Here, the donor’s final remnant mass depends on the specifics of a binary’s parameters (in stark contrast to prior CE event prescriptions), in addition to assumptions about the CE efficiency.
As an application of this method, we considered CE events with donors whose MS mass were ; this mass was chosen to highlight the significant impact our method has for higher mass donors that do not develop steep entropy gradients at their core/envelope interface until they are very far along their RGB. For CE events initiated by such objects on or before their RGB tip, existing CE prescriptions adopt to be equal to the donor’s He-core mass, which is essentially constant along the entire RGB. In contrast, our method predicts an that varies by across the population of binaries that survive the CE event. In addition, can be as large as times greater than the standard prescription. Taken over a standard distribution of initial binary parameters, these differences result in a significantly broader distribution in both and and an overall CE survival rate that is greater than the standard prescriptions.
The vastly different distribution in post-CE parameters produced by this new methodology has implications for the multitude of binary populations of intermediate mass or high mass donors that experience one or more CE events. Our new method could be expected to predict a broader distribution of eccentricities in double NS binary systems. The overall sense of impact on the production rate of such systems will require detailed calculations due to several competing destruction processes. Future work will involve incorporating our methodology into such detailed considerations of this and the multiple other contexts in which CE outcomes play a central, if not uncertain, role.
References
- (1) Bhattacharya, D. & van den Heuvel, E. P. J. 1991, Phys. Rep., 203, 1
- (2) Deloye, C. J., Taam, R. E., Winisdoerffer, C., & Chabrier, G. 2007, MNRAS, 381, 525
- (3) Eggleton, P. P. 1971, MNRAS, 151, 351
- (4) Eggleton, P. P. 1972, MNRAS, 156, 361
- (5) Eggleton, P. P. 1973, MNRAS, 163, 279
- (6) Eggleton, P. P. 1983, ApJ, 268, 368
- (7) Ge, H., Hjellming, M. S., Webbink, R. F., Chen, X., & Han, Z. 2010, ApJ, 717, 724
- (8) Hjellming, M. S. 1989, PhD Thesis, University of Illinois at Urbana-Champaign
- (9) Hjellming, M. S., & Taam, R. E. 1991, ApJ, 370, 709
- (10) Iben, I., Jr., & Livio, M. 1993, PASP, 105, 1373
- (11) Iben, I., Jr, & Tutukov, A.V. 1985, ApJS, 58, 661
- (12) Kalogera, V. 1996, ApJ, 471, 352
- (13) Kalogera, V. & Webbink, R. 1998, ApJ, 493, 351
- (14) Nelemans, G., & Tout, C. A. 2005, MNRAS, 356, 753
- (15) Nelemans, G., Verbunt, F., Yungelson, L. R., & Portegies Zwart, S. F. 2000, A&A, 360, 1011
- (16) Paczynski, B. 1976, The Structure and Evolution of Close Binary Systems, IAU Symp., 73rd, Cambridge, ed. P Eggleton, S Mitton, J Whelan, pp. 75-80, Dordrecht: Reidel
- (17) Pols, O. R., Tout, C. A., Eggleton, P. P., & Han, Z. 1995, MNRAS, 274, 964
- (18) Ricker, P. M., & Taam, R. E. 2008, ApJ, 672, L41
- (19) Taam, R.E., & Sandquist, E.L., 2000, ARA&A, 38, 113
- (20) Tauris & Dewi, 2001, A&A, 369, 170
- (21) Terman, J. L., Taam, R. E., & Savage, C. O. 1996, MNRAS, 281, 552
- (22) Terman, J. L., Taam, R. E., & Savage, C. O. 1998, MNRAS, 293, 113