On the scattering enhancement of N V1240 emission line of quasi-stellar objects
Abstract
The N V emission line of active galactic nuclei shows peculiar behavior in the line–continuum correlation, which may be indicative of an extra line component in addition to that from the normal broad emission line region. In this paper, we investigate possible contribution to the N V emission via resonant scattering of both continuum and Ly in a broad absorption line (BAL) outflow, by performing the Sobolev Monte Carlo simulations. The contribution is dependent on the covering factor, optical depth and velocity profile of the outflow, as well as the equivalent width (EW) of Ly. Adopting model parameters constrained by observations, we find that the measured N V EW in the spectra of non-BAL quasi-stellar objects (QSOs) could have been enhanced by a factor of 1.822.73 on average, while there is only moderate absorption of Ly along the BAL outflow direction. Our model can produce a relatively narrow scattering line profile. About 80% of the total scattered flux falls within the central . We find that the resonant scattering can produce a prominent polarized emission line around N V. Both the broad excess emission and the unusually large polarized flux observed around N V in BAL QSOs are considered as strong evidence for the scattering enhancement. Future spectropolarimetric observations and spectroscopic monitoring of luminous QSOs may offer crucial tests for this interpretation, and provide useful information on the physical and geometrical properties of QSO outflows. We argue that the scattering offers a promising and robust process for producing the peculiar behavior of N V emission compared to the other processes proposed previously.
1 Introduction
Much of our knowledge about active galactic nuclei (AGNs) and the more luminous quasi-stellar objects (QSOs) is derived from their emission lines, especially the broad emission lines (BELs), in the optical and ultraviolet band. Photoionization models, incorporating the treatment of ionization, thermal equilibrium, and the radiation transfer process, can reproduce successfully the overall observed emission line spectra with only a few exceptions, such as the Fe II and N V emission lines (e.g., Rees et al. 1989; Baldwin et al. 1995; Ferland et al. 1998). Studies of the emission lines improved our understanding of the physical state and chemical compositions of the BEL gas, and further the central engine of AGNs. In particular, the abundant ultraviolet lines, such as the prominent metal lines O VI, N V, Si IV and C IV, are valuable probes of high-redshift QSOs in the early Universe owing to the unique information provided by these lines.
These metal lines are commonly thought to be emitted in dense photoionized clouds via collisional excitation (e.g., Peterson 1997; Osterbrock & Ferland 2006; cf. Murray & Chiang 1997). Among them, the N V BEL is very special. Its equivalent width (EW) is nearly independent of the continuum luminosity (e.g., Osmer et al. 1994; Dietrich et al. 2002), whereas those of the other high ionization lines (e.g., C IV and O VI) show significant anti-correlations with the continuum luminosity, known as the Baldwin effect (Baldwin 1977; Laor et al. 1995; Zheng et al. 1995; Wang et al. 1998; Dietrich et al. 2002; Dong et al. 2009). Compared to other lines, N V is particularly strong in the spectra of high luminosity QSOs. This leads to the suggestion that luminous QSOs have higher metallicity gas than less luminous QSOs, assuming that N V is collisionally excited (e.g., Hamann & Ferland 1993;1999; Shemmer & Netzer 2002).
However, it has also been suggested that some of the observed N V emission could result from resonant scattering of photons of both the continuum and the Ly emission line in the broad absorption line region (BALR; Surdej & Hutsemkers 1987; Turnshek et al. 1988; Weymann et al. 1991; Hamann et al. 1993, hereafter HKM; Hamann & Korista 1996, hereafter HK96; Krolik & Voit 1998; Wang et al. 2007, hereafter WWW). Broad absorption lines (BALs), which are produced in partially ionized outflows with typical velocities of 10000–20000, are observed in the ultraviolet spectra of about 10%–20% luminous QSOs (Weymann et al. 1991; Hewett & Foltz 2003; Knigge et al. 2008). At such velocities N+4 ions in the BALR, albeit its small covering factor (Weymann et al. 1991; Reichard et al. 2003), can scatter photons of Ly and the continuum into the wavelengths around N V, resulting in the observed enhancement of the N V emission. Indeed, absorption of Ly photons by N+4 ions has been observed in many BAL QSOs (e.g., Turnshek et al. 1988). Since such a BAL outflow is expected to exist in essentially every QSO, the scattering enhancement of the N V BEL should be a commonplace in QSOs and not exclusive of BAL QSOs.
However, the significance or the strength of the scattering emission is still under debate. On one hand, Surdej & Hutsemkers (1987) estimated that the N V flux can be enhanced by a factor of several (see also Krolik & Voit 1998), by simply assuming that the majority of Ly photons along the BAL outflow direction are scattered and assuming a large covering factor of the outflow. On the other hand, using an optical depth profile derived from the mean spectrum of a sample of BAL QSOs, Hamann and Korista (1996) found that only 30% of the incident Ly photons are scattered by the BAL gas. Furthermore, scattering emission from a high-velocity outflow is generally broader than typical BEL, and thus only a small fraction of the scattered photons can contribute to the measured N V EW. They thus reached a different conclusion that the scattering accounts for no more than 18% of the measured N V emission only.
In this paper, we re-examine this issue by making use of sets of improved parameters on the geometry and optical depth of BAL outflows as constrained by recent observations. We show that the scattering contribution to measured N V, which is strongly model parameter dependent, can be considerable for the reasonable values of the parameters. Our model is described in detail in SEC. 2. The primary results are presented in SEC. 3, and are discussed in SEC. 4 and 5 by addressing issues such as what causes the differences between the previous results and ours. Observational evidence in support of the scattered emission is presented in SEC. 6. We try to explain the peculiar behavior of N V based on our model in SEC. 7. We investigate the effect of differing the geometric model on the scattering enhancement in SEC. 8. The conclusion is summarized at the end.
2 Model Description
We use the numerical algorithm developed by WWW to simulate the resonant scatter process in an outflow with a large velocity gradient and terminal velocity. The Monte Carlo technique and the Sobolev approximation are adopted for the treatment of line transfer. These two techniques have been widely used to deal with radiation transfer in various media (e.g., Lee et al. 1994; Goosmann & Gaskell 2007). Different from the escape probability method (e.g., HKM), which can only approximate resonant scatter for a singlet transition, our code can handle multiple transitions. Moreover, our code can calculate the polarization of scattered light. We refer readers to WWW for more details (see also Lee et al. 1994; Lee 1994; Lee & Blandford 1997). Here we only describe briefly our assumptions and model parameters used in this paper.
We consider an equatorial and axisymmetric outflow that is supposed to launch initially from an accretion disk and then radially accelerated by the radiation pressure (e.g., Murray et al. 1995; hereafter M95; de Kool & Begelman 1995; Proga et al. 2000). Complications to this simple model and their implication are discussed in SEC. 8. When the line of sight to the continuum source intersects the outflow, BALs are produced in the QSO spectrum; alternatively, the QSO appears as a non-BAL QSO (Fig. 1). Thus the incidence of the BALs in QSOs spectra is a measure of the average covering factor (CA) of the BALR. Although the exact value is still uncertain owing to various selection effects in QSO samples (e.g., Krolik & Voit 1998; Hewett & Foltz 2003) and different criteria for BAL QSOs (e.g., Knigge et al. 2008), more recent studies suggest a BAL fraction of around 20%, almost a factor of 2 larger than the previous value of 10% (Hewett & Foltz 2003; Reichard et al. 2003; Dai et al. 2008; Knigge et al. 2008). There is also evidence for a wide range of the BALR covering factor among QSOs, whose value may be related to the fundamental parameters of QSOs, such as luminosity, black hole mass and accretion rate (Morris 1988; Ganguly et al. 2007). To be representative, we consider two values of the covering factor, CA and 0.2, in this paper.
We adopt M95’s formalism to describe the radial velocity distribution: , where is the terminal velocity and is the launch radius of the outflow. and the initial velocity of the absorption trough are fixed at 15000 and 1000, respectively111Our adopted initial velocity of BAL is similar to what HK96 adopted, especially their extreme case. Given an average optical depth over the flow velocity, , one can derive the radial optical depth as a function of the radial velocity ,
| (1) |
where , (see WWW for the exact definition of and the derivation of this formula). The optical depth profile is determined by two parameters, and . In principle, can be obtained directly from observed absorption line profile of the correspondent ions, and can thus be used to test our assumption on the velocity field and to determine and , as done by HK96. In practice, due to partial covering and/or filling of the scattered light, the residual flux in the absorption trough can not be directly used to determine the optical depth(Arav et al. 1999a). Following Murray & Chiang (1997), we consider several values between 0.5 and 2.0. We use 5 as a representative value. Although this value is much larger than the apparent optical depth directly derived from the absorption trough (e.g., HK96), it is more consistent with recent detailed analysis (Hamann 1998; Arav et al. 1999a; Wang et al. 1999; Lu et al. 2008). For comparisons, the results obtained with other values of are also presented.
The geometry and size of the continuum source and broad emission line region (BELR) are also relevant to our calculation. The central continuum source can be considered to be point-like with respect to the BALR, based on previous studies (e.g., HKM; HK96; WWW). Although the relative size of the BELR and the outflow is not well determined from observations, there are several important constraints. First, the Ly emission line is partially absorbed by the N V BAL, suggesting that the BELR must lie within or be cospatial with the BALR (e.g., Turnshek et al. 1988). Second, BELs are much less polarized than the continuum in BAL QSOs. This implies that the BELR should not be much smaller than the electron scattering region (Goodrich & Miller 1995; Schmidt & Hines 1999; Ogle 1997). Finally, the very large (10%) polarization detected in the CIV BAL trough in some QSOs hints at that the electron scattering region has a size comparable to that of the BALR. Due to the close doublet nature, the resonantly scattered light in an accelerated outflow is only moderately polarized. Thus, the electron scatted light that does not pass the outflow is likely to be responsible for the high polarization degree (Goodrich & Miller 1995; Ogle et al. 1999; Lamy & Hutsemkers 2004; WWW). To meet all these constraints, the size of the BELR must be the same order of magnitude as that of the BALR. A recent study based on polarized features across the H emission line in the BAL QSO PG 1700+158 provides convincing evidence that the outflow is launched from a region roughly cospatial with the BELR (Young et al. 2007). It is therefore reasonable to assume that the emission line clouds are distributed within a thin spherical shell with a radius comparable to the inner radius of the outflow (see Fig. 1). In this paper, the radius of the N V emission region is fixed to 222Our additional tests show that the results are insensitive to the size of the N V emission region. We thus fix it for simplicity., and several values of the radius of the Ly emission region () are considered.
Both the strength and profiles of the emission lines are important input parameters for our simulations. Due to severe Ly forest absorption and heavy blend with N V, it is difficult to obtain precisely the EW of Ly. Vanden Berk et al. (2001) measured a Ly EW of 92.9 from a composite spectrum of Sloan Digital Sky Survey (SDSS) QSOs, while HK96 obtained a smaller value of 66. In the simulations below, we adopt the EWs of the intrinsic emission lines333Here, we refer to emission lines from the normal BELR as intrinsic emission lines. as EWsim = 80 for Ly and 10 for N V, and their profiles as a Gaussian with FWHM4000. The adopted value for N V is less than what HK96 used, 18, since the N V emission is enhanced by resonant scattering according to our calculation in this paper. Moreover, the scattering enhancement is insensitive to the intrinsic N V EW value (see below). Although N V consists of a doublet with a separation of 4, we approximate the N V profile with a single Gaussian. We expect that this has little effect on the results obtained in this paper. The continuum spectrum is parameterized by a power law with an index of zero. Both the continuum and line emission are assumed to be isotropic.
| Model Parameters | () |
| No. | CA | Continuum | Ly | N V | ||||
|---|---|---|---|---|---|---|---|---|
| 1 | 0.1 | 2.0 | 5 | 0.5 | 50.5 | 86.2 | 4.6 | |
| 2 | 0.2 | 2.0 | 5 | 0.5 | 50.3 | 82.8 | 4.4 | |
| 3 | 0.2 | 2.0 | 5 | 0.0 | 50.3 | 75.8 | 4.4 | |
| 4 | 0.2 | 2.0 | 5 | 1.0 | 50.3 | 89.4 | 4.4 | |
| 5 | 0.2 | 1.5 | 5 | 0.5 | 52.9 | 84.7 | 4.4 | |
| 6 | 0.2 | 1.0 | 5 | 0.5 | 56.4 | 87.2 | 4.3 | |
| 7 | 0.2 | 0.5 | 5 | 0.5 | 59.6 | 88.9 | 3.9 | |
| 8 | 0.2 | 2.0 | 10 | 0.5 | 56.5 | 88.4 | 4.4 | |
| 9 | 0.2 | 2.0 | 3 | 0.5 | 43.6 | 73.4 | 4.4 | |
| 10 | 0.2 | 2.0 | 1.5 | 0.5 | 33.4 | 54.8 | 4.2 | |
| 11 | 0.2 | 2.0 | 0.5 | 0.5 | 18.2 | 26.3 | 3.1 |
Below we perform Monte Carlo simulations to model observed fluxes around the Ly and N V emission lines as functions of wavelength and orientation. The input parameters are listed in Tab. 1. Then we investigate the contribution of scattered light to the measured N V emission. We note that, in our model, photons encountering the equatorial plane (accretion disk) would be absorbed, i.e. the accretion disk is assumed to be optically thick without reflection. This treatment is different from some of the others and gives a conservative estimate of scattering contribution.
3 Enhancement of N V Emission Line
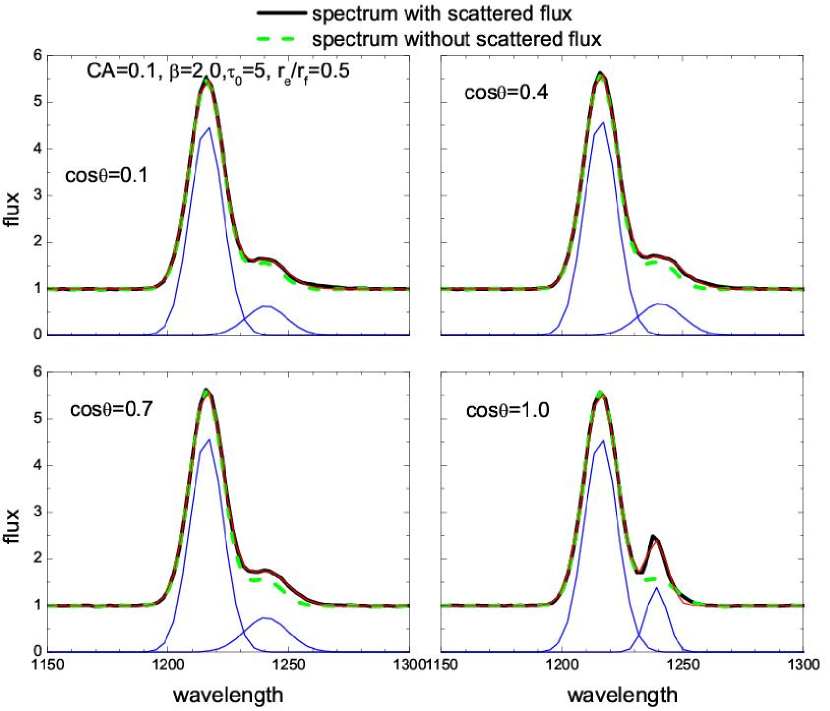
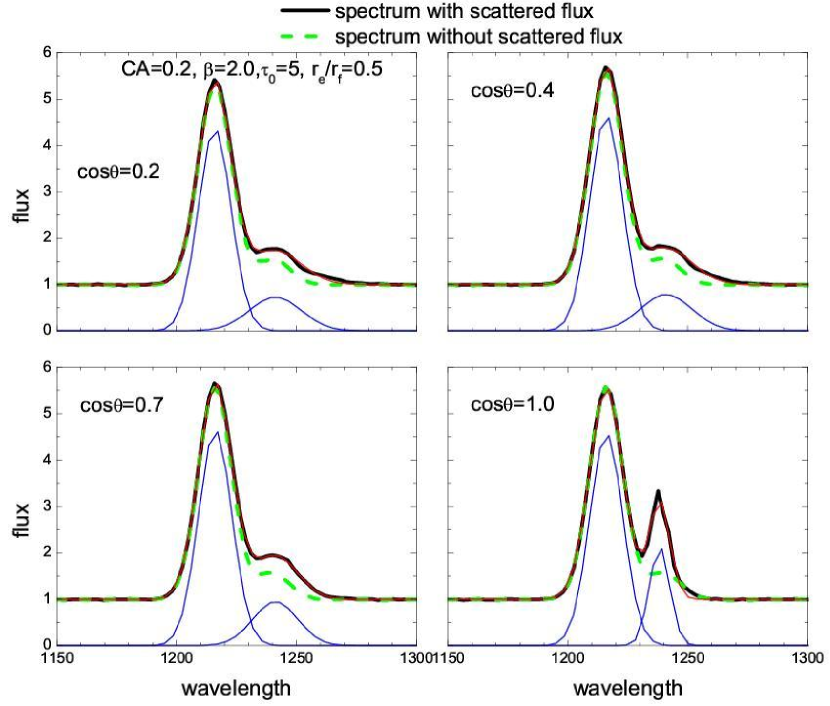
To give a visual impression of the scattering contribution to the N V BEL, we show in Fig. 2 and 3 the emerging spectra with and without the scattered light, viewed along several BAL-free directions (the line of sight to the continuum source would not be intersected by the outflow) specified by . Here, is the angle between the viewing direction and the rotational axis of the equatorial outflow (Fig. 1). The model parameters in Fig. 2 are CA=0.1, , and (Model 1 in Tab. 1), while those in Fig. 3 are similar to Model 1 except a larger CA of 0.2 (Model 2). In both the models, the profile around the N V line becomes narrower as increases. This is natural because the projected velocity of the outflow along the polar direction is smaller than that in the equatorial direction. However the profile of the scattered photons seems to be more center-peaked in comparison of those in WWW (e.g., figure 24). The difference is a consequence of two processes. First, in this paper, we take into account the scattering of Ly, which offsets by only 5900 to the blue side of N V. Second, the separation of the N V multiplets is wider than that of C IV considered by WWW, and the radiation transfer effect tends to make the line narrower (refer to SEC. 5 for more details). We attempt to fit the output line profile with two Gaussians, one for Ly and another for N V. The fitting results are shown in the same figures for comparison. With a somewhat surprise, they give rather good fits to the Ly and N V profiles, indicating that the intrinsic plus the scattered emission can also yield a profile similar to the normal broad lines.
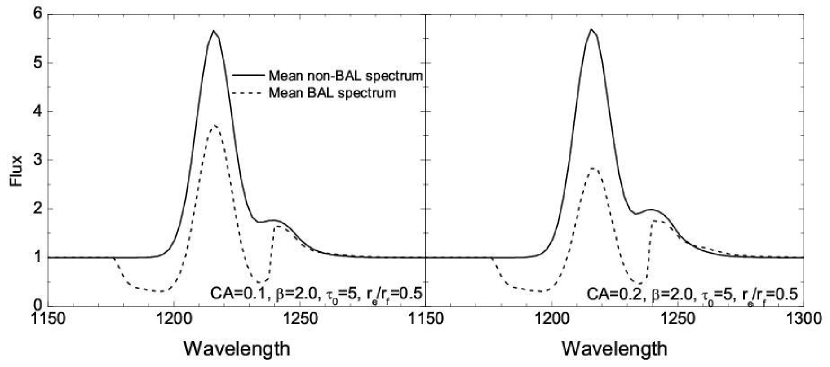
We show the angle-averaged spectra of BAL and non-BAL QSOs for the two models in Fig. 4. As expected, only a fraction of Ly photons along the BAL direction are scattered by N+4 ions. The absorption EW to Ly BEL is about 13.7 (32.0) for Model 1(2). This means that, on average, 17%(40%) of Ly photons initially along the BAL direction are absorbed and re-emitted. This fraction is similar to that in HK96, which adopted a small apparent optical depth instead of a large optical depth plus partial coverage. Note that the difference in the Ly peak height between BAL and non-BAL QSOs is mainly due to continuum absorption.
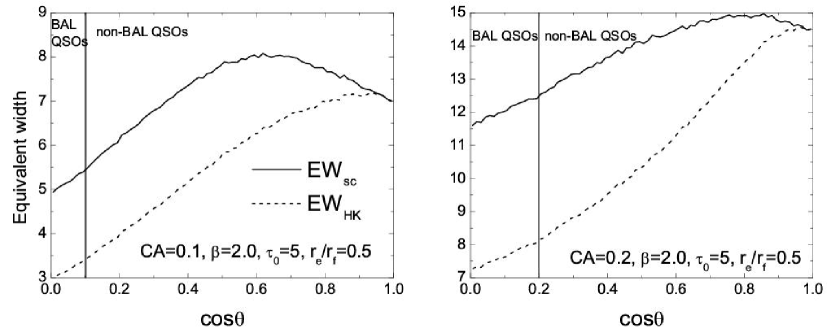
Fig. 5 shows the EW of the total scattering emission, referred to as EWsc, as a function of . The dependence of EWsc on is not monotonic, and its turning point varies with CA. This behavior can be ascribed to the large velocity splitting between the N V doublet lines. We will address this issue in details in SEC. 5. In a direction free of BAL, EWsc ranges from 5.5 (12.6) to 8.1 (15.0), with a mean of 7.3 (14.2), for the model with CA=0.1 (0.2). As comparisons, the mean values in the BAL direction are 5.2 and 12.1 respectively, for the two models. However, these values should not be compared directly with the N V EWs reported in the literature. Because N V is heavily blended with Ly, some de-blending techniques are used to determine the N V EW. For instance, HK96 measured the N V EW by integrating the fluxes between -5000 and +4000of the N V line center in excess of a symmetric fit to the Ly profile. Other de-blending methods, such as using the profiles of C IV as a template to fit Ly+N V or directly applying multi-Gaussian component fitting, are also often used (e.g., Dietrich et al. 2003; Shemmer & Netzer 2002). In order to compare with the HK96 results, we measure the EWs of the scattering emission between -5000 to +4000centered at NV (referred to as EWHK), as shown in Fig. 5 (dashed lines). It can be seen that EWHK increases with from 3.4(8.2) to 7.2(14.6), with a mean value of 5.8 (11.4). Even for such a method, the contribution of the scattered light to the N V emission is still prominent. HK96 derived a N V EW of 18 from a composite spectrum of non-BAL QSOs. Based on our calculations, the observed N V emission is enhanced by an average factor of 18/(18-5.8)1.48 or 18/(18-11.4)2.73, depending on which CA value is chosen.
Even if the effect of absorption by the accretion disk is considered and a slightly smaller covering factor is adopted, say, CA0.1 (HK96 used a CA=0.12), a larger enhancement than the HK96 value (Å) is still yielded. The discrepancy might result from the fact that we use a larger input EW of Ly and do not consider any partial covering of the continuum emission, which is thought to be common (Arav et al. 1999a). To check the impact of these effects on the results, we describe the EW of a scattering line in terms of the absorption EW. Conservation of photons suggests that the average EW of the scattered light () equals the average absorption EW () times the covering factor in the case of no absorption (see HK96). In our model, an additional factor of 0.5 is introduced and the relation reads as =0.5CA, because half of the scattered photons are absorbed by the accretion disk. Note that here is the average over all the solid angle rather than over BAL-free directions only. We separate the incident emission into three components: continuum, Ly and N V photons. Tab. 1 lists the of the three components.
The derived absorption EWs are insensitive to CA, at least for CA. We can thus predict from various EWs of the intrinsic emission lines, EWin, and the covering factors via simple relations,
| (2) | |||||
where EWsim denotes the EW of each emission line used in our simulations: 80 for Ly and 10 for N V; is the covering factor of the continuum source, which is used to account for the partial coverage of the continuum. For a model with , and , we have
| (3) |
To compare with HK96 we adopt their parameters, CA=0.12 and =66. HK96 measured a N V EW of 18, which is indeed the sum of the EWs of the intrinsic and scattering emission. We thus adopt Å. HK96 determined the average continuum absorption EW as 27 in their case A from the absorption line profiles; this corresponds to . The resulting mean EW of the total scattering emission is about 6.1, still slightly larger than what HK96 obtained ().
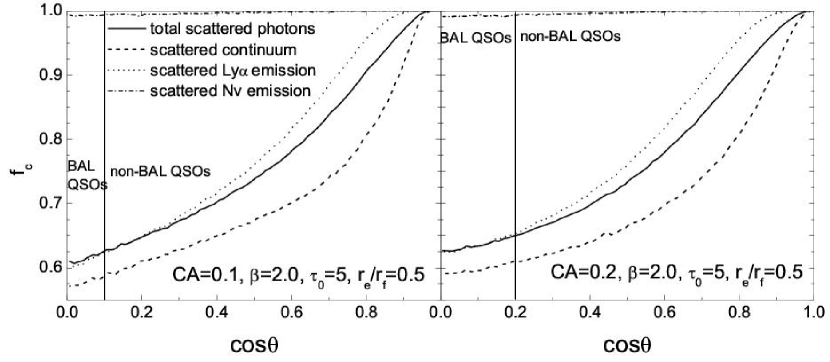
To translate into we define a parameter . We show in Fig. 6 the parameter for the total scattered photons (solid lines) as a function of for models 1 and 2. For comparisons, the results for the scattered continuum, the scattered Ly and N V emission lines are also shown in different line styles as indicated in the figure (Fig. 6). In a pure radial outflow, the scattered emission from a higher velocity region is broader than that from a lower velocity region. Continuum photons can be scattered by N+4 ions in the highest velocity region, while most of the intrinsic Ly and N V photons can only be scattered by outflow gas with radial velocity around 5900and respectively. So the parameter is the highest for intrinsic N V emission followed by (in order) Ly and continuum emission. The parameter for the total scattered photons increases with because the scattering emission line becomes broader at a larger polar angle. On average, about 80% of the total scattering line in BAL-free directions contributes to EWHK. Adopting HK96’s intrinsic EWs and covering factor, the increased N V EW is about , significantly larger than HK96’s result of . The N V emission is on average enhanced by a factor of 1.37. If adopting more representative CA of 0.2, the enhancement factor increases to 1.82. We note again that about half of the scattered photons are absorbed in our model. If the absorption by the accretion disk is not important, the enhancement would increase significantly.
Using Eq. 2 we can also estimate the scattered flux around the C IV emission line by assuming the same optical depth profile for C IV as for N V. Adopting a representative EW of 30 for the intrinsic C IV emission line (Vanden Berk et al. 2001; HK96), the resulting EWHK is 1.6(3.3) for CA=0.1(0.2). The scattering emission can account for only 5.3%–10.9% of the observed C IV emission, and is thus not important.
Given wide distributions of both the EW of the intrinsic emission lines and the covering factor of the outflow, one can imagine a very broad distribution of the scattered emission around N V (Eq. 2). In other words, while the N V emission can be enhanced by the scattered emission up to several times in some QSOs, the enhancement may be negligible in others. According to our calculations, the scattered flux is dependent not only on the EWs and covering factor, but also on the inclination. EWHK can differ by a factor of 2 at two extreme inclinations (Fig. 5).
In comparison with HK96, a question arises as to why our model can produce more contribution to N V from scattered emission. We try to answer this question from two aspects as follows. We discuss where the seed photons of the scattering emission come from in SEC. 4, and the processes that shape the profiles of the scattered light in SEC. 5.
4 Origin of Scattered Photons
There seems to be a contradiction between the strong scattering emission and the weak absorption of the Ly emission shown in the mean spectrum of BAL QSOs. From Tab. 1 and Eq. 2, one can find that the scattered flux is dominated by scattered Ly photons, while the listed (Ly) is much larger than that derived from the BAL profile (SEC. 3), and even larger than the input emission EW 80 for some models. All these can be readily understood once the size of the Ly emission region is taken into consideration. In the case of a large relative size of the BELR, the solid angle subtended by the outflow as viewed from a BEL cloud is larger compared to that for a point-like BELR, so N+4 ions can scatter line photons which are traveling along BAL-free directions. In the current model, Ly photons heading toward the accretion disk may be scattered by the outflow, and eventually escape the BALR along the line of sight (see Fig. 1 for illustration). These Ly photons provide seed photons for resonant scattering in addition to the line photons initially traveling along the BAL direction, and hence strongly enhance the scattered flux around N V.
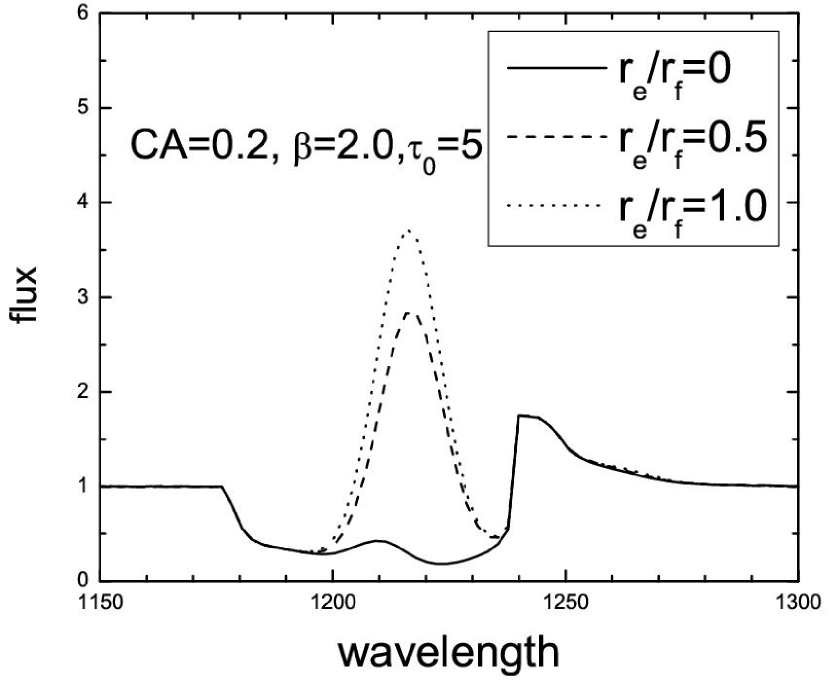
To explore the role played by the relative size of the Ly emitting region in determining the scattered flux, we perform simulations with =0 and 1 (Model 3 and 4, respectively). The model parameters and corresponding are listed in Tab. 1, and the average BAL spectra are shown in Fig. 7. The total scattered flux increases only weakly with the size of the Ly emission region. When , most of the Ly photons along the BAL direction are absorbed (solid line in Fig. 7). It is similar to the extreme case of HK96, in which a point-like BELR and a large optical depth are assumed. As expected, the absorption depth of the Ly BEL in the mean BAL spectrum decreases dramatically when . However, the amount of absorbed line photons initially traveling toward the disk increases rapidly, and compensate for the decrease of seed photons propagating along the BAL direction as increases. The competition between the two components eventually results in the weak dependence shown here. We also check the dependence of the scattered flux on the parameter (Model 57), and list the results in Tab. 1. Only a weak trend is found. Then we carry out simulations with various mean optical depths, ranging from 0.5 to 10. The model parameters, as well as the corresponding , are also listed in Tab. 1 (Model 811). The total scattered flux increases markedly with increasing optical depth up to . At the derived absorption EWs are very similar to the average-A case in HK96. The scattered emission gets stronger for a larger optical depth, at least for .
The scattered flux is sensitive to the optical depth of the outflow, besides its covering factor and the EW of the Ly emission. This explains why our favored model can yield a larger scattered flux than HK96, which adopted a smaller apparent optical depth profile and a smaller relative size of the BELR (point-like) than ours. Both models can reproduce the moderate absorption of Ly photons along the outflow direction as observed in the spectra of BAL QSOs, but yield very different amounts of the scattering emission. So additional observational constraints are required to distinguish these two models. As mentioned in SEC. 2, a large optical depth in the BAL outflow is suggested by recent studies (e.g., Hamann 1998; Arav et al. 1999a; Wang et al. 1999; Lu et al. 2008). Moreover, it is found that the BELR and the outflow are comparable in size from spectroscopy (Turnshek et al. 1988) and spectropolarimetry observations (Goodrich & Miller 1995; Ogle 1997; Ogle et al. 1999; Lamy & Hutsemkers 2004; Young et al. 2007). In particular, in one BAL QSO, 1603+3002, the BEL is not absorbed, implying a large size of its BELR (Arav et al. 1999b).
The outflow can scatter Ly photons traveling initially along BAL-free directions as long as the Ly emission region has a size comparable to that of the outflow, regardless of detailed models. In our model, Ly photons traveling toward the disk plane provide additional seed photons. If the absorption by the accretion disk is negligible, such as the model proposed by HKM, the situation would be slightly different. In Fig. 8, we illustrate with a sketch how the process works in such a model. When viewing along some special BAL-free directions as indicated in the figure, the Ly emission is partially blocked and scattered by the outflow (see Fig. 8 for demonstration). In addition, this model predicts a population of non-BAL QSOs that would display an absorbed Ly emission line. A candidate of such QSO was reported by Hall et al.(2004), which exhibits strongly absorbed Ly emission but an unabsorbed continuum. Interestingly, its C IV emission line shows significant blueshifted asymmetry, indicative of the presence of an underlying outflow. Because only emission lines are absorbed and the absorption line profile is dependent on the detailed structure of both the outflow and the BELR, this type of objects would be quite difficult to be recognized. This may explain why only one such object has been reported to date (see also Green (2006) for another possible case). Near-infrared observation of Balmer lines can test the scenario for Ly absorbed non-BAL QSOs since Balmer lines are not expected to be absorbed by the BAL gas. It is worth noting that such a population of non-BAL QSOs are also expected in the model in which absorption by the accretion disk is considered, for example the BALR and BELR geometry proposed by Elvis (2000).
5 Profile of Scattering Emission
The N V BEL is generally severely blended with the stronger Ly line, and its EW is usually measured by using some de-blending technique. Therefore, the measured EW of N V line is also dependent on the technique used. Usually, a narrower scattering profile can contribute more to the measured EW. The quantity defined above can be used to describe approximately the width of the scattering line. The mean in BAL-free directions is 0.79 (0.81) for Model 1 (2), which is larger than HK96 (). Our models produce obviously narrower profiles than HK96. In this section we investigate the several processes that affect the width of scattered line. Moreover, we will show that the relative narrow profile is a natural result of our model.
5.1 Radial Velocity Structure and Optical Depth
For a given geometry the scattering line profile depends on the angular distribution of the optical depth (HKM). In the Sobolev approximation, the optical depth along an arbitrary direction can be written as
| (4) |
where and are the flow velocity in the radial and directions, respectively. To describe the anisotropic distribution of the optical depth, we define a parameter , where direction is perpendicular to the radial direction (HKM, HK96). can be expressed as
| (5) |
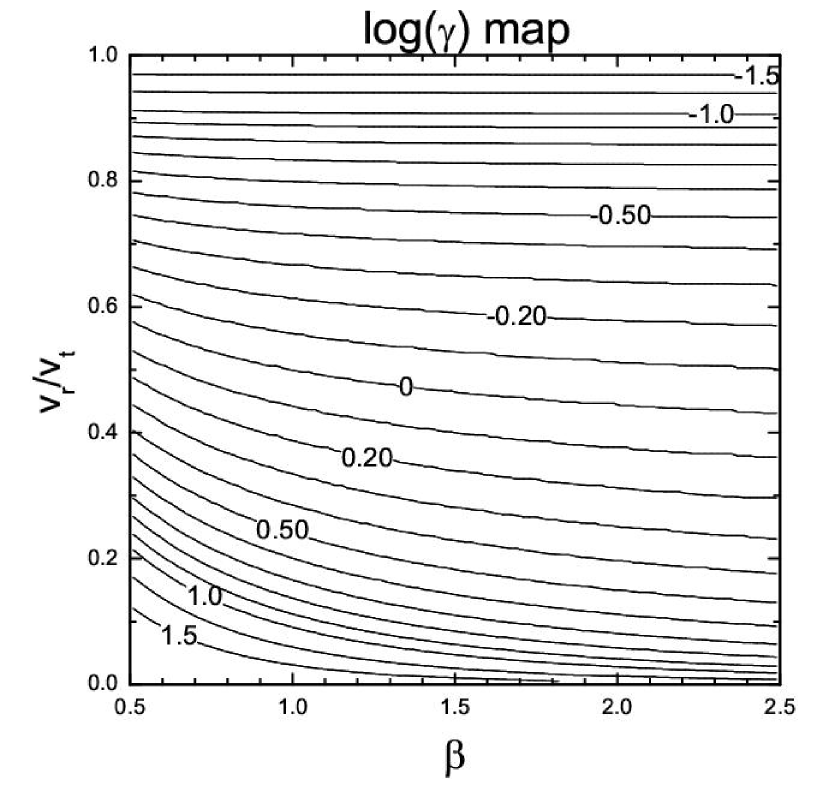
The second equation is valid only for our radial velocity profile. The scattering is isotropic for , radial for and tangential (perpendicular to radial) for . In Fig. 9, we show as functions of and the scaled radial velocity . is insensitive to in the range considered, and rapidly decreases with increasing radial velocity. In most of the radial velocity range, varies from to . The dynamic range in the parameter is broader than that considered by HK96 and HKM, from 0.2 to 20. It is interesting that photons tend to be scattered into the radial direction in the inner region of the flow (low ), and along tangential directions in the outer part of the flow. This means that the velocity structure in M95 tends to generate a relatively narrow scattering profile.
The parameter gives only a qualitative description of anisotropic scattering. According to Castor(1970), the probability of a photon escaping from a given point along the direction is
| (6) |
where is the normalized factor. To describe the anisotropic distribution of the escape probability, we introduce a parameter
| (7) |
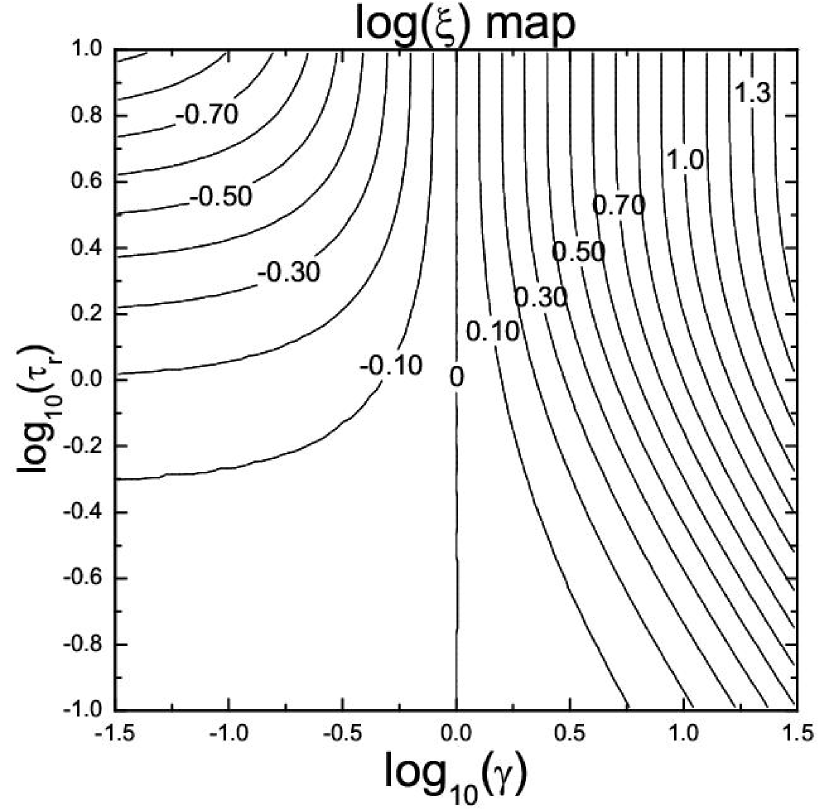
We show as functions of and in Fig. 10. The probability distribution of the escaping direction is related to both and optical depth. The tangential scattering, which prefers to generate a narrow scattering line profile, becomes effective only when is large enough. HK96 used an apparent optical depth structure, derived from observed BAL spectra, to calculate the scattering profile. However, this apparent optical depth method severely underestimates the real optical depth (Arav et al. 1999a;1999b). It may explain partially why the HK96 model produces a broader profile than ours.
5.2 Doublet Transitions
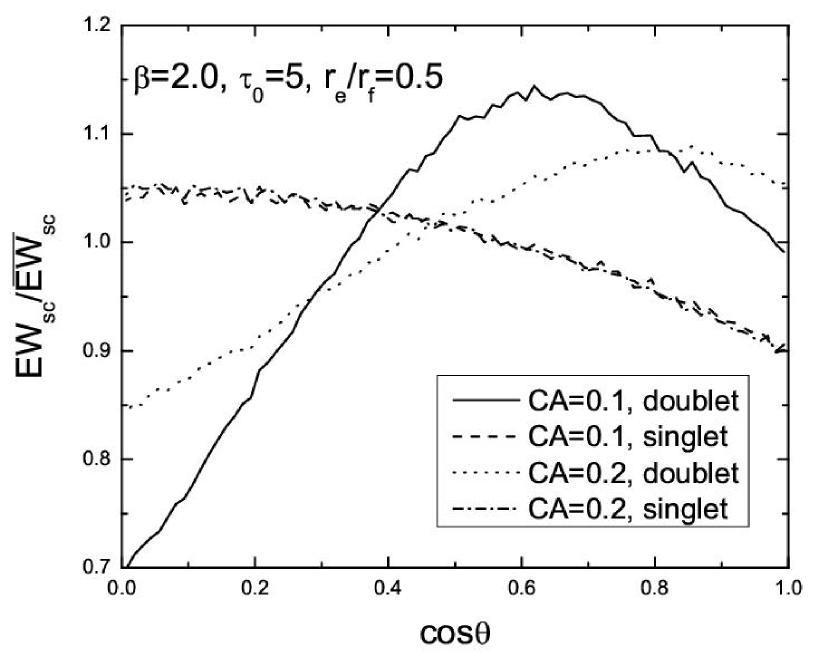
The escape probability method was developed to approximate the singlet resonant scattering. However, N V is a doublet line, in which the fine structure splitting is as broad as about 970 . We refer to the transition associated with shorter (longer) wavelength as T1(T2). This large velocity separation between the two transitions would induce a quite different radiation transfer effect from the singlet transition in a non-spherical outflow. In Fig. 11 we show the EW of the total scattering emission line as a function of inclination for both doublet and singlet resonant scattering. To compare results using different CA values, the EWs are shown as normalized to each .
Two things are worth-noting in this figure. First, for singlet transition, the scattered flux increases monotonously as the angle of the line-of-sight to the equatorial plane decreases. However, in the case of doublet transition, the scattered flux is suppressed along the equatorial direction. Considering a photon emitted from the central source and incident upon the outflow, it first encounters the scattering surface associated with transition T1. After one or more scatters within a tiny volume of size corresponding to several thermal widths (hereafter T1 volume), the photon emerges along a new direction d (Lee & Blandford 1997). If the outflow is accelerated monotonously, the fluid is expanding in all directions around the T1 volume. Therefore, in a spherical outflow, the photon will encounter transition T2 regardless of the emergent direction d; that is to say, the T2 scattering surface encloses the corresponding T1 volume. When a non-spherical geometry is considered, for example an equatorial outflow, the situation is different. Since an equatorial outflow is thin along the polar direction, the polar area of the T2 surface may lie outside the outflow. If d is nearly polar, there is a chance for the photon to escape from the outflow without experiencing T2 scattering. Otherwise, it may encounter transition T2 and be scattered again. This process results in a suppression of the scattered emission along the equatorial direction. On the other hand, the scattered light along the polar direction is dominated by photons experiencing T1 scattering only, so the EW along the polar direction appears to be similar to the singlet case, i.e., decreasing with increasing . This yields a turnover in the EW relationship.
At which orientation the turnover point occurs depends on the opening angle of the polar area of the T2 surface, which lies outside the outflow, with respect to the T1 volume. This opening angle is related to the shape and size of the T2 surface and the covering factor of the outflow. As the covering factor decreases, the fraction of the T2 surface within the outflow becomes smaller, and then the turnover point moves toward the equatorial direction. This is the second noteworthy point in Fig. 11. We note that the shape and size of the T2 surface are related to the velocity splitting between the two lines and the velocity structure of the outflow, and thus the dependence of EWsc on is also relevant to these two properties. Here we only give a qualitative analysis about this effect; a detailed interpretation is beyond the scope of this paper. For a comparison, the results for singlet are independent of CA (Fig. 11).
Doublet resonant transitions tend to scatter photons into the polar direction. Since the width of the scattering line profile is the narrowest along the polar direction, this process reduces the width of the scattered flux on average.
6 Observational Evidence for Scattering Emission
The difference between the mean spectra of BAL and non-BAL QSOs can be used to constrain the contribution of the scattering emission (Weymann et al. 1991; HKM). We have shown that the scattering emission along the BAL direction is mildly smaller than that along BAL-free directions (Fig. 5, see also SEC. 3). However, if there is a wide distribution in the covering factor, BAL QSOs have a larger mean covering factor than non-BAL QSOs due to selection effects (Morris 1988; Wang et al. 2005). Since the scattered flux increases with the covering factor, the average EWsc for BAL QSOs can be larger than that for non-BAL QSOs. For instance, assuming a mean value of CA of 0.2 for BAL QSOs, the resultant EWsc is 12.1 for BAL QSOs based on our model, while it is only 7.3 for non-BAL QSOs, if the mean CA in non-BAL QSOs is 0.1.
Weymann et al.(1991) found that there appears to be an excess of N V in the difference spectra of BAL and non-BAL QSOs. A close inspection indicates that the excess flux extends up to ten thousand redward of the N V line center (see figure 3 in HKM for a more clear illustration). The excess is much broader than the emission from the normal BELR, whereas its width is similar to the typical velocity of the BAL outflows. Therefore this is direct evidence for a scattering line. We note that the amount and width of the excess flux may be larger than what one obtains directly from the difference spectrum, since part of the photons scattered by N+4 ions fill in the Si IV BAL. In Weymann’s sample, the C IV, N V and Si IV BALs extend up to on average 25000 blueward of the relevant emission lines. There is a narrow core in the excess flux, which might result from strong tangential scattering in (at least part of) the BALR, or from different intrinsic emission lines in two kinds of QSOs.
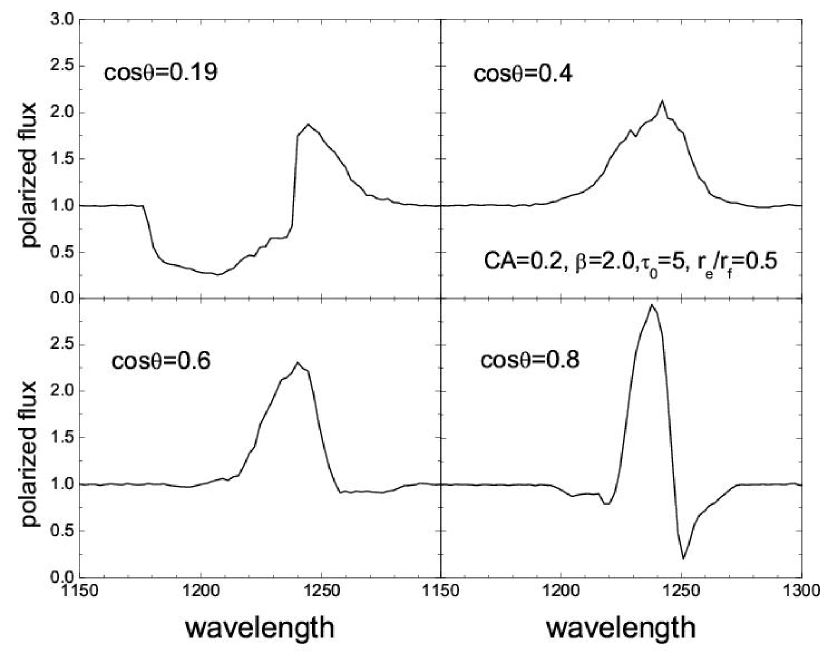
If there is a large contribution from resonant scattering in the BALR, the N V emission would exhibit a polarized feature very different from other lines produced in the normal BELR. Normal BELs, such as C IV, Si IV and Mg II, are usually absent in polarized spectra (Goodrich & Miller 1995; Schmidt & Hines 1999; Ogle et al. 1999; Lamy & Hutsemkers 2004). In contrast to these lines, unusually strong and broad emission of N V in polarized spectra were found by Lamy & Hutsemkers (2004) in all of their BAL QSOs spectra with available N V. This prominent feature is also present in the polarized spectra of several BAL QSOs from the spectropolarimetric atlas of Ogle et al.(1999). This feature can be interpreted as a result of the resonant scattering of Ly photons in a non-spherical outflow.
In Fig. 12, we show the polarized spectra for Model 2 in one BAL direction and three BAL-free directions. The spectra are normalized to the polarized continuum. In order to compare our results with observations, we set the polarization degree of incident continuum and intrinsic emission lines to 1.5% and zero respectively, which are consistent with observed polarization (e.g., Lamy & Hutsemkers 2004). We note that the EWs, profiles and especially the polarized flux of the resonantly scattered photons are independent of the polarization of incident light because the incident polarization is generally far less than 100%. As one can see, resonant scattering yields prominent emission feature around the N V line in the polarized spectra of both BAL and non-BAL QSOs. However, these simulated polarized features are weaker compared to the observed one in Lamy & Hutsemkers (2004). It implies that the covering factor or/and the EW of the Ly emission line of these QSOs may be larger than the values we adopted, or the outflow is non-axisymmetric with respect to the rotation axis of the accretion disk, or the incident continuum and line emission are anisotropic. The unusually large polarized emission provides important and strong evidence for that N V is significantly enhanced by resonant scattering in these BAL QSOs. Suppose BAL and non-BAL QSOs are from the same parent population, one would naturally expect strong scattered emission in the polarized as well as the total spectra of non-BAL QSOs (Fig. 2, 3 and 12). Extensive spectropolarimetric observations in this waveband were focused on BAL QSOs, thus high-resolution, polarized spectra of non-BAL QSOs are certainly required. Future spectropolarimetric observations will provide us with a unique insight for understanding the BALR properties and scattering enhancement.
The reverberation mapping technique offers another way to distinguish the two different origins of the N V emission. If most of the N V BELs can be attributed to the scattering in the BALR, the size of the N V BELR will be larger than that of Ly. Otherwise, it should be smaller than that of Ly and of other lower-ionization lines, since high-ionization lines are formed closer to the continuum source according to previous reverberation studies. This can be tested with reverberation mapping observations of N V. Previous reverberation mapping studies of Seyfert galaxies in UV suggested that the N V emission line region is smaller than that of Ly, C IV, H, etc (e.g., Reichert et al. 1994; Korista et al. 1995; Wanders et al. 1997; Rodriguez-Pascual et al. 1997; O’Brien et al. 1998). However, resonant scattering is expected to be small in those low-luminosity objects because of the low velocities of their outflows of the order of hundreds , which are insufficient to scatter a substantial fraction of Ly photons. Meaningful tests can only be done for luminous QSOs, in which the BAL outflow is believed to be launched. Unfortunately, monitoring of QSOs UV spectra has only just been started, and no firm conclusion has been reached so far. Recently, Kaspi et al. (2007) carried out spectrophotometric monitoring of several luminous QSOs at redshifts z = 2.2-3.2, for which N V enters the observing window. However, the N V and Ly lines could not be deblended due to the low spectral resolution. Future QSOs monitoring with medium spectroscopic resolutions may provide crucial tests of scattering enhancement. Furthermore, this technique will also provide useful probes to the BAL outflows, if scattered Ly photons indeed contribute significantly to the N V emission.
7 Origin of the Peculiar Behavior of N V BEL
Flux ratios between N V and other lines, such as O VI, C IV and He II , are often used to determine the metallicities of the BEL gas (e.g., Hamann & Ferland 1993;1999, Hamann et al. 2002). However, there exists a systematical discrepancy between the metallicities inferred by the line ratios using N V and using some weak semi-forbidden lines (Shemmer & Netzer 2002; Dietrich et al. 2003, hereafter D03). Shemmer & Netzer investigated a large sample of AGNs and found that the metallicities derived from N IV]/C IV are systematically smaller than those obtained by using N V/C IV by a factor of 3 or 4. This discrepancy was confirmed by an immediate follow-up study (D03). Meanwhile, D03 found that the mean N V/C IV metallicity is larger by a factor of 1.7 than those obtained using N III]/O III].
It has been suggested that these discrepancies may arise from the unsuitability of using these weak lines: the N IV]/C IV line ratio is sensitive to the radiative transfer effect, which is ambiguous (D03); and N III]/O III] is related to the distribution of the column density of clouds and may yield merely lower limits on the metallicity in the worst case (Hamann et al. 2002). If it is the case, suppose the line ratios involving N V are reliable metallicity indicators, one would expect the distribution of the N V metallicity might be narrower than those inferred using the two weak semi-forbidden lines ratios. However, a much larger dispersion in the N V metallicity than those based on the weak lines is clearly presented in D03 (their figure 3 and figure 5a). It implies that the N V emission, rather than those semi-forbidden lines, is affected by some other processes. The resonant scattering proposed in this paper would play a role, as it can contribute significantly to the N V emission based on our model. For a covering factor of 0.2, the N V emission may be enhanced on average by a factor of 1.82 (using HK96’s EW data) or 2.73 (using our supposed data). These values are broadly consistent with the observed difference between the metallicities inferred from N V and from some of the weak semi-forbidden lines ratios. In particular, the strength of the scattering emission has a wide distribution, which naturally explains the large scatter of the ‘N V metallicity’.
In order to explain the absence of the Baldwin effect in the N V line, Korista et al. (1998) invoked a strong positive correlation between metallicity and luminosity in their ‘locally optimally emitting cloud’ model. Difficulties for such an interpretation are: 1) the strong correlation between metallicity and luminosity is obtained by using the N V emission line (e.g., Hamann & Ferland 1993; Shemmer & Netzer 2002), while the metallicity inferred by the semi-forbidden lines shows only a weak dependence on luminosity (D03); 2) this model overestimates severely the EW of other two nitrogen lines, N IV] and N III], at the high luminosity end (Dietrich et al. 2002).
The peculiar behavior of N V can be understood in terms of scattering emission. There is growing evidence that the BAL phenomenon is correlated with some of the fundamental properties of QSOs. Boroson (2002) has shown that BAL QSOs tend to occupy the extreme end of the Boroson & Green (1992) Eigenvector 1, which is thought to be driven by the Eddington ratio. The absorption strength and maximal velocity of BALs are found to correlate with luminosity and the ratio between the intrinsic X-ray and optical luminosities (Laor & Brandt 2002; Ganguly et al. 2007; Fan et al. 2009). Ganguly et al. (2007) found significant correlations between the fraction of BAL QSOs, or the average covering factor of the outflow, and luminosity/Eddington ratio/black hole mass. Therefore, the scattering emission increases with QSO luminosity and hence compensates for the loss of the intrinsic N V EW due to the normal Baldwin effect. A detailed calculation requires the dependence of properties of QSO outflow on luminosity, which, however, suffers from selection biases and uncertainties caused by QSO identification methods.
8 Funnel-like Outflows
In contrast to the simple model in Fig 1, a complication comes from the presence of a postulated dusty torus, which is invoked for the unification model of the two types of Seyfert galaxies. The evidence for such tori in active galactic nuclei is compelling, including a large population of type 2 QSOs suggested by recent optical and infrared observations (e.g., Zakamska et al. 2003; Stern et al. 2005). The accretion disk likely has the same symmetry axis as the dusty torus since it is generally believed that the disk is fed by the gas from the torus. In such a configuration, an equatorial disk-like outflow will encounter an optically-thick dusty torus, and a strong interaction between the two is expected. Unless the outflow can blow away the torus, it will be blocked by the latter. One possibility is that the BAL gas arises initially nearly vertically, and is then accelerated radially by radiation pressure in a funnel-like region, as proposed by Elvis (2000; see also Young et al. 2007). In such a model, the vertical outflow will be located inside the torus, whereas the radial outflow moves outward freely. If the boundary of the torus is set by the interaction of the torus and radial outflow, the subtending angle of the torus would be similar to that of the vertical outflow.
The funnel-like outflow with a dusty torus can have two major consequences on the scattering emission. First, the covering factor of the BALR would have been over-estimated using the fraction of BAL QSOs. Because the vertical part of an outflow has a small radial velocity gradient, and is not important for the scattering enhancement. Thus the covering factor of a radial outflow can be approximated by , where , and are the numbers of BAL QSOs, Type 1 and Type 2 QSOs, respectively. Taking (e.g., Reyes et al. 2008), the covering factor is only half of the detection frequency of BAL QSOs among optical selected QSOs. The effect of this on the scattering emission can be quantitatively estimated via Eq. 2. Second, the incident angle relative to the outflow surface has increased significantly compared to the case of an equatorial outflow. The radiative transfer effect results in a different angle-dependence in the scattering flux.
To assess quantitatively the latter effect, we perform two simulations for a funnel-like outflow, similar to Model-B in WWW but with Ly scattering included. As in SEC. 2, BELs are assumed to be produced in a spherical shell, and the intrinsic EW of Ly and N V are, 80 and 10, respectively. In one simulation, the outflow (referred to as Model B1) has a covering factor of 0.1. Its upper and lower surfaces are 53.1o and 60o to the rotational axis, respectively. In the second simulation, the inclination angles for the upper and lower surfaces are 45.6o and 60o (referred to Model B2), respectively. The model B has a larger covering factor of 0.2. The EWs of scattering emission, and , are shown in Fig. 13. Other model parameters are marked in each panel.
The mean EWsc in BAL-free directions is 7.3 (14.2) for Model B1 (B2), the same as that of Model 1 (2), whereas mean EWHK is about 5.9 (11.6), slightly larger than that for the corresponding equatorial model (Tab. 1). These results indicate that the average scattering enhancement of the N V emission is insensitive to the detailed geometry of the outflow. It is simply because the optical depth and covering factor of the BAL outflow and the intrinsic EWs of emission lines, which determine the amount of the scattered photons, are the same for Model B1 (B2) and Model 1(2). However, in the funnel-like models, EWsc decreases first, then increases with , resulting in a minimum roughly at the BAL directions, which is very different from that in the equatorial model shown in Fig. 5. Such a EWsc distribution can also be understood in terms of the combination of doublet transitions plus the outflow geometry. As discussed in SEC. 5.2,doublet transitions tend to suppress the scattering emission along the directions in which the outflow is thick enough.
Up to now, we ignore the scattering on the base of the biconical outflow. This is valid if the vertical outflow has very high ionization so N+4 ions are very rare or the radial velocity at the flow base is very low. In the latter case, given the large covering factor of vertical outflows, the scattering of continuum photons from that part of the flow may produce a prominent relative narrow line in the absence of rotation. If the flow is rotating sufficiently fast, it can resonantly scatter Ly as well, and a narrow feature can be rather prominent in a face-on system. Detailed calculations need to take into account both the kinematics and geometry of the Ly emitting gas, and is beyond the scope of this paper. Note also that the radial velocity in the shielded outflow can be substantial. Smooth curvature of flow lines are suggested in a magnetocentrifugal driven outflow model (Blandford & Payne 1982; Konigl & Kartje 1994; Everett 2005; Miller et al. 2006). In that case, the flow base possibly spans a relatively large velocity range so that a substantial fraction of Ly photons may be scattered there. In that case, the effective covering factor can be significantly larger than the estimate above.
9 Summary
The N V BEL shows a different behavior from other nitrogen lines, N IV] and N III], and other high ionization lines, such as C IV and O VI, indicative of a different or additional origin. It has been suggested that resonant scattering in the BALR can contribute significantly to the observed N V emission line. In this paper, we derive the profile and EW of the scattering line by using the Sobolev Monte Carlo approximation. Some new observational constraints on the geometry and optical depth of QSO outflows are taken into account in our calculation.
By adopting a more realistic model than those in previous work, we find that the observable N V emission, EWHK, is increased by a factor of 1.82–2.73 on average. Our value is larger than the previous estimates. This can be attributed to the larger covering factor and radial optical depth we adopt than those used in earlier work. We emphasize that the average covering factor and optical depth adopted in our model are consistent with results from recent observational studies. The outflow, albeit with a large radial optical depth, can scatter only a small fraction of Ly photons along the BAL direction in our model, since the size of the BELR is comparable to the launching radius of the outflow. The relative sizes of the BELR and outflow adopted here are well constrained from many spectropolarimetric data. Our calculations find a wide range for the contribution of the scattered photons. It depends on several parameters, such as the covering factor, the optical depth, Ly EW and the orientation, which vary from one QSO to another. As a result, the scattering emission may dominate the N V emission in some QSOs, whereas negligible in others.
Another reason why the scattering contribution can be significant is that our model can produce narrow scattering profiles. About 80% of the total scattered flux contributes to the N V BELs as measured. A simple analysis indicates that the large optical depth we adopt can make tangential scattering to become effective, and thus yield a relatively narrow average profile. In addition, the large splitting between the N V double lines tend to enhance (suppress) the scattering emission along the polar (equatorial) direction in an accelerated disk-like outflow. Since the profile of the scattering line along the polar direction is narrower than that along the equatorial direction, doublet transition can produce narrower profiles than singlet on average.
The N V excess in the mean spectra of BAL QSOs compared to that of non-BAL QSOs provides direct observational evidence for the scattering contribution. The width of the excess flux is too broad to be concordant with emission from the normal BELR, but is similar to the typical velocities of BAL outflows. The unusually large and broad N V emission in polarized spectra of BAL QSOs is another piece of strong evidence in support of our argument. Our calculation suggests that this feature can be yielded via resonant scattering of Ly photons in the outflow. More importantly, our models produce similar prominent features in the polarized flux spectra of non-BAL QSOs. Future spectropolarimetric observations of QSOs, especially non-BAL QSOs, may provide crucial constraints on this issue, and further a useful probe of the physical condition of outflow. Reverberation mapping technique offers another way to investigate the importance of the contribution of the scattered light. Since low-luminous AGNs harbor only low-velocity outflows of the order of hundreds , which is insufficient to scatter a substantial fraction of Ly photons, this test can be done for luminous QSOs only, in which the BAL phenomenon is observed.
Finally, we discuss the role of resonant scattering in establishing the peculiarity of the N V emission, i.e. the absence of N V Baldwin effect and the discrepancy between the metallicities inferred by N V and by N IV] and N III]. We argue that scattering in the BALR offers a more promising explanation to the N V peculiarity over those proposed in previous work.
References
- Arav et al. (1999a) Arav, N., Korista, K. T., de Kool, M., Junkkarinen, V. T., & Begelman, M. C. 1999a, ApJ, 516, 27
- Arav et al. (1999b) Arav, N., Becker, R. H., Laurent-Muehleisen, S. A., Gregg, M. D., White, R. L., Brotherton, M. S., & de Kool, M. 1999b, ApJ, 524, 566
- Baldwin (1977) Baldwin, J. A. 1977, ApJ, 214, 679
- Baldwin et al. (1995) Baldwin, J., Ferland, G., Korista, K., & Verner, D. 1995, ApJ, 455, L119
- Blandford & Payne (1982) Blandford, R. D., & Payne, D. G. 1982, MNRAS, 199, 883
- Boroson (2002) Boroson, T. A. 2002, ApJ, 565, 78
- Boroson & Green (1992) Boroson, T. A., & Green, R. F. 1992, ApJS, 80, 109
- Castor (1970) Castor, J. I. 1970, MNRAS, 149, 111
- Dai et al. (2008) Dai, X., Shankar, F., & Sivakoff, G. R. 2008, ApJ, 672, 108
- de Kool & Begelman (1995) de Kool, M., & Begelman, M. C. 1995, ApJ, 455, 448
- Dietrich et al. (2003) Dietrich, M., Hamann, F., Shields, J. C., Constantin, A., Heidt, J., Jäger, K., Vestergaard, M., & Wagner, S. J. 2003, ApJ, 589, 722
- Dietrich et al. (2002) Dietrich, M., Hamann, F., Shields, J. C., Constantin, A., Vestergaard, M., Chaffee, F., Foltz, C. B., & Junkkarinen, V. T. 2002, ApJ, 581, 912
- Dong et al. (2009) Dong, X.-B., Wang, T.-G., Wang, J.-G., Fan, X., Wang, H., Zhou, H., & Yuan, W. 2009, ApJ, 703, L1
- Elvis (2000) Elvis, M. 2000, ApJ, 545, 63
- Everett (2005) Everett, J. E. 2005, ApJ, 631, 689
- Fan et al. (2009) Fan, L. L., Wang, H. Y., Wang, T., Wang, J., Dong, X., Zhang, K., & Cheng, F. 2009, ApJ, 690, 1006
- Ferland et al. (1998) Ferland, G. J., Korista, K. T., Verner, D. A., Ferguson, J. W., Kingdon, J. B., & Verner, E. M. 1998, PASP, 110, 761
- Ganguly et al. (2007) Ganguly, R., Brotherton, M. S., Cales, S., Scoggins, B., Shang, Z., & Vestergaard, M. 2007, ApJ, 665, 990
- Goodrich & Miller (1995) Goodrich, R. W., & Miller, J. S. 1995, ApJ, 448, L73
- Goosmann & Gaskell (2007) Goosmann, R. W., & Gaskell, C. M. 2007, A&A, 465, 129
- Green (2006) Green, P. J. 2006, ApJ, 644, 733
- Hall et al. (2004) Hall, P. B., Snedden, S. A., Niederste-Ostholt, M., Eisenstein, D. J., Strauss, M. A., York, D. G., & Schneider, D. P. 2004, AJ, 128, 534
- Hamann (1998) Hamann, F. 1998, ApJ, 500, 798
- Hamann & Ferland (1993) Hamann, F., & Ferland, G. 1993, ApJ, 418, 11
- Hamann & Ferland (1999) Hamann, F., & Ferland, G. 1999, ARA&A, 37, 487
- Hamann & Korista (1996) Hamann, F., & Korista, K. T. 1996, ApJ, 464, 158
- Hamann et al. (1993) Hamann, F., Korista, K. T., & Morris, S. L. 1993, ApJ, 415, 541
- Hamann et al. (2002) Hamann, F., Korista, K. T., Ferland, G. J., Warner, C., & Baldwin, J. 2002, ApJ, 564, 592
- Hewett & Foltz (2003) Hewett, P. C., & Foltz, C. B. 2003, AJ, 125, 1784
- Kaspi et al. (2007) Kaspi, S., Brandt, W. N., Maoz, D., Netzer, H., Schneider, D. P., & Shemmer, O. 2007, ApJ, 659, 997
- Knigge et al. (2008) Knigge, C., Scaringi, S., Goad, M. R., & Cottis, C. E. 2008, MNRAS, 386, 1426
- Konigl & Kartje (1994) Konigl, A., & Kartje, J. F. 1994, ApJ, 434, 446
- Korista et al. (1998) Korista, K., Baldwin, J., & Ferland, G. 1998, ApJ, 507, 24
- Korista et al. (1995) Korista, K. T., et al. 1995, ApJS, 97, 285
- Krolik & Voit (1998) Krolik, J. H., & Voit, G. M. 1998, ApJ, 497, L5
- Lamy & Hutsemékers (2004) Lamy, H., & Hutsemékers, D. 2004, A&A, 427, 107
- Laor et al. (1995) Laor, A., Bahcall, J. N., Jannuzi, B. T., Schneider, D. P., & Green, R. F. 1995, ApJS, 99, 1
- Laor & Brandt (2002) Laor, A., & Brandt, W. N. 2002, ApJ, 569, 641
- Lee et al. (1994) Lee, H.-W., Blandford, R. D., & Western, L. 1994, MNRAS, 267, 303 &
- Lee (1994) Lee, H. W. 1994, MNRAS, 268, 49 Blandford(1997)]1997MNRAS.288…19L Lee, H.-W., & Blandford, R. D. 1997, MNRAS, 288, 19
- Lu et al. (2008) Lu, H., Wang, T., Yuan, W., Dou, L., Ge, J., Zhou, H., Wang, H., & Dong, X. 2008, ApJ, 680, 858
- Miller et al. (2006) Miller, J. M., Raymond, J., Fabian, A., Steeghs, D., Homan, J., Reynolds, C., van der Klis, M., & Wijnands, R. 2006, Nature, 441, 953
- Morris (1988) Morris, S. L. 1988, ApJ, 330, L83
- Murray & Chiang (1997) Murray, N., & Chiang, J. 1997, ApJ, 474, 91
- Murray et al. (1995) Murray, N., Chiang, J., Grossman, S. A., & Voit, G. M. 1995, ApJ, 451, 498
- O’Brien et al. (1998) O’Brien, P. T., et al. 1998, ApJ, 509, 163
- Ogle (1997) Ogle, P. M. 1997, ASP Conf. Ser. 128: Mass Ejection from Active Galactic Nuclei, 128, 78
- Ogle et al. (1999) Ogle, P. M., Cohen, M. H., Miller, J. S., Tran, H. D., Goodrich, R. W., & Martel, A. R. 1999, ApJS, 125, 1
- Osmer et al. (1994) Osmer, P. S., Porter, A. C., & Green, R. F. 1994, ApJ, 436, 678
- Osterbrock & Ferland (2006) Osterbrock, D. E., & Ferland, G. J. 2006, Astrophysics of gaseous nebulae and active galactic nuclei, 2nd. ed. by D.E. Osterbrock and G.J. Ferland. Sausalito, CA: University Science Books, 2006,
- Peterson (1997) Peterson, B. M. 1997, An introduction to active galactic nuclei, Publisher: Cambridge, New York Cambridge University Press, 1997 Physical description xvi, 238 p. ISBN 0521473489,
- Proga et al. (2000) Proga, D., Stone, J. M., & Kallman, T. R. 2000, ApJ, 543, 686
- Rees et al. (1989) Rees, M. J., Netzer, H., & Ferland, G. J. 1989, ApJ, 347, 640
- Reichard et al. (2003) Reichard, T. A., et al. 2003, AJ, 126, 2594
- Reichert et al. (1994) Reichert, G. A., et al. 1994, ApJ, 425, 582
- Reyes et al. (2008) Reyes, R., et al. 2008, AJ, 136, 2373
- Rodriguez-Pascual et al. (1997) Rodriguez-Pascual, P. M., et al. 1997, ApJS, 110, 9
- Schmidt & Hines (1999) Schmidt, G. D., & Hines, D. C. 1999, ApJ, 512, 125
- Shemmer & Netzer (2002) Shemmer, O., & Netzer, H. 2002, ApJ, 567, L19
- Stern et al. (2005) Stern, D., et al. 2005, ApJ, 631, 163
- Surdej & Hutsemekers (1987) Surdej, J., & Hutsemekers, D. 1987, A&A, 177, 42
- Turnshek et al. (1988) Turnshek, D. A., Grillmair, C. J., Foltz, C. B., & Weymann, R. J. 1988, ApJ, 325, 651
- Vanden Berk et al. (2001) Vanden Berk, D. E., et al. 2001, AJ, 122, 549
- Wanders et al. (1997) Wanders, I., et al. 1997, ApJS, 113, 69
- Wang et al. (2005) Wang, H.-Y., Wang, T.-G., & Wang, J.-X. 2005, ApJ, 634, 149
- Wang et al. (2007) Wang, H.-Y., Wang, T.-G., & Wang, J.-X. 2007, ApJS, 168, 195
- Wang et al. (1998) Wang, T.-G., Lu, Y.-J., & Zhou, Y.-Y. 1998, ApJ, 493, 1
- Wang et al. (1999) Wang, T. G., Wang, J. X., Brinkmann, W., & Matsuoka, M. 1999, ApJ, 519, L35
- Weymann et al. (1991) Weymann, R. J., Morris, S. L., Foltz, C. B., & Hewett, P. C. 1991, ApJ, 373, 23
- Young et al. (2007) Young, S., Axon, D. J., Robinson, A., Hough, J. H., & Smith, J. E. 2007, Nature, 450, 74
- Zakamska et al. (2003) Zakamska, N. L., et al. 2003, AJ, 126, 2125
- Zheng et al. (1995) Zheng, W., Kriss, G. A., & Davidsen, A. F. 1995, ApJ, 440, 606