Janssen effect and the stability of quasi 2-D sandpiles
Abstract
We present the results of three dimensional molecular dynamics study of global normal stresses in quasi two dimensional sandpiles formed by pouring mono dispersed cohesionless spherical grains into a vertical granular Hele-Shaw cell. We observe Janssen effect which is the phenomenon of pressure saturation at the bottom of the container. Simulation of cells with different thicknesses shows that the Janssen coefficient is a function of the cell thickness. Dependence of global normal stresses as well as on the friction coefficients between the grains () and with walls ( ) are also studied. The results show that in the range of our simulations usually increases with wall-grain friction coefficient. Meanwhile by increasing while the other system parameters are fixed, we witness a gradual increase in to a parameter dependent maximal value.
I Introduction
Pouring a large amount of granular material into a vertical and static cell produces two different, interesting structures depending on the geometrical boundary conditions imposed on the system. In a silo when all the side walls are closed, injection of granular material produces a static granular pack which is a vertical column with a flat and horizontal free surface. Granular packs have been the subject of studies for long time jan ; landry ; sil ; maks ; mueth ; blair ; wolf because, in addition to the practical applications like corn storages in silos, they serve as a useful model for a variety of physical systems. On the other hand, inserting grains into a cell with at least one open boundary, generates a stable heap with finite slope. This non-zero angle to the horizontal, the angle of repose , is one of the most important characteristic of the granular material at macroscopic scales bag ; gh ; bol ; xy1 ; xy2 ; cou ; maleki ; maks2 ; maks3 .
A remarkable feature of deep granular columns is the saturation of vertical stress at the bottom of the silo known as the Janssen effect, named after German engineer H.A. Janssen jan . Janssen was one of the first who studied systematically the effect of pressure screening at the bottom plate of silos and succeeded to present a theoretical framework which accounts for this peculiar behavior of granular matter. In Janssen’s model the granular material is treated as a continuous medium in which a fraction of the vertical stress converts to the horizontal stress. With the further assumption that all the frictional forces exerted by the walls are at the Coulomb failure criterion, he derived the following expression for the value of at the depth of a granular pack in a vertical container:
| (1) |
where is the mass density of the granular material, is the gravitational acceleration, and is the decay length. The decay length (and subsequently the saturated stress ) is related to the cell geometry and wall-grain interaction as well as the grain-grain interactions. Janssen’s theoretical analysis leads to a value of for decay length in which and are the area and circumference of the cell profile respectively and is the friction coefficient between the walls and grains (sometimes and especially in old literature, the value of has been referred to as Janssen’s coefficient). Recent experimental and computational studies revealed that the above formula needs to be modified, and as such, the classical Janssen analysis and specifically the assumption of Coulomb failure is not always satisfied. A number of modified Janssen formulas (which usually mandate a region of perfect hydrostaticity next to the surface) have been suggested which fit the data obtained from real experiments and sophisticated simulations landry ; ned ; vanel ; ovarlez better than the standard Janssen’s formula. However, the concept of pressure saturation at the bottom of the container is still valid.
The Janssen effect originates from the ability of granular materials to support shear stress. The frictional forces exerted by container’s lateral walls carry part of the grains weight. These very frictional forces are also responsible for the formation and stability of a sandpile in a container with an open boundary. At the beginning, when the injected grains fall on the bottom of the cell, the frictional forces between the grains and the cell walls dissipate the major part of the grains kinetic energy, helping the rapid formation of a sandpile. Meanwhile, the presence of lateral walls modifies the angle of repose mostly because of the arching phenomena between front and rear walls gh . In fact, in the case of a thin container (usually called the granular Hele-Shaw cell) many studies have demonstrated that just like the saturated normal stress, the angle of repose is dependent on both cell geometry (here the cell thickness ) and the wall-grain friction coefficient gh ; bol ; xy1 ; xy2 ; cou ; maleki . Courrech et al cou proposed a simple model to incorporate the lateral wall effect on piling via the Janssen effect. This model introduces a new characteristic length defined as , where is the flowing layer height when an induced surface avalanche is about to stop. The predicted growth of in Courrech et al’s model:
| (2) |
is slower than the empirical exponential law gh :
| (3) |
which has been traditionally used to fit their data. Here, is a constant which depends on grain properties and is a characteristic length representing the scale over which the walls affect the piling of grains.
In this paper we are interested in numerical evaluation of the applicability of the Janssen assumptions in the case of quasi 2-D sandpiles formed by pouring granular material into thin vertical Hele-Shaw cells. First we show that, similar to granular packs in silos, the global pressure at the cell’s bottom, , saturates to a limiting value while the mass is increasing. We then investigate the effect of wall-grain and grain-grain friction coefficients on and also global horizontal stress at the front and rear walls. An important issue is the dependence of the Janssen coefficient on system parameters. We examine the effect of the friction coefficients and , as well as cell thickness , on the value of the Janssen coefficient and observe interesting and sometimes unexpected results.
II Model
Our simulations are based on a Distinct Element Method (DEM) scheme, originally proposed by Silbert et al. sil . For the sake of clarity, we review the most important aspects of it here. According to this model, the spheres interact on contact through a linear spring dashpot interaction in the normal and tangential directions to their lines of centers. In a gravitational field , the translational and rotational motions of grain in a system at time , caused by its interactions with neighboring grains or walls, can be described by Newton’s second law, in terms of the total force and torque with the following equations:
| (4) |
| (5) |
Where and are respectively, the mass of grain i and the relative distance between grains i and j. For two contacting grains i, j at positions , with velocities and angular velocities the force on grain i is computed as follows. The normal compression is
| (6) |
The relative normal velocity and relative tangential velocity are given by
| (7) |
| (8) |
where with and . The rate of change of elastic tangential displacement , set to zero at the initial part of contact, is given by silp
| (9) |
The second term in Eq.(9) arises from the rigid body rotation around the contact point and insures that always lies in the local tangent plan of contact. In Eqs. (1) and (2), the normal and tangential forces acting on grain i are given by
| (10) |
and
| (11) |
Where and are elastic and viscoelastic constants respectively and is the effective mass of spheres with masses and . The corresponding contact force on grain j is simply given by Newton’s third law, i.e., . For spheres of equal mass m, as is the case in our system, ; for the linear spring dashpot (Hookian) model with viscoelastic damping between spheres sil .
Static friction is implemented by keeping track of the elastic shear displacement throughout the lifetime of a contact. The static yield criterion, characterized by a local grain friction coefficient , is modelled by truncating the magnitude of as necessary to satisfy . Thus the contact surfaces are treated as “sticking” when , and as “slipping” when the yield criterion is satisfied landry ; Sun .
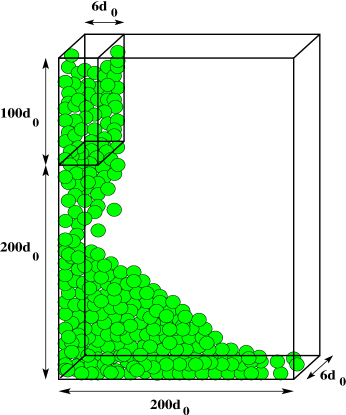
In the following we present the results of our extensive molecular dynamics (MD) simulations md in three dimensions on model systems of mono-disperse, cohesionless and inelastic spheres of diameter and mass . The system is constrained by a rectangular box with fixed rough walls and free top surface, as in fig1. A simulation was started with the random generation of spheres without overlaps from top and left corner of container, followed by a gravitational settling process to form a stable heap. The results are given in non-dimensional quantities by defining the following normalization parameters: distance, time, velocity, forces, elastic constants, and stress are, respectively measured in units of d, , , , , and . All data was taken after the system had reached the steady state. Because of the complexity of the model, there are a wide range of parameters that affect the results of computation. We usually investigate the effect of a single parameter varying in a certain range while other variables are fixed to their base values as listed in Table 1.
All the cases were simulated in three dimensions using a molecular dynamics code for granular materials LAMMPS sil ; Lammps . The equations of motion for the translational and rotational degrees of freedom are integrated with either a third order Gear predictor-corrector or velocity-Verlet scheme Plimpton .
III saturation of wall normal stresses with mass
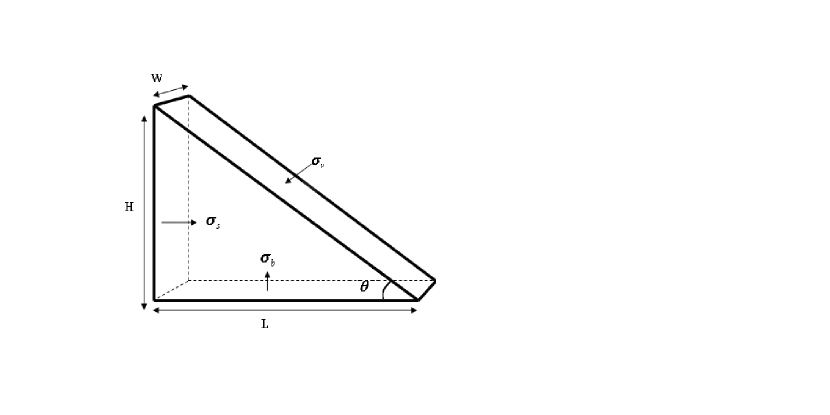
We start from an empty vertical cell composed of two parallel plates (front and rear walls) separated by an spacer with an adjustable width . A granular heap is formed in the cell by pouring the grains on the bottom plate. These grains are released from a small box located on the top-left of the cell (see fig.1 and fig.2) where they have been randomly located in the first place. The number of grains filling the small box, depends on the material density and the size of box. The rate of material insertion can be varied by changing the box size. The process repeated successively. A pile with well defined shape starts to form as the number of the added grains grows. The angle of repose can then be determined from the surface profile of the heap. The angle of repose start from zero and reaches very soon a stable value. Previous studies have demonstrated that the angle remains constant with further insertion of grains maleki .
| Parameters | values |
|---|---|
Maximum Number of grains
|
|
grain-grain friction coef.
|
|
wall-grain friction coef.
|
|
grain normal stiffness coef.
|
|
grain tangential stiffness coef.
|
|
grain normal damping coef.
|
|
grain tangential damping coef.
|
|
wall normal stiffness coef.
|
|
wall tangential stiffness coef.
|
|
wall normal damping coef.
|
|
wall normal damping coef.
|
|
Time step increment |
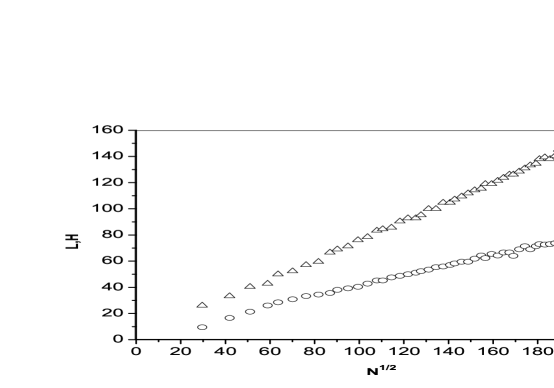
The growth of the height of the pile and length (measured from the pile profile) with grain number in a typical cell with size is shown in fig.3. All the other parameters are as those listed in Table 1. Clearly, the total pile mass , is proportional to the number of grains in the cell. It can be seen from fig.3 that after a short initial time, both and grow linearly with . This is the expected behavior of a pile with constant density and fixed angle of repose .
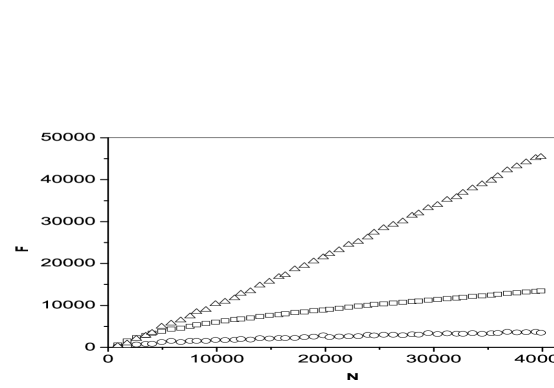
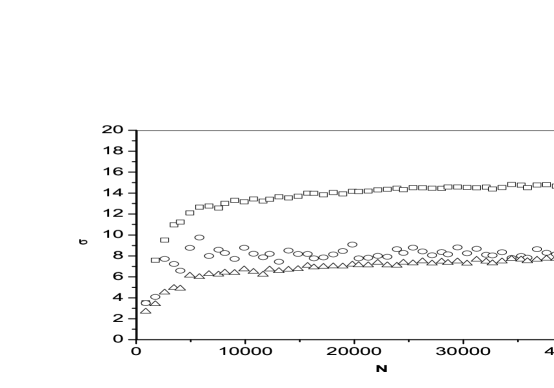
The total normal forces exerted by the front (or rear) wall, , the spacer, , and also the apparent weight of the grain pile, i.e. the normal force exerted by the bottom plate, , are all increasing functions of mass as depicted in fig.4. Further investigations of these curves suggest that while grows linearly with , both and increase linearly with . Given the fact that except for the thickness the other pile linear sizes are growing as , one can deduce that all the global normal stresses (bottom pressure), and (horizontal stress) should approach constant values after the transition period, that is when a well-defined heap has been formed (see fig.5). From the data presented in fig.5 one can see that compared to , the value of is larger at the beginning of the pile formation process. In other words, in small heaps the horizontal stress in the pile is not isotropic. However, as anticipated for very large values of , eventually becomes almost equivalent to , as in to the case of 3-D granular columns.
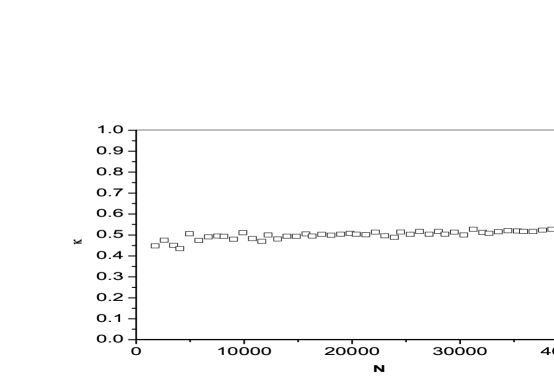
From the obtained values for normal stresses, we have calculated , the fraction of bottom pressure which is taken up by the front and rear walls, , as a function of heap mass. The results presented in fig.6 demonstrate that , starting from smaller values, the Janssen coefficient reaches very quickly to a maximal final value during the filling process. This is in accordance with the Janssen theory which assumes a constant value for independent of the mass of the injected material. Using the evaluated values of in the flat region of the curve, we have estimated for this very case.
IV effect of friction coefficients on wall normal stresses

The difference between real and apparent weight in granular packs and confined sandpiles stems from the ability of the medium to redirect part of the normal stress experienced at the bottom of the container to the vertical walls surrounded it. For this we need a stable network of grains in contact with each other which spreads the forces through at the medium. Obviously, the frictional forces plays the central role here, as they sustain the stability of the contact networks and heap morphology.
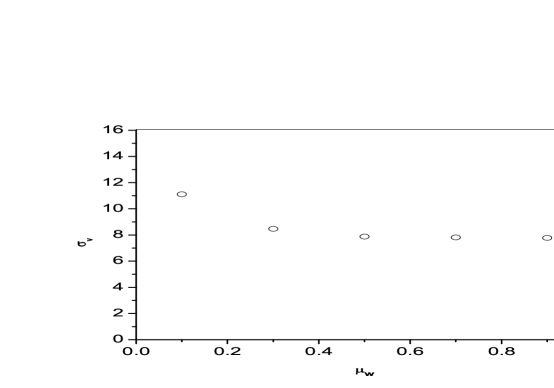
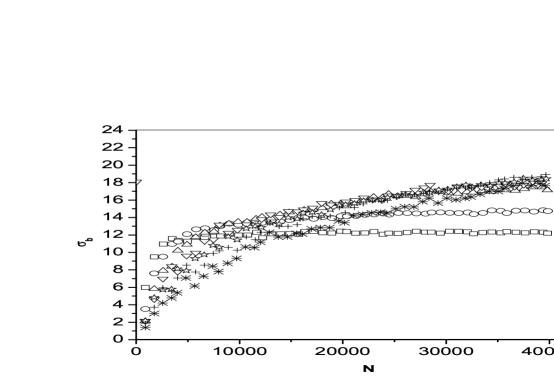
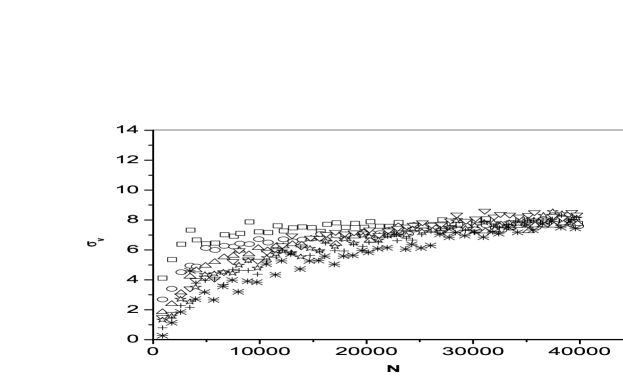
Generally, the contribution of side walls, i.e. the shear stress they impose on the confined granular material depends on the strength of wall-grain frictional forces which is determined by , the wall-grain coefficient of friction. To examine the behavior of the system when changes, we performed a series of simulations on different heaps all formed in a cell of thickness but with different wall friction coefficient . All the other parameters including grain-grain friction coefficient have been fixed to the basic values listed in Table1. From the data we have calculated the variation of normal stress , and the behavior of the horizontal stress , with the grain number . For more clarity we have also sketched in separate sheets the values of and as a function of , for the maximum grain number we used in our simulations, (see fig.9 and fig.10). Inspection of these curves shows that the wall normal stresses almost cease to change with when it passes the value of , reach to their final minimal values. In other words, for a granular material with specified grain parameters, there is an upper limit to the contribution of walls in carrying the weight of material. The case of is an exception. The frictional forces between the container (and specially the friction applied by the bottom) are too small and as such the formation of a heap with steady angle of repose needs more times (grains).
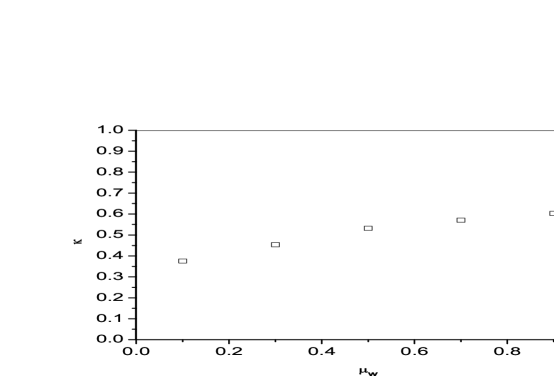
From the above data we are also able to make an almost precise estimate of the dependence of on by calculating the value of for different values of (fig.11). Keeping track of variation of during the filling process we find out that the fraction of bottom pressure converted to horizontal stress is almost constant, and the variation of with mass always follows a trend like that of fig.6. Therefore, the estimated values for Janssen coefficient, presented in fig.11 are precise even for the case of . This figure also suggests that grows with but the growth slows down at larger values of .
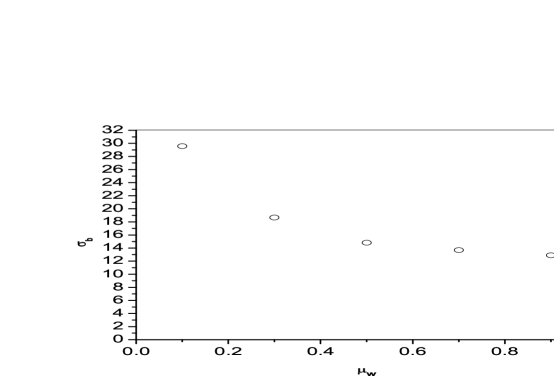
It is believed that one of the most effective medium parameters at the microscopic level is the grain-grain friction coefficient ned . Therefore, we performed a series of simulations for some selected values of while the other parameters have been kept constant. The obtained values for wall normal stresses and in a pile consisting of at most grains have been presented in fig.12 and fig.13 respectively. Comparison of fig.12 with fig.9 shows that increasing each of the friction coefficients ( or ) decreases to a parameter dependent asymptotic value. However, side-wall normal stress shows an opposite trend. As can be seen from fig.13, increases with before it eventually saturates to a final value at larger . Considering the fact that the plie angle of repose grows with both and , one can deduce that both wall-grain and grain-grain frictional forces increase the stability of the sandpile but in two different ways. Increasing while is kept constant, enhances total wall frictional forces as the maximum wall friction ( can be each of the wall normal forces , , or ) might increase even if decreases. On the other hand, by increasing grain-grain friction coefficient, the horizontal normal stresses increase, as suggested by fig.13. These also leads to the strengthening of the maximum frictional force experienced at each side walls.
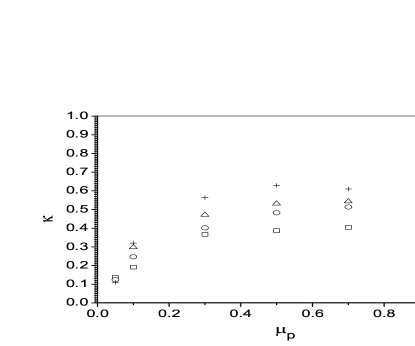
Of particular interest is the way friction coefficients affect the behavior of the Janssen coefficient. We have chosen four different values for and , and calculated the variation of with for each case. The results are summarized in a unique diagram in fig.14. From this figure we find that putting aside the case , the value of starts to grow rather rapidly at small values of , to a final maximal value which is itself an increasing function of in all curves. Our simulations also show that for the case the value of is almost insensitive to the variation of wall-particle friction coefficient. This might be assigned to the isostaticity of the granular packing when is too small, similar to the phenomenon observed in Ref.7. Besides, the saturation of with does not show a simple trend: while the flat part of the first three curves happens to start at , it begins at a value of much smaller than for the fourth curve (). This observation resembles to the results of Ref.7 too, which demonstrate the force ambiguity does not follow a monotonic variation with .
It should be noted that for a more comprehensive study of the effect of friction coefficients on we need to extend the range of variation of and on the logarithmic scale. But the problem is that for small values of a heap hardly formed. In fact, a more suitable system for such experiments is a granular pack formed in a silo instead of a granular heap. Because the formation of a well defined pack is always guaranteed even if the frictional forces are not significant.
V Approaching to 3-D sandpiles
The effect of the cell thickness on the stability of a confined sandpile has been the subject of both experimental and numerical studies gh ; bol ; xy1 ; xy2 ; cou ; maleki . Careful experiments and measurements reveal that the presence of front and rear walls increases greatly the angle of repose as well as the maximal angle of movement (the maximal angle that a granular medium can reach when carefully tilted). These observations show that by increasing the cell thickness, the angle of repose, , decreases and it eventually settles down to an asymptotic value when the cell thickness becomes very large compared to the size of grains. The observed phenomenon is universal and does not depend on the formation history of the pile.
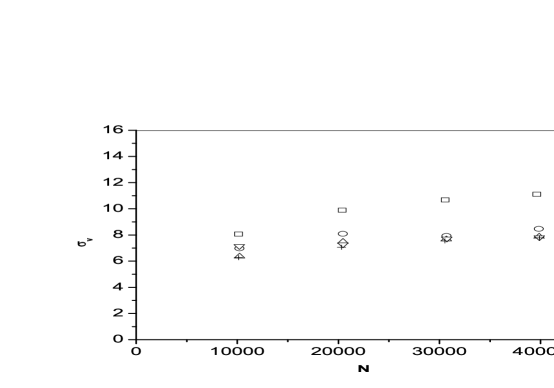
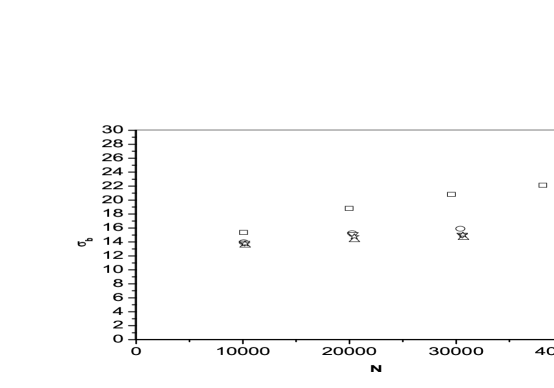
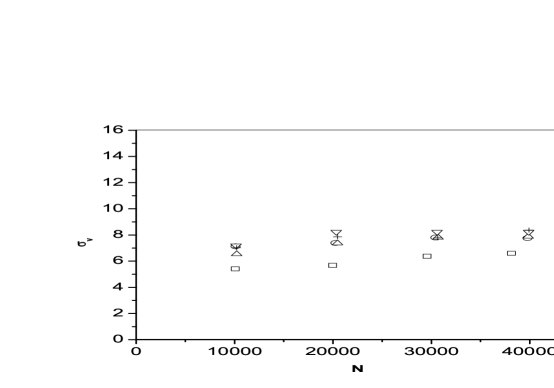
To investigate the effect of on the wall normal stresses, we conducted a series of simulations on cells with different thicknesses, where all the other system parameters ad boundary conditions are as listed in Table1. The results for and are presented in fig15 and fig.16. These curves indicate again that normal stresses are going to saturate with mass for all the cell thickness but with different rates. An interesting feature is that although grows with cell thickness at smaller values of , but the grows stops when becomes large compared to a single grain size. Meanwhile, the behavior of normal stresses at lateral walls is different. In fact the values of and (not shown) decrease with at smaller cell thickness but again it seems both of them become almost independent when is large enough. These behaviors are very similar to the variation of with gh ; xy1 ; xy2 ; cou ; maleki . In both cases there seems to be a transition from quasi two dimensional systems when the cell is just few grain diameters across, to three dimensional case where the thickness of the container is much greater than a single grain size.
Let us consider now the behavior of , the the fraction of bottom stress which is redirected to each of the side walls, with the cell thickness grows to higher values. In fig.17 we have presented our calculation of and for cells with different , all of them contain grains. The other parameters are the basic values listed in Table1. As the figure shows, for small values of the major fraction of is converted to side-wall normal stresses making the contribution of frictional forces more pronounced at these small scales. However when the spacing between front and rear walls become large, compared with the size of constituent grains, and consequently the normal stress exerted by front or rear wall approaches constant values. In fact, the behavior of is very similar to the way varies with . This is a new concept and should be considered in physical modelling of wall effects on the angle of repose of confined heaps ( as well as angle of movement), especially when the spacing between front and rear walls is of the order of few grain diameters.
VI CONCLUSIONS
We have used 3-D MD simulations to investigate the effects of a container’s walls on the stability of sandpiles formed by pouring dried spherical grains into a container with small separation between front and rear walls. We observed the Janssen’s effect, namely the saturation of global pressure at the bottom of the container, although the geometry is different from the traditional silos where the standard Janssen analysis is applied. The same behavior has been observed for front or rear wall’s normal stresses and the vertical slab supporting the pile. Increasing the size of the container we witnessed the saturation effects again but at larger number of grains. We saw that for larger cell thickness, the saturation of normal stresses happened at larger values of mass, with stress at the bottom plate of the container increases with and the opposite trend for .
We have also studied the dependence of the wall normal stresses with wall friction coefficient and with grain friction coefficient and found that increasing both of these parameters causes a reduction in normal stress felt at the cell’s bottom. Meanwhile, we saw that the mechanisms of the observed reduction in apparent weight while a friction coefficient is increasing, depends on which of and is subject to change. While the results of simulations show that by increasing wall-grain friction coefficient , the horizontal stress approaches smaller values, the changes are such that the overall value of which is the maximum of wall friction becomes larger and as such a stable heap with greater forms. On the other hand, when is fixed and grows, we saw an increase in the calculated values of , which means the wall friction limit , is again growing with .
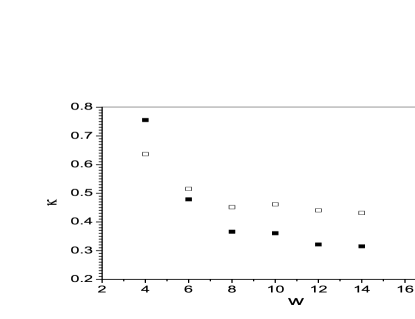
We have estimated the Janssen’s coefficient and found that not only the grain properties, but also the cell geometry and wall- grain interaction affect this quantity. Our observations suggest that kappa is affected by cell thickness when is less than about and therefore, the conventional assumption of being only dependent to the granular material microscopic characteristics is under question at small . We believe that this is a new concept and should be considered in theoretical treatment of granular material at small scales. The variation of with when other experimental parameters are kept constant is also interesting. Our observations indicate that grows almost linearly with for small values but reaches to an asymptotic value at larger values of . Meanwhile, when is not too small, increasing enhances the pressure transmission from bottom to the vertical walls, making an increasing function of .
We are thankful to E.Nedaaee Oskoee for his help and J.Stivenson for reading this manuscript carefully. We are also grateful to IASBS parallel computer center for the computer facilities.
References
- (1) M. Sperl, Granular Matter 8, 59 (2006).
- (2) J. W. Landry, G.S. Grest, L.E. Silbert, and S.J. Plimpton Phys. Rev. E 67 041303 (2003)
- (3) L.E. Silbert, D. Ertaş, G.S. Grest, T.C. Halsey D. Levine, and S. Plimpton, Phys. Rev. E 64 051302 (2001)
- (4) H.A. Makse, D.L. Johnson, and L.M. Schwartz, Phys. Rev. Lett. 84, 4160 (2000).
- (5) D.M. Mueth, H.M. Jaeger, and S.R. Nagel, Phys. Rev. E 57 3164 (1998).
- (6) D.L. Blair, N.W. Mueggenburg, A.H. Marshal, H.M. Jaeger, and S.R. Nagel, Phys. Rev. E 63, 041304 (2001).
- (7) T. Unger, J. Kertész, and D.E. Wolf, Phys. Rev. Lett. 94, 178001 (2005)
- (8) R.A. Bagnold, Proc. Roy. Soc. London A 225, 49 (1954).
- (9) Y. Grasselli and H.J. Herrmann, Physica A 246, 301 (1997).
- (10) P. Boltenhagen, Eur. Phys. J. B 12,75 (1999).
- (11) Y.C. Zhou, B.H. Xu, A.B. Yu, Phys. Rev. E 64, 021301 (2001).
- (12) Y.C. Zhou, B.H. Xu, A.B. Yu, and P. Zulli, Powder Technol. 125, 45 (2002).
- (13) S. Courrech du Pont, P. Gondret, B. Perrin, and M. Rabaud Europhys. Lett 61, 492(2003).
- (14) H.Maleki, F.Ebrahimi , and E.Nedaaee Oskoee, J. Stat. Mech., P04026, 2008.
- (15) H.A. Makse, S. Havlin, P. King, and H.E. Stanley, Nature 386, 379 (1997).
- (16) H.A. Makse, P. Cizeau, and H.E. Stanley, Phys. Rev. Lett. 78, 3298(1997)
- (17) R.M. Neddermam, Statics and Kinematics of Granular Materials (Cambridge University Press, cambridge, 1992).
- (18) L. Vanel and E. Clement, Eur. Phys. J. B 11, 525 (1999).
- (19) G. Ovarlez and E. Clement, Eur. Phys. J. E 16, 421 (2005)
- (20) J. Sun, F. Battaglia, and S. Subramaniam, Phys. Rev. E 74, 61307 (2006).
- (21) D. Frenkel, and B. Smit, Understanding Molecular Dyndmics Simulation from Algoritm to Application Vol. 1, Academic Press, 2002).
- (22) http://lammps.sandia.gov/
- (23) S.J. Plimpton, J. Comput. Phys., 117 1(1995).