Spectra of Type Ia Supernovae from Double Degenerate Mergers
Abstract
The merger of two white dwarfs (a.k.a. double degenerate merger) has often been cited as a potential progenitor of type Ia supernovae. Here we combine population synthesis, merger and explosion models with radiation-hydrodynamics light-curve models to study the implications of such a progenitor scenario on the observed type Ia supernova population. Our standard model, assuming double degenerate mergers do produce thermonuclear explosions, produces supernova light-curves that are broader than the observed type Ia sample. In addition, we discuss how the shock breakout and spectral features of these double degenerate progenitors will differ from the canonical bare Chandrasekhar-massed explosion models. We conclude with a discussion of how one might reconcile these differences with current observations.
1 Introduction
Type Ia supernovae are among the strongest explosions observed by astronomers. These thermonuclear bombs dominate the production of many iron-peak elements in the universe. Their near-uniform and easily calibrated light-curves have allowed astronomers to use them as probes into the universe and the nature of cosmology. However, despite their extreme importance, we still do not understand the details of their explosion mechanism nor do we understand the exact nature of their progenitor. Although it has been argued that white dwarf systems with masses below the Chandrasekhar limit may produce thermonuclear explosions and, in WD-WD collisions, this is generally true (Raskin et al., 2009; Rosswog et al., 2009), it is generally believed that most type Ia supernovae are produced as an accreting WD is pushed above the Chandrasekhar mass limit (see Livio 2001 for a review). In this paper, we study the progenitors of these Chandrasekhar-massed explosions.
The exact nature of the binary progenitor that leads to the WD accretion is also a matter of debate. The wide range of type Ia progenitors have been divided into two clases (see Livio et al. 2000 for a review): double degenerate mergers where the white dwarf accretes material during the merger with a white dwarf companion, and the single degenerate scenario where the white dwarf accretes material from a normal star (typically giant star) companion. Although simulations of double degenerate mergers suggest that some of these mergers produce type Ia supernovae (Yoon et al., 2007; Pakmor et al., 2010), it is believed that most of these mergers will form accretion-induced collapse implosions instead of type Ia supernovae (Nomoto & Kondo, 1991; Nomoto et al., 2001; Livio, 2001). Based on stellar accretion models, we would assume that the primary progenitor of type Ia supernovae is the single degenerate accretion scenario.
However, population synthesis calculations currently argue against the single-degenerate scenario. To date, population synthesis calculations predict roughly an order of magnitude more double than single degenerate scenarios (see Livio 2001 for a review). The double degenerate merger rate is consistent with the observed supernova rate (hence, the single-degenerate rate is an order of magnitude too low to explain observations).
The rate is not the only observational constraint we have on the progenitor of type Ia supernovae. The spectra from supernova outbursts provide clues as well. Höflich (2005) has used the light-curve and spectral observations of supernovae to constrain the progenitor, the environment and the details of the explosion. Among these, one can constrain the level of asymmetry and the mass of the white dwarf. Both sub- and super-Chandrasekhar white dwarfs produce features (e.g. slow rise/decline in the super-Chandrasekhar white dwarfs) that differ from standard type Ia supernovae, arguing that most Ia explosions are produced in the explosion of a Chanrasekhar-massed white dwarf(Mazzali et al., 2007). In this paper, we combine population synthesis studies of binary mergers, hydrodynamical models of mergers and radiation-hydrodynamics calculations to study the observational implications for the double degenerate Type Ia progenitor scenario. This combined theoretical effort allows us to make definitive observational predictions for the double degenerate scenario. Comparing these predictions with observations can place limits on the fraction of Type Ia supernovae produced by double degenerate progenitors.
The codes used in this paper have been detailed in other papers. In Chapter 2, we briefly describe the codes used and outline how we couple the codes together. This coupling of codes allows us to make stronger predictions than have been made in the past. Most important is the coupling of stellar merger models, guided by population synthesis models, to our light-curve calculations. We describe the fate of these mergers and how they couple to light-curve calculations in Chapter 3. The environment created by these mergers drastically affects the emission from these explosions. In chapter 4 we study the effects of this environment on the initial shock emergence. Chapter 5 discusses the light-curves and spectra around peak for these explosions. We conclude with comparisons to supernova observations and their subsequent constrants on the double degenerate scenario.
2 Code Description
Our populations synthesis studies are from the simulation results of Ruiter et al. (2009) which used the StarTrack population synthesis code. A detailed description of the algorithm and the input physics is given in Belczynski et al. (2002, 2008). Ruiter et al. (2009) found that, assuming all COCO mergers above a Chandrasekhar mass produced Ia supernovae, the double-degenerate scenario dominated the total, time-integrated Ia rate (although, depending upon the model, the rate of single degenerate mergers can be comparable after about 2 Gyr after a burst of star formation). Here they assumed ONe white dwarfs above a Chandrasekhar mass collapsed to form neutron stars and there were no CO-He mergers with masses above the Chandrasekhar limit. In this paper, we use the distributions of the total system mass from these simulations to guide our type Ia progenitors.
Based on the masses in our population synthesis, we model the merger of two CO cores using the SNSPH code (Fryer et al., 2006). This code follows the evolution of the merger from the onset of Roche-lobe overflow through the disruption of the companion white dwarf. These simulations provide us with a realistic description of the distribution of matter surrounding the white dwarf after the dynamical phase of the merger. Analytic estimates of the cooling (including convection) in this post-merger structure allows us to place limits on the density structure at the time of explosion. We use this range of structures to calculate the range of light-curves and spectra we expect from these systems.
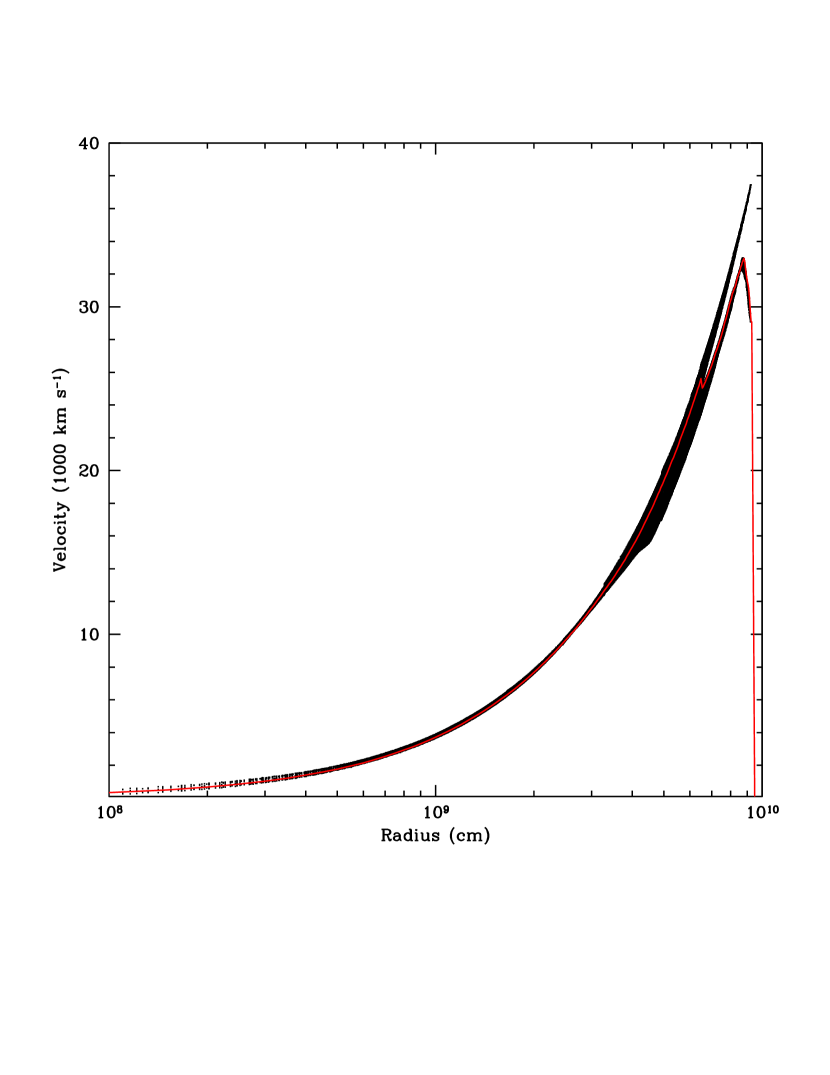
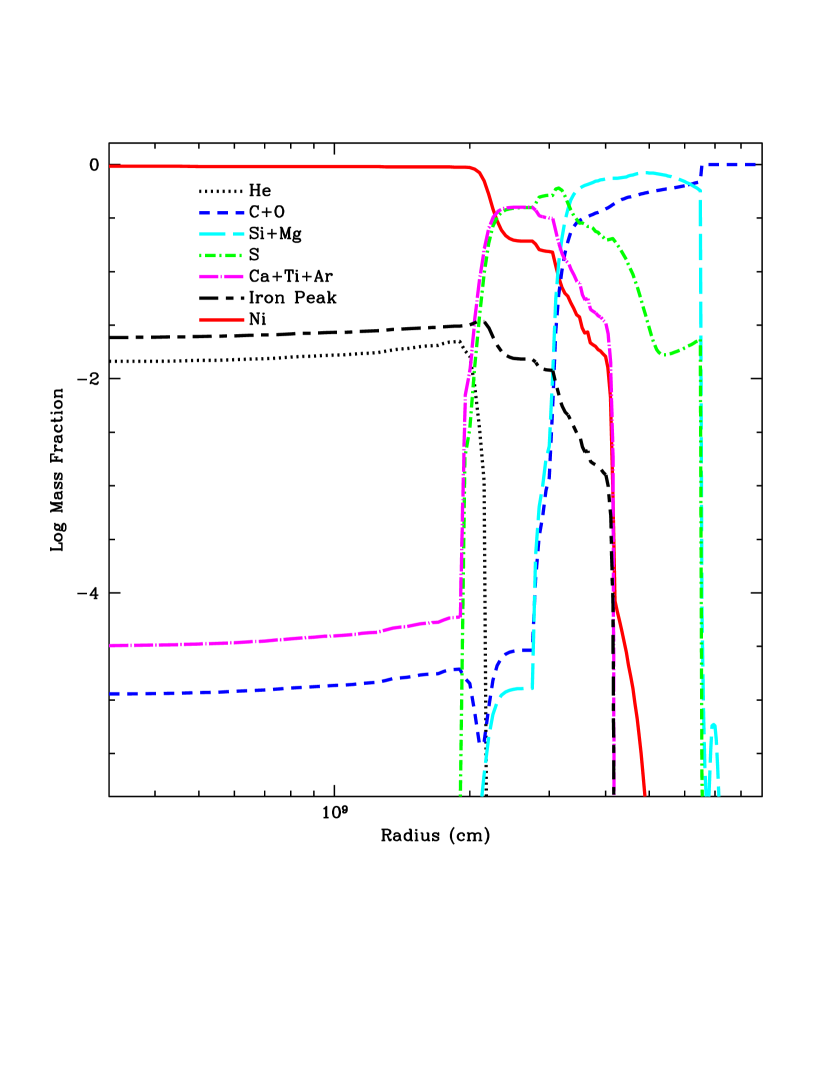
Our supernova is produced in a gravitational confined detonation model (Plewa et al., 2004) from the Chicago FlASH team (Meakin et al., 2009). The explosion simulation uses the FLASH code (Fryxell et al., 2000) and is modeled in 3-dimensions, which we have then mapped into 1-dimension. A comparison of our 1-dimensional explosion velocity profile on top of the 3-dimensional profile is shown in figure 1. Although we are modeling the general radial profile of this explosion with our mapping, this explosion is clearly multi-dimensional and any comparison of this explosion model to data will require multi-dimensional light-curves. However, this explosion provides a modern explosion with which to do our comparisons. The corresponding yields for our 1-dimensional mapping are shown in figure 2. We reduced the yields to 14 representative elements for our opacities: H, He, C, O, Ne, Mg, Si, S, Ar, Ca, Ti, Cr, Fe, and 56Ni. The total 56Ni yield in this explosion is 0.7M⊙. For most of the models, the explosion energy is roughly erg, but we included a series of weak explosions as well erg.
The results from the above codes are all brought together in our calculations of the emission using the LANL supernova light-curve code Fryer et al. (2009). These calculations couple a radiation-hydrodynamic simulation using the RAGE (Fryer et al., 2007; Gittings et al., 2008) code with post-process spectra. Both codes use the LANL OPLIB database (Magee et al., 1995) for opacities. Although the RAGE code is capable of running with a large set of photon energy groups, the current calculations use a single group Rosseland-mean averaged opacity using the OPLIB database. For the post-process calculations, we use the full frequency-dependent opacity information (14,900 groups) from this database. The 1-dimensional structure is mapped into a multi-dimensional profile (each zone is divided into 80 angular bins). By choosing a line-of-sight and calculating the emission along the entire exploding star, we model the entire ejecta including limb effects. This approach also allows us to calculate the full Doppler effect of the expanding material, including red- and blue-shifted opacities. For more details, see Fryer et al. (2009). With these calculations, we can compare our different merger environments to predict observational trends between these models.
3 Stellar Merger and Subsequent Accretion
In this paper, we use the results from the population synthesis models from Ruiter et al. (2009) to guide our initial progenitor mass distribution. Figure 3 shows the results of three simulations using different parameters for the common envelope evolution: model 1: prescription 111The common envelope follows a prescription: where is the gravitational constant, , and are the mass of the primary, the initial mass of the donor and final mass of the donor stars respectively, and are the initial and final orbital separations, is the donor Roche lobe radius and is a measure of the central concentration of the donor (Webbink 1984). where , model 2: prescription where , model 3: prescription where =1.5. The prescription of model 3 is similar to that of Nelemans & Tout (2005)222The common envelope is treated as a evolution of the angular momentum as mass is lost from the system: where and are the change in the angular momentum and mass respectively, and being the initial angular momentum and mass. is the efficiency at which angular momentum is lost with mass (de Kool, 1990; Nelemans et al., 2000; Nelemans & Tout, 2005).; the difference being that we assume this -formalism for common envelope evolution every time a common envelope event is encountered. Nelemans & Tout (2005) use both a and depending on the nature of the common envelope (the -formalism is never used in our population synthesis model 3).
There are a number of different formation channels producing COCO mergers. Changing the common envelope efficiency and/or prescription changes both the rate and the relative importance of these channels. Overall, our model 1 produces the most massive COCO mergers. Model 2, with its lower common-envelope removal efficiency, produces smaller orbits after the first common envelope phase. Many of these systems merge before the formation of the second white dwarf (see Ruiter et al. 2009 for details). These two models are standard models from Ruiter et al. (2009) and we will focus on their results in this paper. Although the two simulations predict different rates and merger times, they have several similarities. Both mass distributions are double peaked, one M⊙, the other M⊙. If we restrict ourselves to only those systems with total masses above the Chandrasekhar limit, over a third of the systems lie in the peak at M⊙.
Our population synthesis caluclation using the prescription (model 3), however, produces even fewer massive COCO mergers than our prescription models. This is mainly due to the fact that the dominant formation channel which contributes to COCO white dwarf mergers at MM⊙ in the first two models is nearly absent in model 3 (producing no “secondary spike” of events M⊙). We will discuss this further in chapter 6.
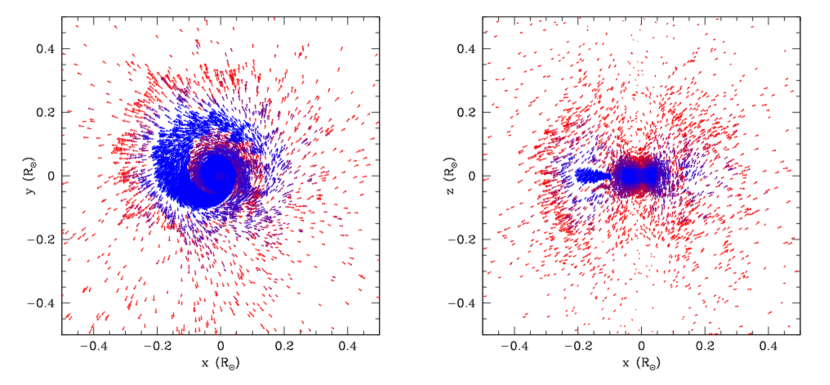
With the peak in total system masses around M⊙, we modeled the merger of a 0.9 WD with a 1.2 WD. We follow this merger until the less-massive white dwarf is completely disrupted. This leaves behind a compact core with an extended merger envelope (Fig. 4). As with our explosion model, the structure is highly aspherical. Nonetheless, for this study, we map this structure into a 1-dimensional profile (Fig. 5). As the core accretes above the Chandrasekhar limit, it will collapse (and possibly produce a type Ia explosion). Above this white dwarf is the rest of the debris from the merger. The density profile of this debris has a good deal of structure, but in 1-dimension, it is reasonably well-fit by: where is the radius from the center and is the density at radius .
For the system modeled in our merger, the inner 1.4 M⊙ will accrete onto the white dwarf fairly quickly. By using the conditions at the end of our merger calculations, we estimate the cooling time (set to where is the energy in this inner atmosphere, dominated by radiation, and is the radiative flux out of this inner material) to be s. As this material cools, it accretes onto the white dwarf, ultimately pushing it above the Chandrasekhar limit. If this produces a thermonuclear explosion, it will drive a shock through the remaining 0.7 M⊙. Due to the short cooling time of the inner material, the density profile of this outer 0.7 M⊙ will be very similar to its initial state (its cooling time is many orders of magnitude longer). For our light-curve calculations, we use this profile. With less massive mergers, the characteristics of the density profile might change slightly, but this profile should not change. We use this profile for the bulk of our simulations. If the time-scale is much longer and the atmosphere reaches an equilibrium, entropy-driven instabilities will produce a constant entropy atmosphere (Houck & Chevalier, 1992; Colgate et al., 1993). For these compact object systems, the atmosphere is reasonably well described by an profile and this represents the shallow extreme of the possible density profiles. To test the dependence of our results on this choice, we model one calculation with an profile.
Assuming this power law density distribution, we can then set the initial conditions of our models as a function of total envelope mass. For our light-curves, we use 3 different envelope masses: 0.1, 0.35, and 0.7 M⊙. This corresponds to total binary masses of 1.5, 1.75, and 2.1 M⊙. The companion star could be a He white dwarf or a CO white dwarf. We set the composition to these two separate abundances (helium vs. carbon and oxygen)333These helium masses are not included in our population synthesis models and the higher masses are not physical. But these models give us an idea of how composition can affect the spectra and light-curves.. The entire suite of models is summarized in Table 1444This table also includes many of the observational results discussed in chapter 5..
4 Shock Emergence
Our radiation-hydrodynamics simulations are ideally suited to calculating the initial emergence and early evolution (through peak) of these buried type Ia supernovae. The radiation-hydrodynamics simulations allow us to include any additional shock heating as the exploding white dwarf interacts with its surroundings. Simulations that calculate radiative transfer on a homologous outflow scheme will not include this shock heating. In addition, at shock breakout, the material temperature is not set entirely by the radiation. This disequilibrium betwen radiation and matter can not be modeled by pure radiation calculations.
We use the density/temperature profiles of these calculations to provide input for our detailed ( energy group) calculations of the spectra. With these spectra as a function of time, we can calculate the light-curves in any energy band (see Fryer et al. 2009 for details).
As the type Ia supernova expands, the density at the head of the shock decreases. The first visible emission of the supernova explosion occurs when this density becomes so low that radiation is no longer trapped in the flow. Höflich & Schaefer (2009) recently studied this emergence of the supernova shock. For a normal type Ia supernovae, they argued that this occurs when the shock is roughly at 9000 km. At shock emergence, the type Ia emits a burst (up to erg s-1) of X-ray and gamma-ray radiation. Piro et al. (2010) argue that the emission peaks closer to erg s-1. In both cases, the emission has dropped considerably by 1 s.
This shock emergence is similar to shock breakout of type Ib/c and II supernovae in that the initial emission is driven by the thermal energy in the shock. The temperature in the shock tends to be high, resulting in an initial burst of high-energy photons. The primary difference is that the progenitor stars of type II supernovae are more extended and the radiation remains trapped until the shock breaks out of the star ( km). Type Ib/c stars are more compact, but their strong winds are sufficiently dense to trap the radiation until the shock is further out as well. At these higher radii, the thermal temperature is much lower, and the breakout emission tends to be at much shorter wavelengths (UV and X-ray bands). The corresponding emission timescale is longer (Frey et al. 2010).
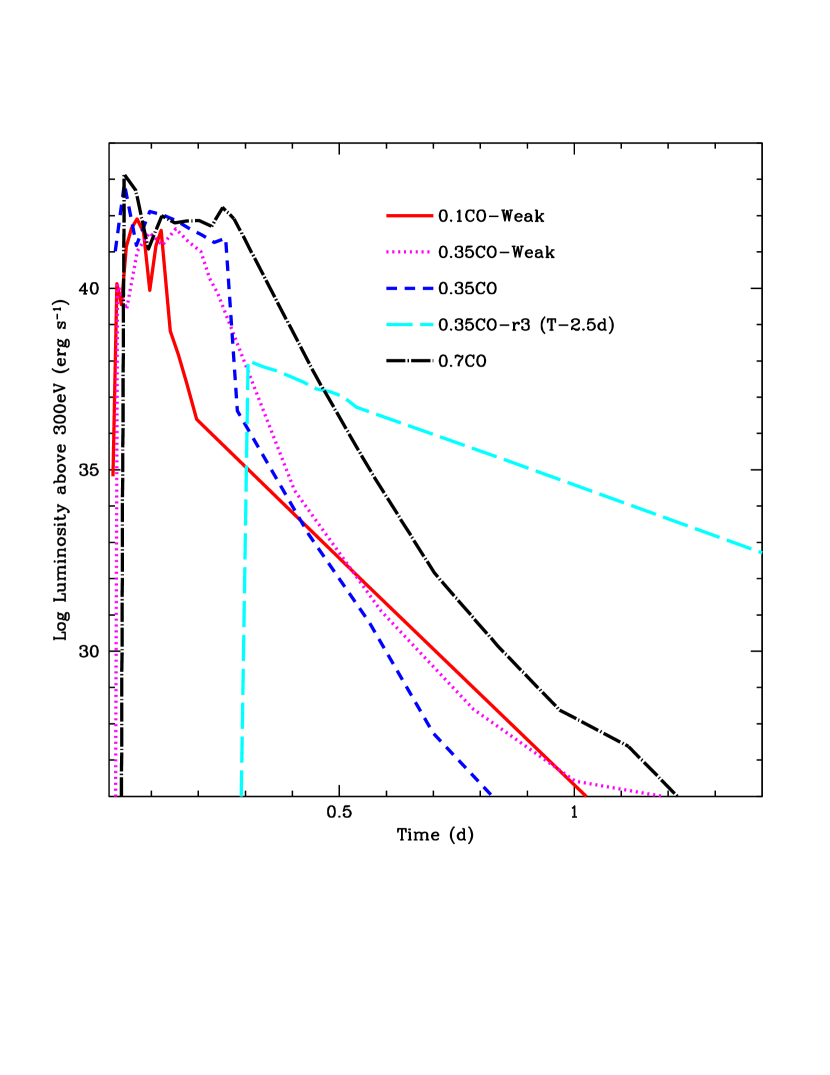
The type Ia SNe from WD mergers studied in this paper are very similar to the shock breakout in Type II supernovae. The merger debris acts similarly to a Ib/c wind, trapping the radiation until the shock is well beyond the white dwarf itself ( cm for our steep, density profiles and cm for the shallower profiles). For explosions on a bare white dwarf, the radiation becomes untrapped when the shock breaks out of the white dwarf, roughly cm (Höflich & Schaefer, 2009). This leads to a longer emission timescale and a smaller peak emission in the X-ray than that predicted for normal (“bare”) Type Ia supernovae (Höflich & Schaefer, 2009; Piro et al., 2010). Figure 6 shows the total emission above 300eV for 5 of our models. In most cases, the peak in the X-ray flux arises within half a day of the explosion. The peak emission is roughly 1042 erg s-1 and this peak lasts 10,000-30,000 s (0.11-0.35 d). As the surrounding material increases, so does the duration of the X-ray emission. But the structure of the density profile plays a large role in determining the peak flux and duration. Note that the model with 0.35 surrounding material with the dependendence on the density has a much later peak (2.8 d after explosion) and a peak flux of only erg s-1.
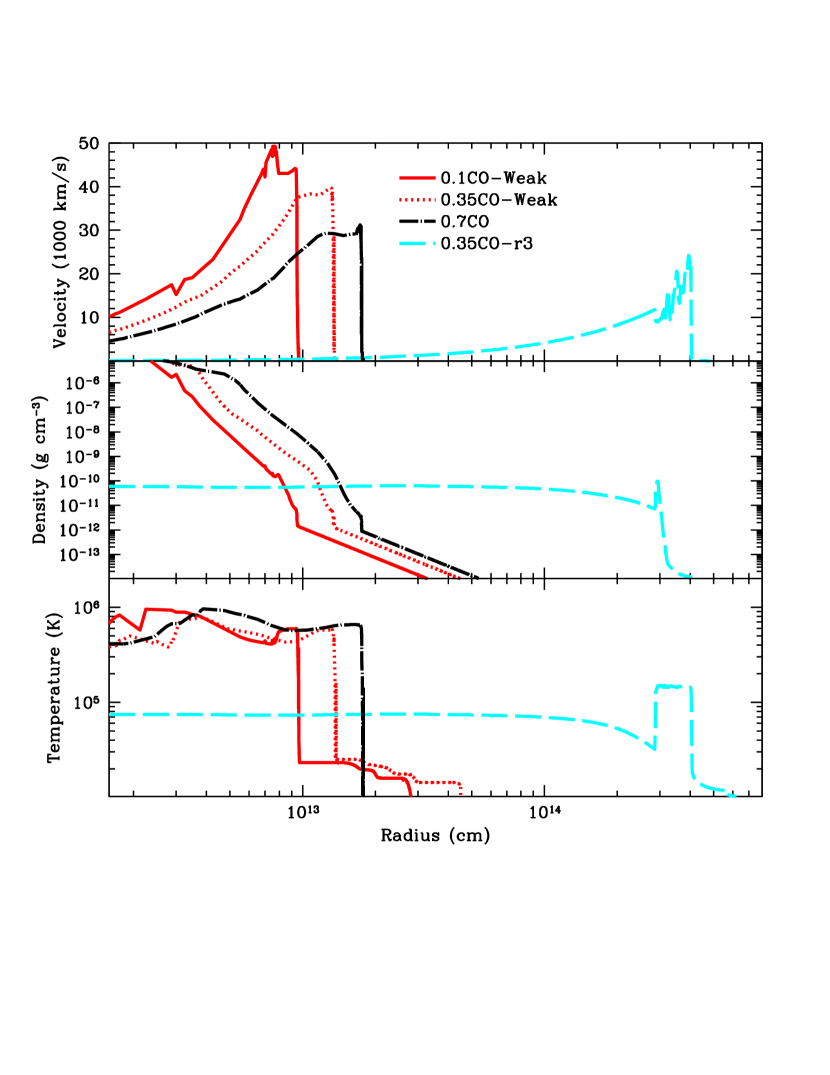
These trends are easy to understand based on the mass of the surrounding atmosphere. Figure 7 shows the velocity, density and temperature structures of 4 of our models at shock breakout. We expect the breakout to occur when the shock hits the photosphere (or roughly when the mean free path is on par with the width of the shock). The width () of the shock grows with time, roughly staying a constant fraction of the shock size or position: . The mean free path is given by where is the opacity in . Setting the mean free path equal to the shock width and using our density profile ( where depends linearly on the envelope mass) , we find:
| (1) |
Solving for , we obtain:
| (2) |
The ratio of the shock breakout radii () for two different envelope masses () is simply:
| (3) |
We expect, then, that the shock in the 0.7 M⊙ model to experience shock breakout roughly 1.9 times further out than the 0.1 M⊙ model. The duration of the breakout should be roughly proportional to where is the shock velocity. Hence, we also expect longer durations for our more massive atmospheres (From figure 7, we see that both the radius is bigger and the radial velocity is smaller).
The primary outlier in this picture is the shallower density profile model. But the same physics explanations apply. The shallower density means that shock breakout occurs at much higher radii. Not only is the breakout delayed (and the duration of the breakout is longer), but at these large radii, the shock has cooled, leading to a much weaker signal. To accurately calculate the breakout emission, we will need to have accurate estimates of the density profile of the surrounding material.
Can we use shock breakout emission to constrain the progenitor? If the breakout emission is extended for more than 1000 s, we are assured that non-neglibile material lies on top of the exploding white dwarf. Technically, the duration scales with the amount of mass on top. But as we have found from altering our density profile, the profile is as important, if not more important, than the total amount of mass. Until we have accurate models of the merger process and can model the explosions through these profiles in multi-dimensions, it will be difficult to constrain the exact mass of the system from shock breakout alone.
5 Spectra and Light-Curves Near Peak
We are not limited solely to the shock breakout light-curve. The surrounding material will also affect the light-curve and spectra near peak. Especially for these enshrouded type Ia, shock heating remains an important feature of the light-curve through peak and our radiation-hydrodynamics calculations are ideally suited for calculating spectra and light-curves of these supernovae.
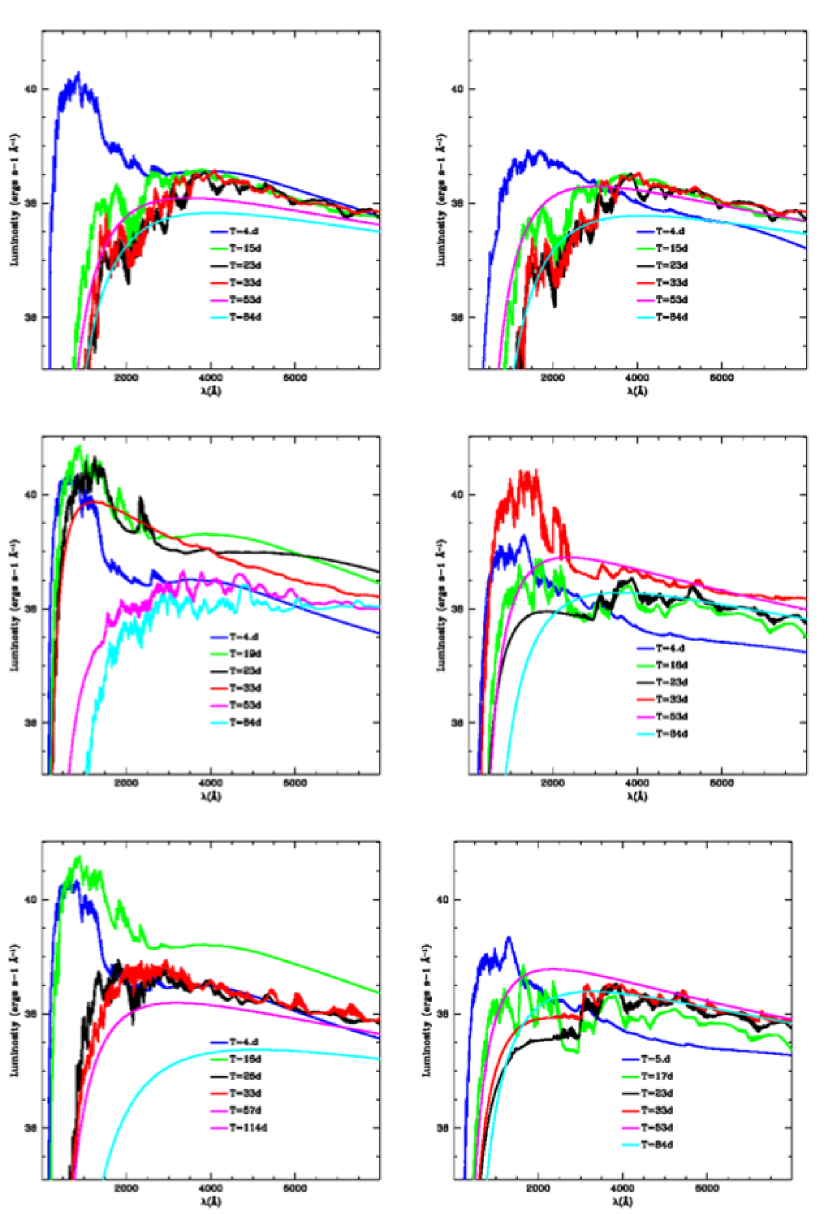
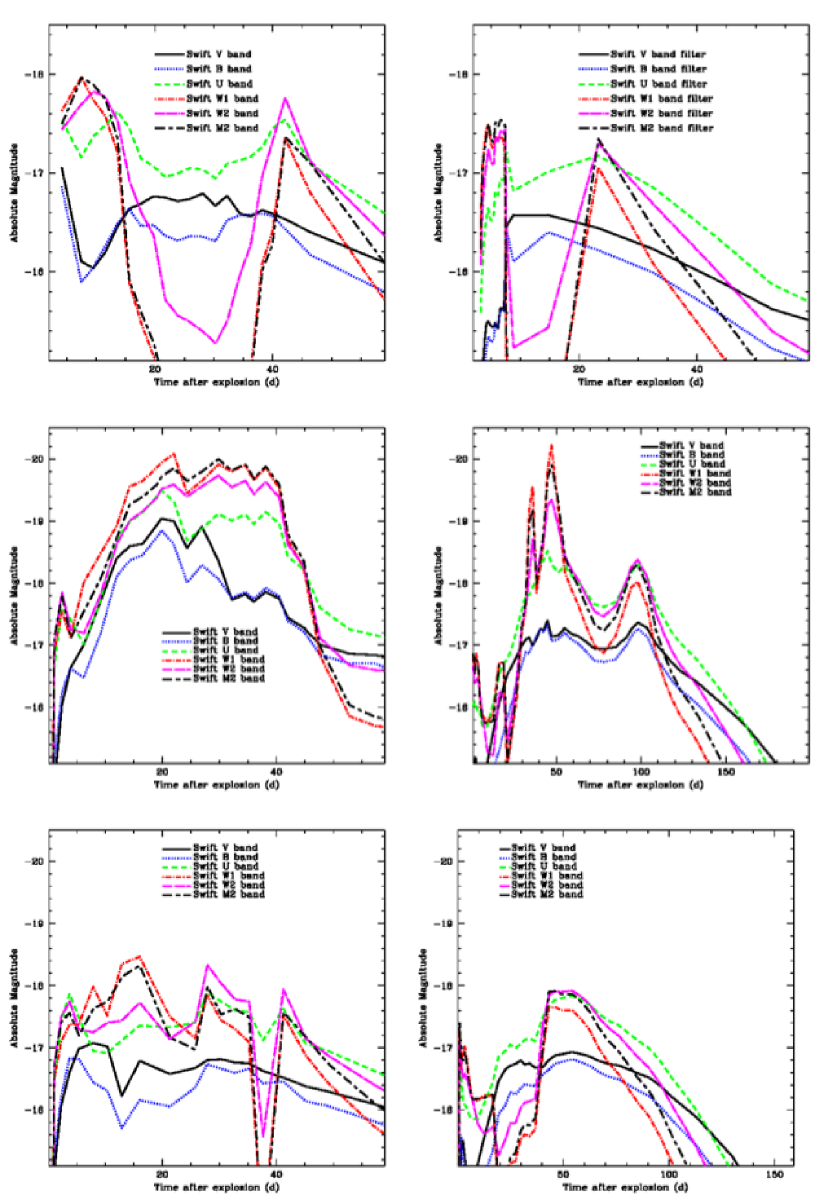
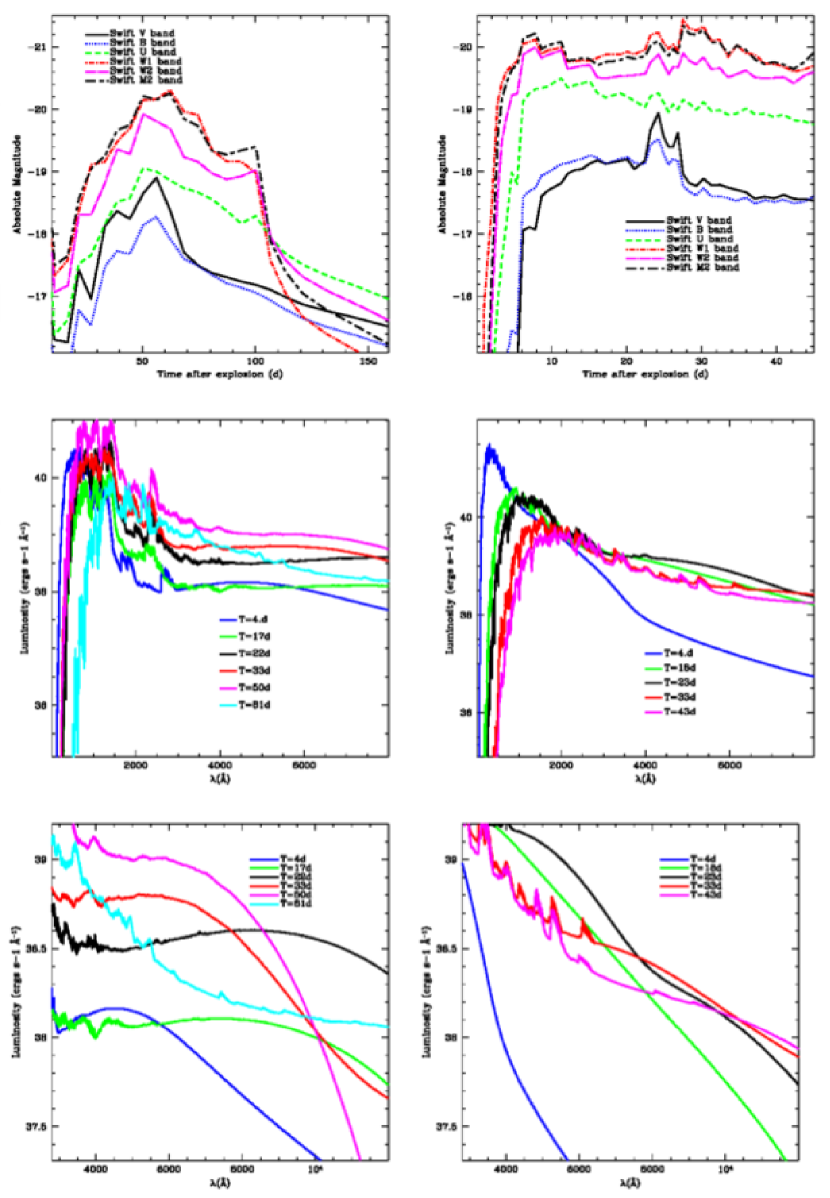
Our basic suite of light-curve models consists of 3 different envelope masses: 0.1, 0.35, and 0.7 M⊙, corresponding to total binary masses of 1.5, 1.75, and 2.1 M⊙. For each envelope mass, we model two simulations, one assuming the envelope is composed of carbon and oxygen, the other assuming it is all helium (see Table 1 for details). In this way, we study not only the double degenerate progenitor consisting of two CO cores, but also the dependence on the composition of the debris. Figure 8 shows the spectrum over a broad wavelength and flux range for each of our 6 models. The corresponding light-curves for a range of wavelength filters are shown in Figure 9.
Let us review the trends in the light-curves first. One pervasive feature of a surrounding environment is that it can delay initial photon emergence. The surroundings trap the photons longer, delaying the UV burst. In addition, shock heating as the explosion hits this surrounding environment produces high temperatures and longer (or second) UV outbursts. This means that the UV outburst may still be strong at peak V-band emission. A large flux shorter than 1500 at peak V-band is a strong indicator of a large surrounding environment and, hence, a double-degenerate progenitor. If we further increase the mass of the surrounding medium, the radiation is trapped longer. This will produce a broader light-curve. But shock heating plays a larger role in driving the supernova, and this extra energy source makes it more difficult to analyze the light-curve.
Many of these trends can be seen in figure 9. With a 0.1 M⊙ surrounding environment, the light-curves of the helium and carbon/oxygen mergers are very similar. The V-band peaks between 15-30 d with an absolute magnitude dimmer than -17. The UV emission is initially bright at first emergence from the expanding ejecta and then peak again due to shock heating (20-40 d). The peak UV emission predicts absolute magnitudes near -17 in all the Swift bands.
As the environment mass increases, so does this peak emission. With a 0.35 M⊙ surrounding environment, the UV emission peaks at absolute magnitudes of -20. Shock heating is dominating this UV emission. For a helium envelope, where the opacity is lower because the helium in the envelope is quickly ionized, the UV emission is broadened and peaks at -20. The V-band also peaks higher (-19), but decays in 10 d by over a magnitude. For C/O envelopes with their higher opacities, the UV peaks high (-20) at later times than its helium counterpart. In addition, the V-band is strongly broadened. Even after 60 d, it is within 0.2 magnitudes of its peak.
At still higher envelope masses (0.7 M⊙), photons are trapped longer. When photons do escape, the temperature of the ejecta is lower, leading to lower UV emission than in our 0.35 M⊙ case. Even for helium surroundings, the V-band emission begins to produce a broader peak. But this broadening is exacerbated in the high-opacity C/O surroundings. For massive C/O envelopes, the V-band is still rising after 60 d.
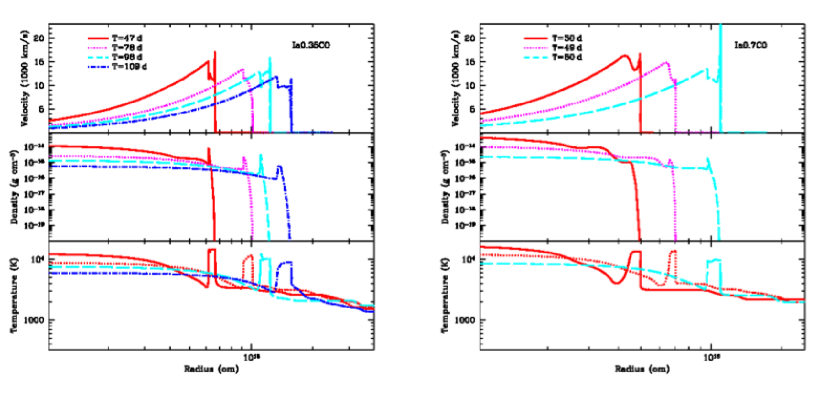
The behavior of these light-curves is very different from those of normal Type Ia supernovae. These differences, in part, can be understood by the differences in the structure of the star throughout peak. Figure 10 shows the velocity, density and temperature profiles of our standard 0.35 and 0.7 envelopes at a range of times during the peak breakout emission. Note that the shock remains at the boundary between trapped flow and free-streaming throughout peak. The front of the shock is pushing through low-density media and emitting nearly at the free-streaming limit. But the width of the shock as defined by the temperature profile is roughly a mean-free path thick. This is very different than an inner, optically thick blackbody source assumed in bare type Ia supernovae. In addition, although the velocity profile approaches a homologous outflow, it is not quite a homologous outflow. Small variations in the shock temperature can cause large variations in the emission, especially the UV emission.
This complexity, especially the fact that shock heating is playing a role in the light-curve, makes it difficult to make detailed predictions from enshrouded type Ia supernovae. There are a few robust claims. First, enshrouded Ia supernova (with more than 0.1 of surrounding material) should have broader V-band light-curves. The light-curves are, in part, powered by shock heating, and these shocks lead to higher UV emission. Thus far, the current set of Swift UV type Ia supernova light-curves do not show this high UV emission (Brown et al., 2009), suggesting that none of these observed outbursts are enshrouded type Ia supernovae.
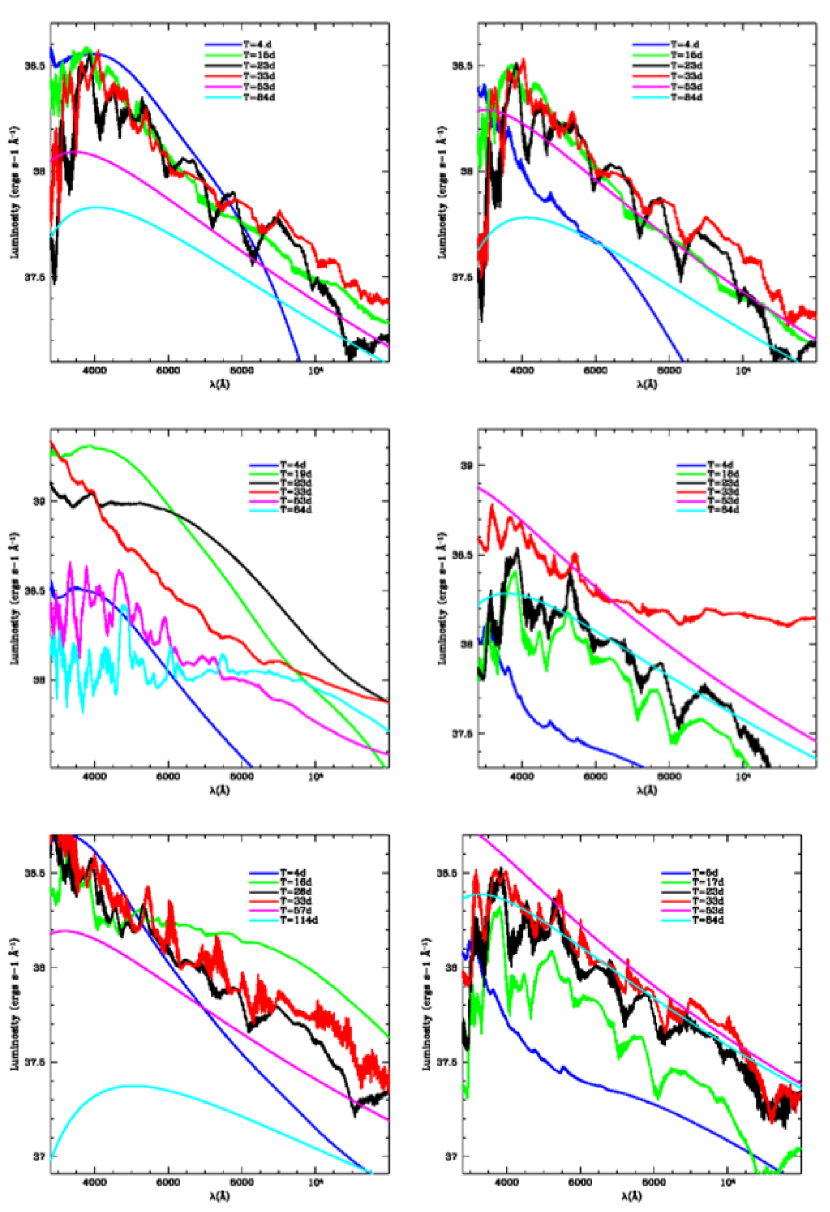
Strong UV emission and/or extremely broadened V-band peaks are tell-tale signatures of massive C/O surroundings. Figure 11 shows the full spectra for our models. Near peak, we see the strong calcium and silicon lines we expect in a type Ia supernova. With the uncertainties in the explosion and the outer density structure, it is possible to produce spectra at peak that fit many observed type Ia supernovae.
But the spectra at early times are much more sensitive to the surrounding medium. For example, a broad absorption feature at due to CaII H&K and Si II is present at early times in observed type Ia supernovae Bufano et al. (2009), but it is not present before peak in some of our models. The surrounding C/O material dominates the absorption features near peak, lessening the absorption features by synthesized elements until peak. Early observations may be the key to finding distinguishing spectral features.
We have run a series of other models, varying the explosion energy and the density profile. These models all show the same trends, extended light-curves and enhanced UV emission. For example, figure 12 shows the light-curves and spectra of two of these models: a weaker explosion and a shallower density profile. The peak in the weak explosion occurs later than our standard energy explosion, but the duration of the peak (e.g. the time the absolute visible magnitude is above -18) is roughly comparable to the standard explosion. A shallower density profile produces a dimmer, but much longer duration, outburst.
We end with one cautionary note on exact line comparisons. A major difference in our models is that our post-process spectral calculations are built on top of a true “two-temperature” radiation hydrodynamics calculation. By “two-temperature”, we refer to the fact that the material temperature is affected by shocks as well as the radiation. In typical type Ia supernova calculations, shock heating is neglected (it is argued that does not play a role in the observed emission for photons with wavelengths longer than the X-ray or UV). For these enshrouded progenitors, shock heating is more important and our models include this effect. But our models currently lack the detailed resolution at the photosphere to catch line features sensitive to the narrow region just beyond. And we have not yet included the fact that the excitation levels of each atom are not described by a single equilibrium temperature. Although the broad features discussed here will not change, many of the details of the spectra will change as more accurate models are made.
6 Putting it all together
In this paper, we have combined population synthesis studies of the double degenerate scenario for type Ia supernovae with merger calculations of these CO/CO binaries to produce the environments surrounding this type of type Ia supernova. We have then modeled the propagation of a modern explosion simulation through this environment to produce light-curves of these enshrouded type Ia supernovae. The surrounding environment both delays and extends the X-ray flux in shock breakout, producing an initial X-ray signature much closer to the shock breakout of a type Ib/c supernova than that seen in the shock emergence of a bare type Ia. The subsequent V-band peak is extended and is much broader than typical Ias. Finally, although the peak and post-peak spectra will display the same lines as normal supernova, the early spectra will be dominated by carbon and oxygen lines only.
We have made a number of approximations in our calculations. We assumed that the density profile maintained its steep, profile. If the surrounding atmosphere redistributes, we would expect a slightly flatter profile. Our test model with a profile produced an initial X-ray flash that occurs later and the visible light-curve is broader and dimmer. Flattening the density profile produces an explosion very different than typical Ia supernovae.
Another approximation we made was to spherize the inherently multi-dimensional merger and explosion models. The merger debris is asymmetric, slightly denser in the orbital plane. The light curve will be affected if the explosion is also asymmetric, sending a weaker explosion along the orbital plane. To test this affect, we modeled a weaker explosion. Although the light-curve peaked later, it was similarly broad to our strong explosion, again not matching the typical type Ia supernova.
All of these results argue that these enshrouded systems can not explain normal type Ia supernovae. And, such systems must be less common than normal type Ia supernovae to avoid dominating our current Ia supernova sample. Pakmor et al. (2010) argued that mergers, with a weak explosion, might explain sub-luminous mergers. They found that the only issue with such an explanation is that the merger model produced light-curves that were slightly broader than the observations. If they had run radiation-hydrodynamics calculations (including the energy from shock heating), it is likely that the light curves would be even broader, making an even worse fit to sub-luminous models.
Astronomers have argued for other forms of enshrouded type Ia systems, especially for the case of Supernova Ias with hydrogen envelopes. For example, supernova 2002ic is fit well by models invoking a wind profile with mass loss rates in excess of 0.01 M or circumstellar material extending out to cm with a possible gap between the exploding white dwarf and this circumstellar material (Chugai et al., 2004; Deng et al., 2004; Kotak et al., 2004; Wood-Vasey et al., 2004). Supernova 2005gj may be similar (Aldering et al., 2006). Our surrounding debris is much more compact, concentrated below cm.
Some systems exist with strong carbon lines, suggesting incomplete C/O burning (Mazzali et al., 2001; Tanaka et al., 2008). Typically these systems have considerable silicon from this partial burning. If the envelopes of double degenerate mergers are particularly compact, we might be able to match these systems, but we haven’t studied such systems here.
But if double degenerate systems are to dominate the Ia sample, why don’t we observe them?
One explanation for the lack of observations of these enshrouded type Ia supernovae is simply that CO/CO mergers do not produce type Ia supernovae. Nomoto and collaborators (Nomoto & Kondo, 1991; Nomoto et al., 2001) have argued that the high accretion rate in these systems will preferentially lead to the collapse of the merged white dwarf system to a neutron star. The resultant explosion will still produce a supernova-like explosion, but could be much dimmer than what we studied here (Fryer et al., 2009).
However, other possible explanations exist. Our current stellar models predict too-large CO white dwarf masses. There is some evidence that the 12C/12C fusion rate has been under-estimated. By increasing this rate, Herwig et al. (in preparation) found that the maximum CO white dwarf mass is much lower (as low as 0.8). In such a case, the maximum total merger mass from CO binaries would be below 1.6. A number of ONe binaries would exist in this scenario, but these mergers are expected to collapse to neutron stars, yielding the dimmer supernova discussed in the previous paragraph.
Another potential explanation is that our standard population synthesis models predict a peak at around 2M⊙ in the total mass distribution of type-Ia producing CO/CO mergers, arguing for massive surrounding envelopes (). But by modifying the prescription for binary mass transfer, i.e., by adopting the -formalism (model 3) rather than the -formalism, the peak at disappears, arguing that most mergers with masses above the Chandrasekhar limit occur with masses within 0.1 M⊙ of this limit 3. Without a better understanding of common envelope evolution, population synthesis models may simply be unable to predict the mass distribution of merger WD binaries accurately. Perhaps there are simply few enshrouded type Ias and most systems only have of surrounding material or less. If such systems can explode to form type Ia supernovae, their observations would not be so distinct from the current type Ia population.
What we can say for certain is that the spectral and light-curve features of double degenerate mergers with total system masses in excess of roughly 1.5-1.6 do not match normal type Ia supernovae. These super-Chandrasekhar mergers can not dominate Ia progenitors.
References
- Aldering et al. (2006) Aldering, et al. 2006, ApJ, 650, 510
- Belczynski, Kalogera & Bulik (2002) Belczynski, K., Kalogera, V., & Bulik, T. 2002, ApJ, 572, 407
- Belczynski et al. (2008) Belczynski, K., Kalogera, V., Rasio, F.A., Taam, R.E., Zezas, A., Bulik, T., Maccarone, T.J., & Ivanova, N. 2008, ApJS, 174, 223
- Brown et al. (2009) Brown, P.J., Holland, S.T., Immler, S., Milne, P., Roming, P.W.A., Gehrels, N., Nousek, J., Panagia, N., Still, M., Vanden Berk, D. 2009, AJ, 137, 4517
- Bufano et al. (2009) Bufano, F., Immler, S., Turatto, M., Landsman, W., Brown, P., Benetti, S., Cappellaro, E., Holland, S.T., Mazzali, P., Milne, P., Panagia, N., Pian, E., Roming, P., Zampieri, L., Breeveld, A.A. Gehrels, N. 2009, ApJ, 700, 1456
- Colgate et al. (1993) Colgate, S.A., Herant, M., & Benz, W. 1993, Phys. Rep., 227, 157
- Chugai et al. (2004) Chugai, N.N., Chevalier, R.A., Lundqvist, P. 2004, MNRAS, 355, 627
- Deng et al. (2004) Deng, J., Kawabata, K.S., Ohyama, Y., Nomoto, K., Mazzali, P. A., Wang, L., Jeffery, D.J., Iye, M., Tomita, H., & Yoshii, Y. 2004, 605, L37
- de Kool (1990) de Kool, M., 1990, ApJ, 358, 189
- Fryxell et al. (2000) Fryxell, B., Olson, K., Ricker, P., Timmes, F.X., Zingale, M., Lamb, D.Q., MacNeice, P., Rosner, R., Truran, J.W., Tufo, H. 2000, ApJS, 131, 273
- Fryer et al. (2006) Fryer, C.L., Rockefeller, G., & Warren, M.S. 2006, ApJ, 643, 292
- Fryer et al. (2007) Fryer, C.L., Hungerford, A.L., & Young, P.A. 2007, ApJ, 662, L55
- Fryer et al. (2009) Fryer et al. 2009, ApJ, 707, 193
- Gittings et al. (2008) Gittings, M., Weaver, R., Clover, M., Betlach, T., Byrne, N., Coker, R., Dendy, E., Hueckstaedt, R., New, K., Oakes, W.R., Ranta, D., Stefan, R. 2008, Comp. Sci. and Disc. 1, 015005
- Höflich (2005) Höflich, P. 2005, in 1604-2004: Supernovae as Cosmological Lighthouses, ASP Conference Series, Vol. 342, Proceedings of the conference held 15-19 June, 2004 in Padua, Italy. Edited by M. Turatto, S. Benetti, L. Zampieri, and W. Shea. San Francisco: Astronomical Society of the Pacific, 2005., p.372
- Höflich & Schaefer (2009) Höflich, P. & Schaefer, B.E. 2009, ApJ, 705, 483
- Houck & Chevalier (1992) Houck, J.C. & Chevalier, R.A. 1992, ApJ, 395, 592
- Kotak et al. (2004) Kotak, R., Meikle, W.P.S., Adamson, A., Leggett, S.K. 2004, MNRAS, 354, L13
- Livio (2001) Livio, M. 2001, in Supernovae and Gamma-Ray Bursts: The Greatest Explosions since the Big Bang, ed. M. Livio, N. Panagia, & K. Sahu (Cambridge: Cambridge Univ. Press), 334
- Magee et al. (1995) Magee, N.H., Abdallah, J. Jr., Clark, R.E.H., Cohen, J.S., Collins, L.A., Csanak, G., Fontes, C.J., Gauger, A., Keady, J.J., Kilcrease, D.P., Merts, A.L. 1995, Astron. Soc. of the Pac., 78, 51
- Mazzali et al. (2001) Mazzali, P. A. 2001, MNRAS, 321, 341
- Mazzali et al. (2007) Mazzali, P. A., Röpke, F. K., Benetti, S., & Hillebrandt, W. 2007, Science, 315, 825
- Meakin et al. (2009) Meakin, C.A., Seitenzahl, I., Townsely, D., Jordan, G.C., Truran, J., Lamb, D. 2009, ApJ, 693, 1188
- Nelemans et al. (2000) Nelemans, G., Verbunt, F., Yungelson, L.R., Portegies-Zwart, S.F. 2000, A&A, 360, 1011
- Nelemans & Tout (2005) Nelemans, G., & Tout, C.A. 2005, MNRAS, 356, 753
- Nomoto & Kondo (1991) Nomoto, K., & Kondo, Y. 1991, ApJ, 367, L19
- Nomoto et al. (2001) Nomoto, K., Umeda, H., & Kobayashi, C. 2001, in Birth and Evolution of the Universe, proceedings of the 4th RESCEU International Symposium, ed. K. Sato & M. Kawasaki (Universal Academy Press), 235
- Pakmor et al. (2010) Pakmor, R., Kromer, M., Roepke, F. K., Sim, S. A., Ruiter, A. J., & Hillebrandt, W. 2009, Nature, 463, 61
- Piro et al. (2010) Piro, A.L., Chang, P., & Weinberg, N.N. 2010, ApJ, 708, 598
- Plewa et al. (2004) Plewa, T., Calder, A.C., & Lamb, D.Q. 2004, ApJ, 612, L367
- Raskin et al. (2009) Raskin, C., Timmes, F. X., Scannapieco, E., Diehl, S., & Fryer, C. 2009, MNRAS, 399, L156
- Rosswog et al. (2009) Rosswog, S., Kasen, D., Guillochon, J., & Ramirez-Ruiz, E. 2009, ApJ, 705, L128
- Ruiter, Belczynski & Fryer (2009) Ruiter, A.J, Belczynski, K., & Fryer, C. 2009, ApJ, 699, 2026
- Tanaka et al. (2008) Tanaka, M., Mazzali, P.A., Benetti, S., Nomoto, Ken’ichi, Elias-Rosa, N., Kotak, R., Pignata, G., Stanishev, V., Hachinger, S. 2008, ApJ, 677, 448
- Webbink (1984) Webbink, R.F. 1984, ApJ, 277, 355
- Wood-Vasey et al. (2004) Wood-Vasey, W.M., Wang, L., & Aldering, G. 2004, 616, 339
- Yoon et al. (2007) Yoon, S.-C., Podsiadlowski, P., & Rosswog, S. 2007, MNRAS, 380, 933
| Name | MEnvelope | Envelope | Vpeak | VFWHM | UVpeak | UV |
|---|---|---|---|---|---|---|
| M⊙ | Composition | Abs. Mag. | d | Abs. Mag. | Features | |
| 0.1co | 0.1 | CO | -17 | 35 | -17 | Double Peak |
| 0.1he | 0.1 | He | -17 | 45 | -17 | Double Peak |
| 0.35co | 0.35 | CO | -19 | 100 | -20 | Double Peak |
| 0.35he | 0.35 | He | -17 | 30 | -20 | Broad (40 d) |
| 0.7co | 0.7 | CO | -17 | 100 | -18 | Delayed (40 d rise) |
| 0.7he | 0.7 | He | -17 | 100 | -18 | Broad ( d) |
| 0.35co Weak | 0.35 | CO | -19 | 40 | -20 | Delayed (60 d rise) |
| 0.1co Weak | 0.1 | CO | -17 | 40 | -17 | Delayed (100 d rise) |
| 0.35co-r3 | 0.35 | CO | -19 | -20 | Broad |