Superconductivity-Induced Distortions of Phonon Lineshapes in Niobium
Abstract
Superconductivity-induced changes of phonon lineshapes in niobium have been re-investigated by high-resolution inelastic neutron scattering. We show that the changes go beyond a simple change in lifetime and frequency when the phonon frequency is close to the superconducting energy gap . The observed lineshapes in elemental niobium are qualitatively similar to those found previously in borocarbide superconductors and agree very well with those predicted by the theory of Allen et al. [PRB 56, 5552 (1997)]. Our results indicate that the peculiar phonon lineshapes in the superconducting state predicted by the theory of Allen et al. are a general phenomenon and not restricted to a particular class of compounds.
pacs:
74.25.Kc,74.70.-bI Introduction
Superconductivity-induced changes of the frequency and the linewidth of phonons with strong coupling to the electronic system have been observed in conventional superconductors a long time agoAxe73 ; Shapiro75 . Similar effects were later found in high- cuprate superconductors as wellKrantz88 ; Friedl90 ; Pyka93 . When the phonon under investigation has a frequency smaller than the superconducting energy gap, there is a sudden drop in frequency as well as in linewidth on cooling through the superconducting transition temperature . This effect can be understood on the basis that the coupling of such a phonon to the electrons vanishes in the superconducting state because phonons can no longer excite electron-hole quasi-particle pairs as soon as their energy is smaller than . For phonons with frequencies above an increase in linewidth was reported for (refs. Axe73, ; Shapiro75, ), which is due to the pile-up of electronic states just above , i.e. the region in the electronic spectrum where the phonon couples to.
The early publications on superconductivity-induced changes of phonon lineshapes concluded that these changes can be entirely described by changes of phonon frequencies and phonon lifetimes. In other words, it appeared that the intrinsic phonon lineshape remains Lorentzian below . However, marked deviations of the phonon lineshape from a Lorentzian were later observed in borocarbide superconductors, in particular in YNi2B2C (ref. Kawano96, ) and LuNi2B2C (ref. Stassis97, ). For a particular acoustic phonon, the lineshape below did so little resemble a Lorentzian that the authors in Ref. Kawano96, thought to have observed a new type of excitations. These results motivated theoretical work aiming at explaining the strange lineshapes observed in experiment. In one of the theoretical papers, i.e. that of Kee and VarmaKee97 , anomalous lineshapes were linked to a pole in the electronic polarizability in the superconducting state that appears near extremum vectors of the Fermi surface. This means that only phonons with wave vectors corresponding to a nesting vector of the Fermi surface are expected to show anomalous lineshapes in the superconducting state. The other theory put forward at that time, i.e. that by Allen and co-workersAllen97 , predicted lineshapes as observed in experiment quite generally, without any need for a strong nesting.
The question which theory is more appropriate remained undecided for several years. Recently, we were able to show by studying phonons in YNi2B2C (ref. Weber08, ) with various momentum transfers that the theory of Allen et al.Allen97 gives a very good account of the experimental observations for all cases, which also means that nesting is not a prerequisite for the appearance of anomalous lineshapes in the superconducting state. Rather, the only relevant parameters are the ratios of the phonon frequency over the superconducting energy gap and of the linewidth in the normal state over the phonon frequency. Thus, similar effects as observed in borocarbide superconductors should show up in other superconductors as well, and one might ask why they have not been seen so far. When comparing the phonon properties of various superconductors with those of YNi2B2C we found that the latter compound is particularly favorable for such a study. In most other compounds, the predicted effects are so small that they are easily overlooked. That is to say, the effects are nearly or completely washed out by the resolution of available neutron spectrometers.
When searching for a superconductor other than the borocarbides to check the theory of Allen et al.Allen97 we came upon elemental Niobium, which has a lower than YNi2B2C, i.e. instead of , but still a fairly strong electron-phonon coupling. The relatively strong electron-phonon coupling in Nb was the reason that it was chosen for an early inelastic neutron scattering study of the effects of superconductivity on phonon frequencies and phonon lineshapes, i.e. that of Shapiro et al.Shapiro75 . The authors of this study did not mention to have observed any non-lorentzian lineshapes. It seems that the instrumental resolution in this study was insufficient to make any such deviation eye-catching. Very recently, superconductivity-induced changes of phonon linewidths have been investigated by a new technique, i.e resonant spin-echo neutron spectroscopyAynajian08 . This technique is very powerful for detecting small intrinsic lineshapes, much smaller than can be detected by classical triple-axis neutron spectrometers. On the other hand, evaluation of the raw data relies heavily on the assumption that the intrinsic lineshape is lorentzian in nature, and any deviation from a Lorentzian gives rise only to second order effects. Therefore, it is understandable that any deviations from a Lorentzian went unnoticed in this study.
In this paper, we use again classical triple-axis neutron spectroscopy to investigate phonons in Nb above and below . We show that with improved resolution non-lorentzian lineshapes as predicted by theory are indeed observable. We further show that the theory of Allen et al.Allen97 gives a very good account of superconductivity-induced changes also for phonons with energies well below and above , i.e. for phonons where the lineshape is not anomalous in the superconducting state, which further adds credence to this theory.
II Experimental
The neutron scattering experiments were performed on the 1T triple-axis spectrometer at the ORPHEE reactor at LLB, Saclay. Pyrolytic graphite was used both as monochromator and analyser. They were horizontally and vertically focusing, but tight collimation before and after the monochromator as well as before and after the analyser made the horizontal curvature ineffective. The tight collimation (25-20-20-30) was necessary to achieve a sufficiently good resolution in energy and momentum space. In principle, it would have been desirable not to make use of the vertical curvature as well in order to improve the momentum resolution in the direction vertical to the scattering plane. As will be discussed below, the relaxed vertical resolution led to asymmetric phonon lineshapes. However, tightening the vertical resolution would have led to exceedingly long counting times and therefore, we had to adapt our analysis to take the effects of the relaxed vertical resolution into account. Achieving a good resolution required moreover to choose a low final energy, i.e. . A graphite filter in the scattered beam was used to suppress higher orders.
The sample was a single crystal of Niobium having the shape of a cylinder of in diameter and high with its long axis being parallel to the crystallographic direction. Measurements were carried out in the scattering plane. The crystal was mounted in a standard orange cryostat allowing measurements down to .
III Results and Analysis
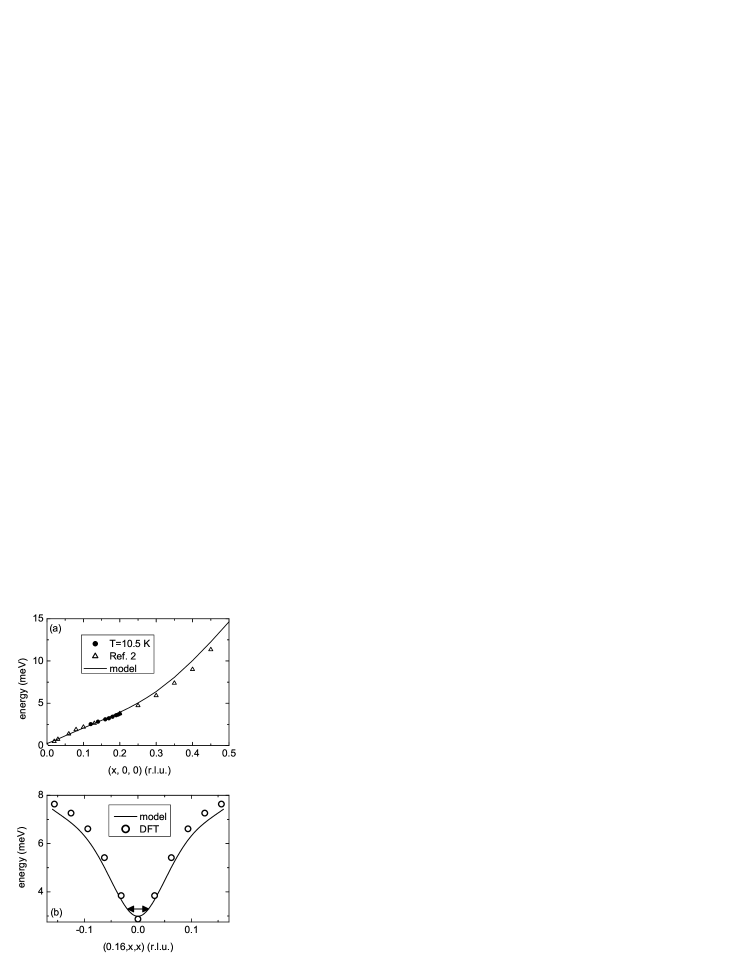
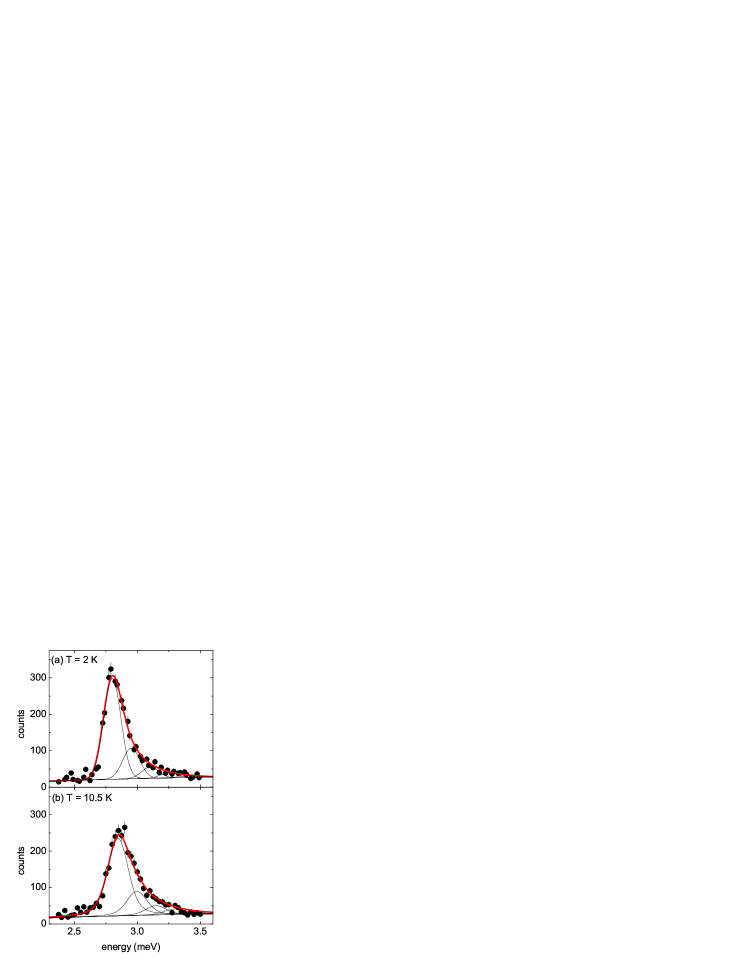
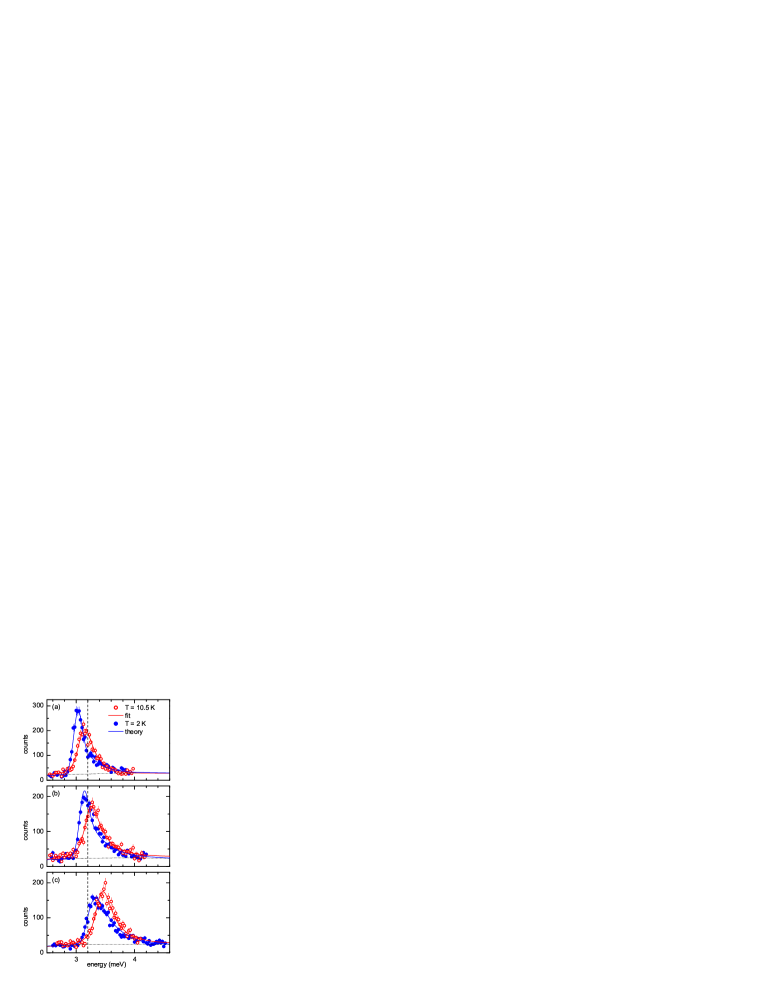
Our measurements were restricted to transverse acoustic phonons propagating along for wave vectors between and (in units with Å). From the results published in Ref. Shapiro75, we knew that these phonons have a relatively large ratio of linewidth over frequency and that the energies of these phonons would be comparable to the superconducting energy gap. Hence these phonons would be most favorable to search for superconductivity-induced changes of the phonon lineshape. The dispersion of these phonons is depicted in Fig. 1(a). These frequencies were extracted from energy scans like that depicted in Fig. 2. The asymmetry of the phonon line in Fig. 2(a) is due to the finite momentum resolution in conjunction with a steep increase of phonon frequencies when going away from the high symmetry line (Fig. 1(b)). The force constant model developed by Reichardt and PintschoviusReichardt01 by fitting the parameters to data published in the literaturePowell68 predicts a substantial frequency increase within the region in momentum space sampled in our experiment (Fig. 1(b)). This prediction is supported by ab-initio calculations using density functional theoryPena-Seaman07 . We used the phenomological model to simulate our energy scans based on the formalism of Cooper and NathansCooper67 for describing the four-dimensional resolution function in q and energy and found quantitative agreement with experiment (Fig. 2(a)). We note that the asymmetries related to resolution effects decrease with increasing but are non-negligible up to the highest values studied here, i.e. up to .
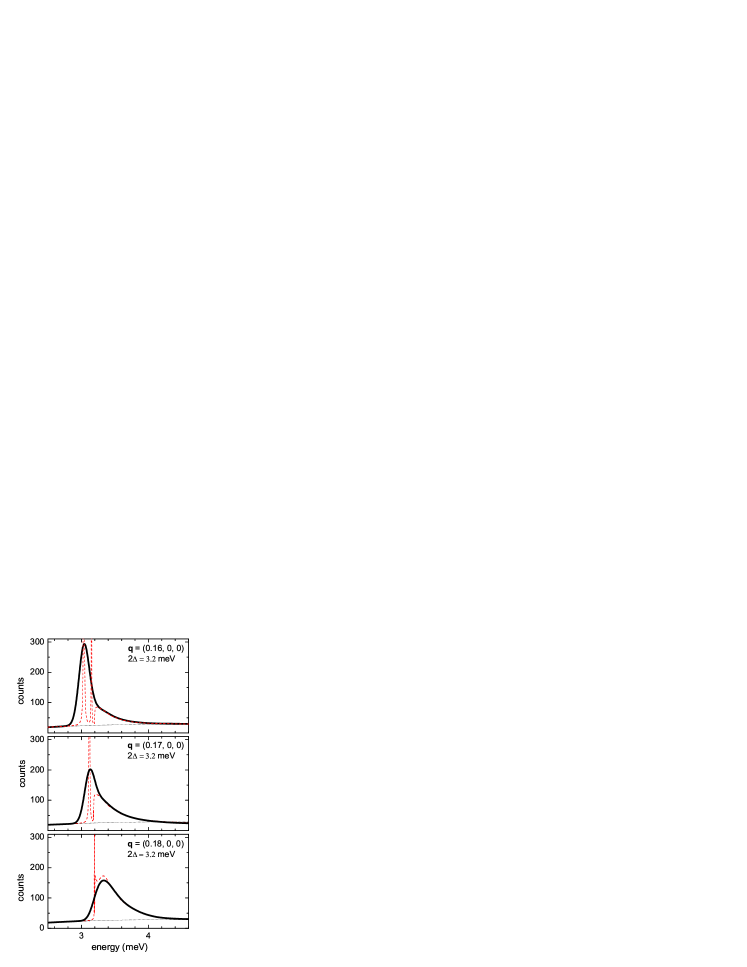
In order to discriminate between asymmetries related to the finite momentum resolution and those related to superconductivity-induced distortions of the phonon lineshape, we adopted the following type of analysis: the phonon line predicted by the model was decomposed into five individual, equally spaced components having the linewidth expected for tight vertical resolution as illustrated in Fig. 2. Subsequently, each component was convoluted with the same Lorentzian to reproduce the lineshape in the normal state data. The Lorentzian linewidth obtained in this way (fig. 3(b)) was used as input for calculating the lineshape in the superconducting state within the framework of a theory published by Allen et al.Allen97 . The lineshape in the superconducting state predicted by this theory was calculated for each component separately and the sum was used for comparison with experiment. For the phonon depicted in Fig. 2, theory predicts resolution-limited components somewhat down-shifted in energy. As will be discussed later, theory predicts complex lineshapes for other phonons, i.e. those with energies very close the superconducting energy gap.
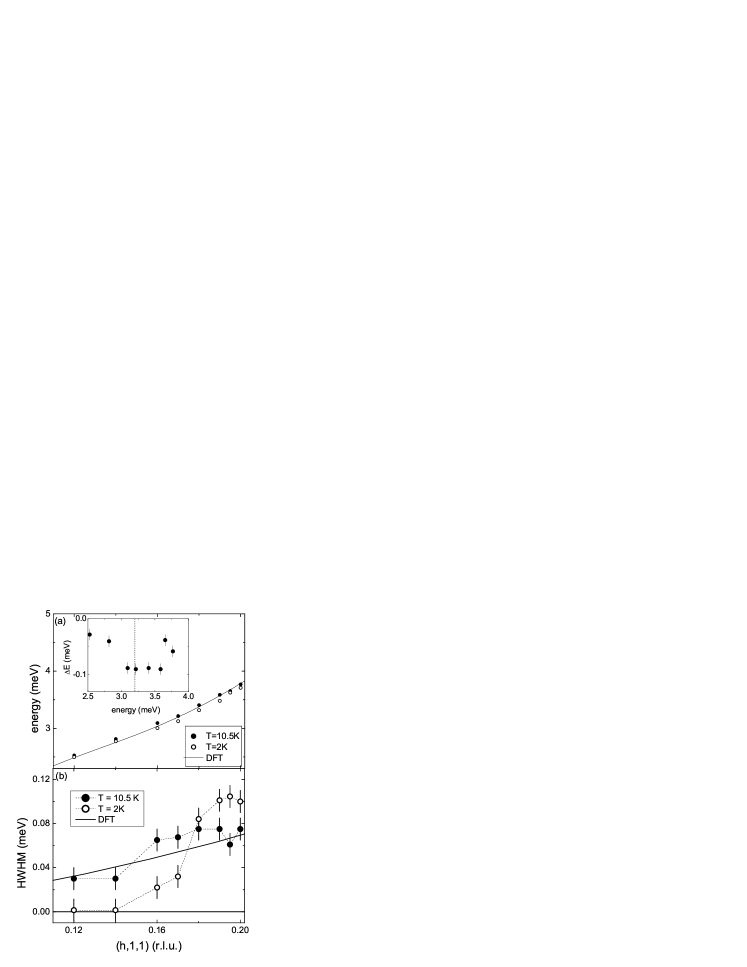
For our analysis, we used the theory proposed by Allen et al.Allen97 , because we had found that it works quite well for the effects seen in borocarbide superconductorsWeber08 . It is based on the full quantum mechanical treatment of electron-phonon coupling where vibrational and electronic excitations mix into hybrid modes. The theory contains three parameters, with two of them being entirely fixed by the phonon frequency and linewidth observed in the normal state. The third parameter is the superconducting energy gap . The value of was obtained by a comparison of the predicted to the observed phonon lineshape in the superconducting state. We note that the superconductivity-induced changes of the phonon spectra depend so sensitively on the gap value that the latter could be determined with a precision of about .
In addition, we performed a simpler type of analysis to make contact with results of previous studiesShapiro75 ; Aynajian08 : in this case, the phonon spectra were fit with a single Lorentzian convoluted with the resolution function. From these fits, we obtained the superconductivity-induced changes of phonon frequencies and phonon linewidths depicted in Fig. 3.
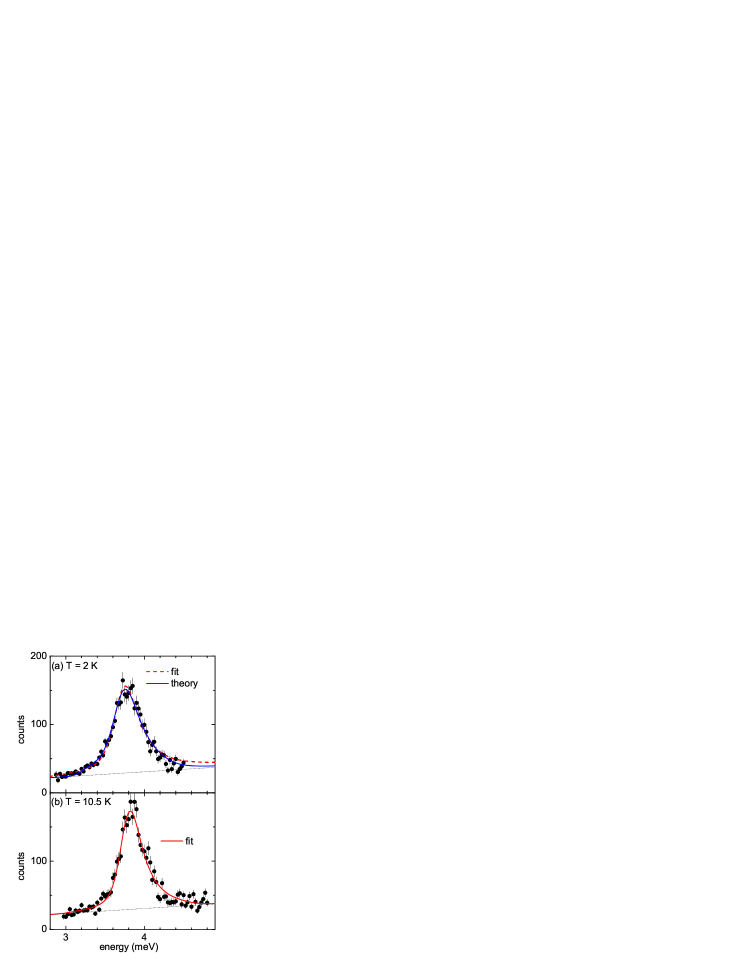
The simple type of analysis just mentioned is fully adequate for phonons with energies well below or well above : for phonons with energies well below , the phonon lineshape becomes resolution limited below (Fig. 2(a)), whereas for phonons with energies well above the intrinsic lineshape remains essentially Lorentzian (Fig. 4). A close look at the shape of the phonon line depicted in Fig. 4(a) reveals that there are indeed some discrepancies between the fit curve and the data, but they are small. Therefore, it would be hard to argue on the basis of such data that the lineshape in the superconducting state deviates from a Lorentzian. Nevertheless, the curve calculated from the theory of Allen et al.Allen97 describes the data definitely better.
We now turn to phonons with wavevectors where the lineshape in the superconducting state deviates very clearly from a Lorentzian. The energies of these phonons are quite close to the value of the superconducting energy gap . We note that we tried larger and smaller values of as well but found the best agreement between calculation and experiment for , in agreement with the value reported in Ref. Shapiro75, . The lineshapes of these phonons are depicted in Fig. 5. It is evident that the lineshape becomes markedly more asymmetric in the superconducting state, with a very steep intensity increase on the low energy side of the peak. Theory accounts both for the peculiar lineshape and the pronounced shift of the leading edge in a very satisfactory way. For a better understanding of the lineshapes predicted by theory, we show the theoretical curves before and after convolution with the experimental energy resolution in Fig. 6. Although the fine structure of the theoretical curves is washed out by the finite resolution, our data lend strong support to the basic features predicted by the theory of Allen et al.Allen97 .
IV Discussion
It is obvious from Fig. 1 that the phonon frequencies obtained in our experiment match those reported in Ref. Shapiro75, extremely well. Further, we note that the phonon linewidths evaluated in a conventional way (Fig. 3) agree with those reported in the two previous studiesShapiro75 ; Aynajian08 very well. A close look reveals that there is some discrepany between our values and those reported by Aynajian et al.Aynajian08 for the linewidths in the superconducting state around . Very probably, this discrepancy has a simple reason: that is to say, the measurements of Aynajian et al.Aynajian08 were done at a somewhat higher temperature than ours, i.e. instead of leading to somewhat larger linewidths.
The aim of the present study was to show that the conventional analysis of the phonon lineshapes by fitting the data with a Lorentzian is not fully adequate if the phonon energy is very close to the superconducting energy gap . Our data obtained for wavevectors clearly show that this is the case, although the effects are less eye-catching than those previously observed in borocarbide superconductorsKawano96 ; Stassis97 ; Weber08 . It is not that theory predicts much smaller effects for niobium than for the borocarbides, but they occur on a much-reduced energy scale and are therefore more washed out by the finite resolution of available neutron spectrometers. Nevertheless, the very good agreement between our observations and the curves calculated from the theory of Allen et al.Allen97 confirm the predictions of this theory: if the phonon energy in the normal state is slightly above , but its low energy tail extends below , the low energy tail will condense into a very sharp peak right at on entering the superconducting state. According to Allen et al.Allen97 , this sharp peak can be regarded as a mixed vibrational/superelectronic excitation. If the phonon energy in the normal state is right at or even somewhat lower, the sharp peak is located somewhat below and the high energy tail above has less weight. If the phonon frequency in the normal state is considerably smaller than , the high energy tail becomes vanishingly small, and the sharp peak corresponds to a normal phonon with infinite lifetime. If the phonon energy in the normal state is considerably larger than , there is still an intensity jump and a sharp peak right at but the jump height is so small that it is very difficult if not impossible to see it in experiment. Our data for shown in Fig. 4 do support the presence of such an intensity jump at but only marginally so, the jump height being simply too small.
We emphasize that the theory of Allen et al.Allen97 does not only explain the peculiar lineshapes observed for phonons with energies very close to but also describes the superconductivity-induced frequency shifts and linewidth changes for phonons with smaller and larger frequencies in a quantitative way. We note that the agreement between theory and experiment in Niobium is better than previously found in YNi2B2C (Ref. Weber08, ). Possibly, the theory is better suited for Nb because it was based on a weak-coupling BCS approach and the electron-phonon coupling strength is indeed weaker in Nb than in YNi2B2C. Another reason might be the fact that the superconducting energy gap shows a marked anisotropy in YNi2B2C (Ref. Weber08, ) but not in Nb, and that the theory of Allen et al.Allen97 was developed for the case of an isotropic gap.
V Conclusions
We re-investigated the superconductivity-induced changes of the phonon lineshape in elemental Niobium using high-resolution inelastic neutron scattering. Our data confirm the results of previous studies but also show unambiguously that for phonons with energies very close to the superconducting energy gap, the effects of superconductivity go beyond a simple change in lifetime. Our results strongly support the view of Allen et al.Allen97 that, in contrast to a competing theoryKee97 , the peculiar phonon lineshapes observed in borocarbide superconductors are a general phenomenon and are not restricted to the case of a strong nesting effect. The effects found in Niobium are indeed quantitatively described by the theory published by P. B. Allen et al.Allen97 . The agreement between theory and experiment for Nb is better than for the borocarbides. The theory does not only give a very good account of the peculiar lineshapes of phonons with energies close to the superconducting gap, but also of the changes in frequency and linewidth for phonons with significantly smaller or larger frequencies. The solid theoretical basis of the superconductivity-induced changes of phonon lineshapes allows for a precise determination of the superconducting energy gap in a single phonon scan if the phonon energy is close to the gap energy.
Work at Argonne National Laboratory was supported by the U.S. Department of Energy, Basic Energy Sciences-Materials Sciences, under Contract No. DE-AC02-06CH11357.
References
- (1)
- (2) J. D. Axe and G. Shirane, Phys. Rev. Lett. 30, 214 (1973)
- (3) S. M. Shapiro, G. Shirane and J. D. Axe, Phys. Rev. B 12, 4899 (1975)
- (4) M. Krantz, H. J. Rosen, R. M. Macfarlane and V. Y. Lee, Phys. Rev. B 38, 4992 (1988)
- (5) B. Friedl, C. Thomsen and M. Cardona, Phys. Rev. Lett. 65, 915 (1990)
- (6) N. Pyka, W. Reichardt, L. Pintschovius, G. Engel, J. Rossat-Mignod and J. Y. Henry, Phys. Rev. Lett. 70, 1457 (1993)
- (7) H. Kawano, H. Yoshizawa, H. Takeya and K. Kadowaki, Phys. Rev. Lett. 77, 4628 (1996)
- (8) C. Stassis, M. Bullock, J. Zarestky, P. Canfield, A. I. Goldman, G. Shirane and S. M. Shapiro, Phys. Rev. B 55, R8678 (1997)
- (9) H.-Y. Kee and C. M. Varma, Phys. Rev. Lett. 79, 4250 (1997)
- (10) P. B. Allen, V. N. Kostur, N. Takesue and G. Shirane, Phys. Rev. B 56, 5552 (1997)
- (11) F. Weber, A. Kreyssig, L. Pintschovius,R. Heid, W. Reichardt, D. Reznik, O. Stockert and K. Hradil, Phys. Rev. Lett. 101, 237002 (2008)
- (12) P. Aynajian, T. Keller, L. Boeri, S. Shapiro, K. Habicht and B. Keimer, Science 319, 1509 (2008)
- (13) W. Reichardt and L. Pintschovius , Phys. Rev. B 63, 174302 (2001)
- (14) B. Powell, P. Martel and A. Woods, Phys. Rev. 171, 727 (1968)
- (15) O. de la Peña-Seaman, R. De Coss, R. Heid and K.-P. Bohnen, Phys. Rev. B 76, 174205 (2007)
- (16) M. J. Cooper and R. Nathans, Acta Crystall. 23, 357 (1967)