The structure of gravitationally unstable gas-rich disk galaxies
Abstract
We use a series of idealized, numerical SPH simulations to study the formation and evolution of galactic, gas-rich disks forming from gas infall within dark matter halos. The temperature and density structure of the gas is varied in order to differentiate between (i) simultaneous gas infall at a large range of radii and (ii) the inside-out build-up of a disk. In all cases, the disks go through phases of ring formation, gravitational instability and break-up into massive clumps. Ring formation can be enhanced by a focal point effect. The position of the ring is determined by the angular momentum distribution of the material it forms from. We study the ring and clump morphologies, the characteristic properties of the resulting velocity dispersion field and the effect of star formation. In the early phases, gas accretion leads to a high vertical velocity dispersion. We find that the disk fragmentation by gravitational instability and the subsequent clump-clump interactions drive high velocity dispersions mainly in the plane of the disk while at the same time the vertical velocity dispersion dissipates. The result is a strong variation of the line-of-sight velocity dispersion with inclination angle. For a face-on view, clumps appear as minima in the (vertical) dispersion, whereas for a more edge-on view, they tend to correspond to maxima. There exists observational evidence of a systematic variation of the velocity dispersion with inclination angle in high-redshift disks, which could be partly explained by our simulation results. Additional energetic sources to drive velocity dispersion that are not included in our models are also expected to contribute to the observational results.
Subject headings:
galaxies: high-redshift — galaxies: evolution — galaxies: irregular — galaxies: formation — galaxies: starburst1. Introduction
Recent observations at redshift , close to the peak of the cosmic star formation history, have revealed a significant population of massive (baryonic mass ), extended () disk galaxies with star formation rates of the order of (e.g. Förster Schreiber et al., 2006, 2009). The corresponding observed gas velocity dispersions are very high, and the rotation-to-dispersion ratios thus relatively low (e.g. Cresci et al., 2009; Genzel et al., 2006, 2008). In addition, the galaxies are gas-rich with typical gas fractions of (Daddi et al., 2010; Tacconi et al., 2010). Star formation within them takes place in a few giant clumps with typical masses of and radii of (Elmegreen et al., 2009). In some of the sources rings have been detected, suggesting an evolutionary sequence from rings to clumps to bulges on a timescale of (Genzel et al., 2008).
The properties of this observed galaxy population are very different from present-day disk galaxies. Typical disk galaxies, such as the Milky Way, display smooth surface density profiles with no evidence for supermassive clumps. The difference to the population can be illustrated by the typical parameters for the local disk population of (Robitaille & Whitney, 2010 and references therein) and (Dib et al., 2006). Star formation takes place in giant molecular clouds with typical masses of and has been constant within a factor of a few for the last (Aumer & Binney, 2009). Associations of molecular clouds can have masses as high as a few (e.g. Rand & Kulkarni, 1990), which is the largest scale of fragmentation in galaxies. However, the thick disk components of low-redshift disks exhibit stellar ages consistent with a formation at and high velocity dispersions (e.g. Schönrich & Binney, 2009). It has been proposed that the thick disks have formed in massive, clumpy high-redshift disks with high SFRs (Förster Schreiber et al., 2006; Genzel et al., 2006; Bournaud et al., 2007, 2009) .
Observations indicate that only a smaller fraction of the galaxies are obvious major mergers (Förster Schreiber et al., 2006, 2009; Shapiro et al., 2008). Thus, the high star formation rates and high velocity dispersions seem not to be merger-induced in the majority of the sources. Instead, gravitational instability of differentially rotating disks with high surface densities (Toomre, 1964) has been identified as a key process for the fragmentation of disk galaxies, which are then likely to evolve into bulge-dominated systems (Noguchi, 1999; Immeli et al., 2004a). Lately, Romeo et al. (2010) extended the classical Toomre instability criterion to turbulent disks which show a rich variety of global instabilities, providing a theoretical framework for gas-rich high-z disk evolution.
Clumpy and turbulent disks resembling the galaxies have recently also been produced in cosmological simulations of galaxy formation (Agertz et al., 2009b; Ceverino et al., 2010). As argued by the authors, key aspects in the success of these simulations are a high spatial resolution and a cooling description that follows the thermal evolution of the gas below allowing a multi-phase ISM to develop. In these simulations, the high gas fractions and star-formation rates are powered by cold streams of gas moving along the cosmic web (Kereš et al., 2005; Dekel et al., 2009b; Johansson et al., 2009b). However, the physical source of the large observed irregular motions is still unclear. Several scenarios have been proposed in the literature including accretion (e.g. Förster Schreiber et al., 2006; Genzel et al., 2006; Elmegreen & Burkert, 2010; Klessen & Hennebelle, 2010), stellar radiative feedback (Murray et al., 2010; Krumholz & Dekel, 2010) and disk self-gravity (e.g. Immeli et al., 2004a; Bournaud et al., 2007; Burkert et al., 2010).
In this paper we present SPH simulations of idealized disk formation by gas infall via a cooling flow within a galactic halo. We analyze the evolution of the morphology and the turbulent structures in the forming disks. Both models with and without star formation and SN feedback and with different initial temperature and density profiles are presented. We demonstrate that ring formation and subsequent gravitational fragmentation occurs in all of the scenarios. In addition, we analyze the structure of velocity dispersion created by accretion and disk self-gravity and finally discuss the efficiency of stellar disk heating in our simulations.
We describe the setup of our simulations in Section 2, present our results in Section 3 and discuss them in Section 4.
2. Simulations
The simulations were performed using the TreeSPH-code GADGET-2 (Springel, 2005) on the local Altix 3700 Bx2 machine. The code includes the standard radiative cooling rates for an optically thin, primordial composition of hydrogen and helium in ionization equilibrium following Katz et al. (1996). Their figure 1 displays the cooling rate as a function of temperature. The cooling curve features a cutoff below and two peaks at and resulting from collisional excitation of H and He, respectively. We included a spatially uniform time-independent UV background, appropriate for (Haardt & Madau, 1996). The abundances of the different ionic H and He species were computed by solving the network of equilibrium equations self-consistently for a specified value of the UV background radiation field.
The chemical composition of the infalling gas could possibly be pre-enriched. However, the actual metal content is difficult to estimate, as there are no direct observations of infalling gas at (e.g. Steidel et al., 2010) and observed galaxies and outflows are likely to be significantly more metal-rich than the infalling gas. Considering the metallicity of tyoical damped Lyman systems at , (Pettini et al., 1994), the cooling rates would be enhanced for temperatures by a factor of a few (Sutherland & Dopita, 1993). In our simulations, this would lead to an increase in gas mass flow to the center of the halo. However, due to the large uncertainties in the actual gas metallicity at , we rely on the assumption of a primordial chemical composition in the present study.
Star formation and the associated supernova feedback, when included, are modeled using the prescriptions of Springel & Hernquist (2003). This sub-resolution model uses a statistical formulation to deal with physics acting on scales, which are not resolved by simulations of galaxy formation. Above a threshold density , each SPH particle is assumed to represent a fluid comprised of cold, condensed clouds in pressure equilibrium with an ambient hot gas. Such a multiphase treatment of the interstellar medium is motivated by McKee & Ostriker (1977) (see also Johansson & Efstathiou, 2006). A stellar population is modeled to form from the cold medium on a timescale , which is proportional to the dynamical timescale of the gas, so that . The energy released by one SNII is typically ergs per supernova, which may be expressed as a supernova temperature . The hot phase is required to have a temperature in excess of , whereas the cold phase is assumed to be at . The threshold density, , is determined self-consistently in the model by requiring that the equation-of-state (EOS) is continuous at the onset of star formation. Stars form from the cold clouds in regions were the number density . The parameters governing the model are set to reproduce the observed Kennicutt relation (Kennicutt, 1998), yielding a star formation timescale . The unphysically low star formation density threshold density is a consequence of the relatively low resolution of typical galaxy formation simulations, such as ours ( per particle). As has recently been shown (Governato et al., 2010), higher density thresholds are appropriate for higher-resolution simulations of dwarf galaxies ( per particle).
Radiation pressure, which might play an important role in high- star forming galaxies (see Murray et al., 2010), is not included in our simulations.
The setup for our simulations was motivated by Kaufmann et al. (2006, 2007). We study the evolution of an initially hot baryonic component within a dark matter halo with an NFW density profile
| (1) |
(Navarro et al., 1996). The structural parameters of the halo were chosen according to Zhao et al. (2009). The virial radius and virial mass are defined according to the spherical virialization criterion. The corresponding virial over-density depends on redshift and on the assumed cosmology. We adopt as expected for star-forming galaxies (Dekel et al., 2009b). For this halo mass, and a CDM cosmology with parameters according to Hinshaw et al. (2009), Zhao et al. (2009) find a concentration parameter of and a virial radius of , which we adopt. We apply a fiducial virial spin parameter of (Bullock et al., 2001), where is the average specific angular momentum of the dark matter within and is the halo circular velocity at . This value for is on the high end of the distribution of spin parameters of CDM halos found by Bullock et al. (2001). However, similarly high spin parameters have been inferred for extended disk galaxies at (Burkert et al., 2010), thus motivating our choice.
The halo is set up using a population of collisionless particles following the description of Springel et al. (2005) (see also Johansson et al., 2009a). We truncate the halo at . The particle mass is and the gravitational softening length is set to .
A gas component was included with a baryonic-to-dark mass ratio of . The gas component is also truncated at . We use particles, a particle mass and a gravitational softening length of . The dominant mode of gas accretion onto forming galaxies is a topic still under debate (Dekel et al., 2009a). Smooth inflows of cooling gas, that has previously been shock-heated, cold streams and mergers are among the discussed modes and are all likely to play a role. We intend to keep our models simple in this context and therefore assume spherically symmetric profiles of density and temperature . The variation of these profiles allows us to study different scenarios of infall. In our models, the gas component is initially hot (), with an internal energy structure determined by the assumption of hydrostatic equilibrium (cf. Kaufmann et al., 2006). The pressure profile is thus
| (2) |
Unlike Kaufmann et al., we do not impose a lower temperature floor, as we do not want to prevent the forming disk from fragmenting. The build-up of the disk is determined by the initial profiles of gas density, internal energy and angular momentum. We vary the initial conditions as follows:
-
•
Model A assumes that the gas component is initially well mixed with the dark matter component. Thus, the gas density also follows an NFW density profile similarly to the DM component, but with a correspondingly lower density normalization (cf. Kaufmann et al., 2006). The gas is in hydrostatic equilibrium with an initial temperature of the order of within . The initial specific angular momentum profile is a power law with (cf. Kaufmann et al., 2006; Bullock et al., 2001) , i.e. the rotational velocity is independent of the radius.
-
•
With Model B we intend to explore significantly different central initial conditions and to consequently alter the initial formation stages. We assume a constant gas density within , adjusted so that the total mass within this radius is equal to that of Model A, . The temperature in this model at is also of the order of . However, due to the assumption of hydrostatic equilibrium the temperature increases with decreasing radius resulting in a factor of higher temperature in the center, thus creating a ’hot bubble’. In the constant density region the angular velocity of the gas is set to a constant value. Outside the density and angular momentum profiles are as in Model A with a smooth transition region between 20 and 30 kpc.
-
•
Model C has identical gas density and angular momentum profiles to Model B, but the condition of hydrostatic equilibrium is removed in order to model an accretion history that is intermediate to Models A and B. Within the temperature is set to a constant value of , being lower than the central temperature of Model B, but higher than the central temperature of Model A. Between 15 and 30 kpc the temperature decreases linearly with radius and outside the temperature profile is identical to Model B.
-
•
With Model SF we intend to study the effects of star formation and supernova feedback on the evolution of our systems. As has been shown by Immeli et al. (2004a), the specific implementation of these processes has a large influence on the formation and evolution of unstable disks. We therefore rely on the generic model of Springel & Hernquist (2003) to be able to draw general conclusions. We choose identical initial conditions to Model B in order to make a direct comparison possible.
The spin parameter , where is the average specific angular momentum of the gas within is for all models set to a fiducial value of 0.08, so that .
3. Results
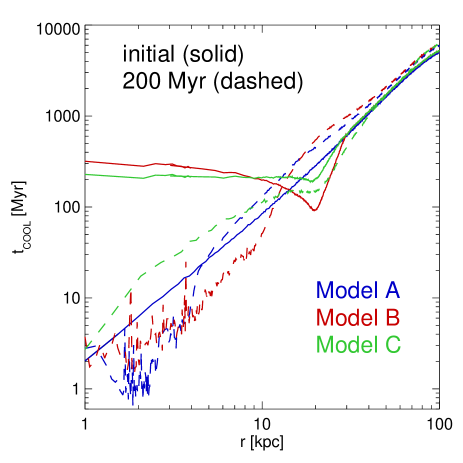
Due to cooling the baryonic component evolves out of hydrostatic equilibrium rapidly and begins to form a disk in the center of the halo. The cooling timescale, and the temperature, density and angular momentum profiles determine the evolution and structure of the forming baryonic component. In Fig. 1 we plot the cooling timescale as a function of radius for the three different initial conditions of Models A/B/C and for the evolved systems at simulation time in order to illustrate the significant differences between the three models.
As already noted in Kaufmann et al. (2006) thermal instabilities (Burkert & Lin, 2000) caused by numerical noise in the initial conditions lead to the formation of cold, dense clouds in the halo which fall onto the disk through a hotter medium. This however does not affect the fragmentation of our disks into clumps. The clouds typically consist of a number of SPH particles , which is smaller than the number of particles in the smoothing kernel and are thus not resolved.
3.1. How the Models differ
Our different initial conditions have been constructed in order to study different early phases of disk growth.

-
•
In Model A the cooling time increases monotonically as a function of increasing radius. The already relatively dense central gas () cools very rapidly on a timescale of (cf. Fig. 1) and forms a rotationally stabilized inner disk. Material within of the rotation axis is in centrifugal equilibrium and falls vertically onto the disk, whereas the remaining gas falls in radially (cf Fig. 2). Because of the peaked density profile and correspondingly short collapse timescales, the accretion of material that was originally close to the rotation axis and therefore in centrifugal equilibrium soon becomes unimportant. Now gas with higher angular momentum from the outer regions begins to settle into the outer regions of the disk, leading to an inside-out growth of the disk. In general, in this model, accretion predominantly takes place in the outer disk region.
-
•
According to equation 2 the temperature decreases with increasing radius in the constant density region of Model B, thus the outer regions of the constant density sphere have the shortest cooling times (cf. Fig. 1) and the first dense and cold structures are formed here. These clouds are gravitationally accelerated inwards, moving towards the center through the hotter inner gas layers, which subsequently also cool and undergo the same process. The result is that almost all of the material from the initial constant density region settles in a disk at a relatively large range of radii () within a relatively small time interval (). The formation phase of the central disk is thus distinctly different from Model A.
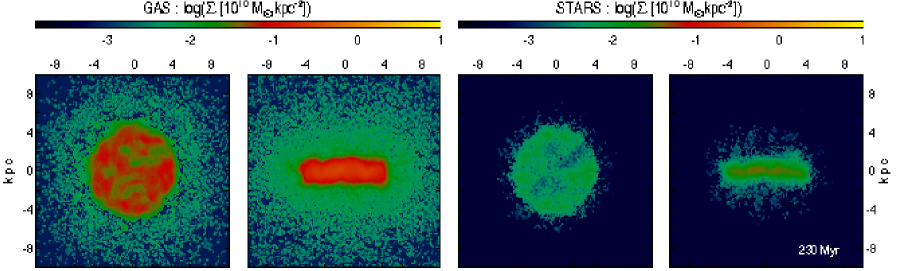
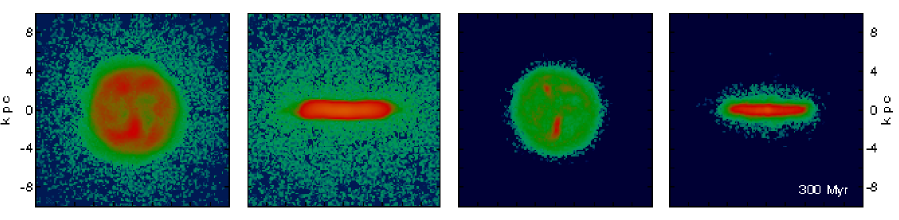
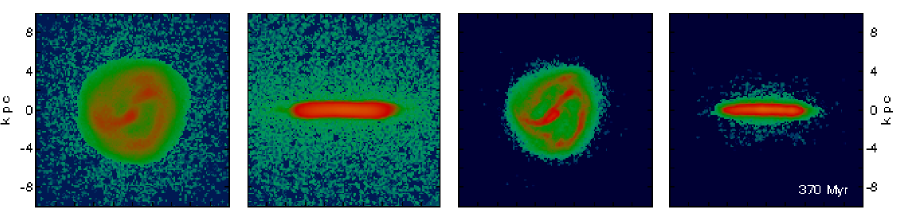
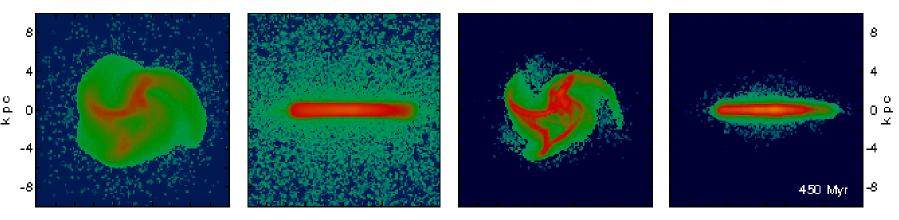
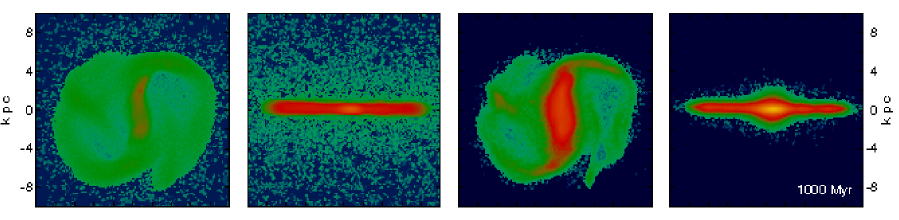
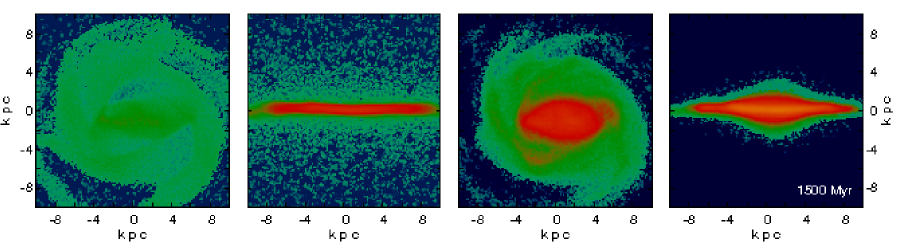
Figure 3.— The variety of morphologies displayed by Model SF. From left to right: Surface density maps of: gas face-on, gas edge-on, stars face-on and stars edge-on. From top to bottom: Model SF at 230, 300, 370, 450, 1000, 1500 Myr. -
•
In Model SF star formation sets in after the first denser structures have formed due to cooling and before they enter the disk region. However star formation rates in this phase are low compared to the gas accretion, leading to an increase in the disk’s gas mass. The inclusion of feedback increases the effective cooling timescales as the type II supernovae add energy to the star-forming gas. The central build-up of the disk is thus slightly delayed () but otherwise similar to Model B. The first row of Fig. 3 displays the face- and edge-on surface density maps of Model SF at .
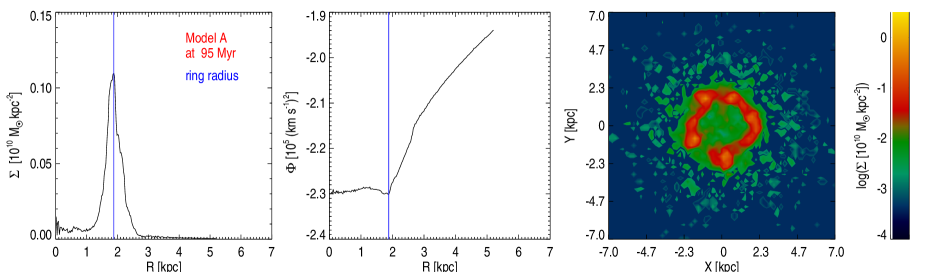
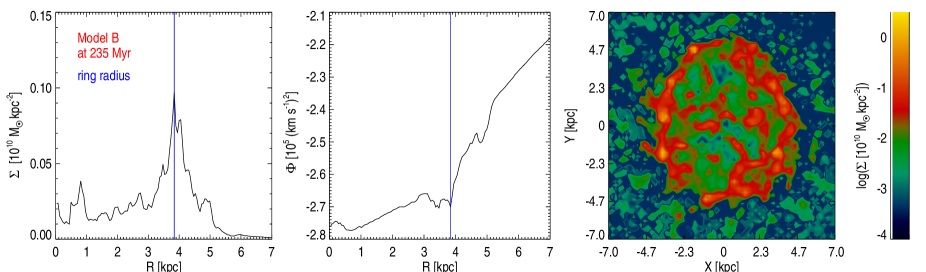
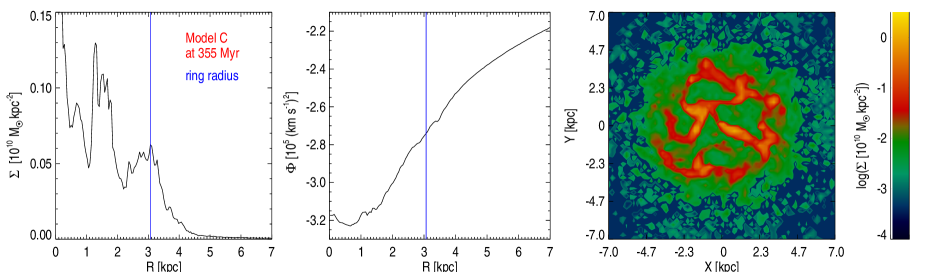
Figure 4.— From left to right: surface density vs disk radius , the azimuthally averaged gravitational potential vs disk radius and a surface density map of the disk regions. The vertical blue lines in the left and central panels mark the position of the ring. From top to bottom: Model A at 95 Myr, Model B at 235 Myr and Model C at 355 Myr. -
•
Because of the constant density and temperature of the gas within the central in Model C the cooling time is constant everywhere, (cf. Fig. 1). After a first quasi-static cooling phase, infall starts basically everywhere at the same time. The free-fall timescale increases with radius, resulting in an inside-out disk formation starting at . Compared to Model A the different density and angular momentum profiles result in the accretion into the central regions being significant over a much longer timescale (until ).
The dashed lines in Fig. 1 show the cooling time profiles for simulation time for the Models A/B/C. For Models A and B, extended central structures have formed, indicated by the short cooling times. The material is effectively at the lower limit of the cooling function at . Outside 10 kpc the cooling rates are now larger than initially, as the initial material at these positions has moved inwards and hotter material from the outskirts is falling in. For Model C, at 200 Myr, the central object is still relatively small, which is why its cooling time profile differs from those of Models A and B at this time.
3.2. Ring formation
All of our models exhibit ring structures and a phase dominated by massive clumps. The ring is very clearly seen in Models A and B, but is significantly less distinct and more obscure in Model C. The ring formation radius varies from model to model as displayed in the left panels of Fig. 4.
-
•
In Model A a shallow peak in the radial surface density distribution is produced soon after the start of the simulation at the equilibrium position between the halo gravity and the initial angular momentum of the gas contributing to the first stage of disk formation (t). New disk material during this phase preferentially settles at the outer region of the already existing disk. Thus, the edge of the disk is always relatively distinct, resulting in a steep rise of the gravitational potential in this region. This in turn focuses the accretion of material to this region (cf. Fig. 2) forming a peak in the surface density (i.e. a ring) in the outer disk, which further increases the gravitational attraction and results in a self-amplification of the ring formation process. Due to the growing angular momentum of the infalling gas, the radius of the ring wanders outwards from to at the time of fragmentation (). The top row of Fig. 4 displays the surface density and the gravitational potential as a function of radius at a time shortly before fragmentation. The dominant ring corresponds to a local minimum in the gas-dominated gravitational potential and therefore the ring is able to attract material from both the inner and outer regions.
-
•
In Model B a disk with a radius of forms by simultaneous accretion of material at all radii leading to an initially flat surface density distribution with an edge, with the disk being less distinct than in Model A. The edge acts again as a focal point and leads to large gravitational forces attracting material to this region and to a dip in the gravitational potential resulting in a ring at as depicted in the middle row of Fig. 4. The sizes of the initial disk and the ring are determined by the angular momentum profile of the initial constant density sphere and the corresponding radii of centrifugal equilibrium.
-
•
In Model C the disk forms inside-out with accretion during the first phase occurring at a growing range of radii. The gravitational potential of the gas component is monotonically increasing at all times all the way from the center to the outer regions. Infalling material is attracted to the central regions, which are growing from ongoing vertical accretion and gas migrating radially inward. The first phase of gravitational fragmentation occurs in the central region at , and unlike Models A and B not in a ring structure. In the next phase the influx of new material peaks at larger radii again. The recently accreted gas forms a ring-like structure around the already fragmented, irregular, massive gas clumps in the disk within the ring, which dominate the gravitational potential and thus influence the morphology of this less distinct structure (cf. bottom row of Fig. 4).
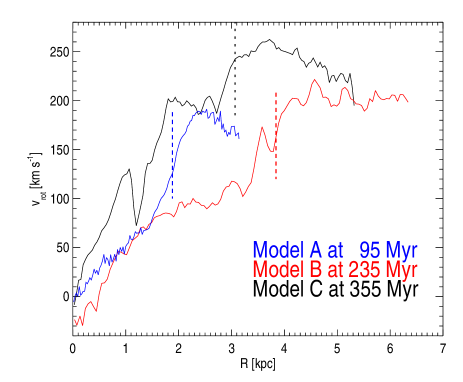
Fig. 5 shows the measured gas rotation curves for the three simulations at the corresponding time depicted in Fig. 4 with the vertical dashed lines indicating the radial positions of the rings. Model A shows a monotonically increasing rotation curve with a shallower increase in the low surface density inner region and a steeper part in the ring region, as one would predict from the corresponding mass profile. Outside the rotation curve drops indicating that no equilibrium disk has yet formed in this region. The rotation curve for Model B exhibits less monotonic behavior indicating a clumpier surface density structure. The curve is steeper in the center resulting from a small counter-rotating gas clump, which does not affect the dynamics of the rest of the disk. Moving outwards Model B shows similarly to Model A a transition from a flat inner region at to a steep ring-dominated region. At the time corresponding to Fig. 4 the disk in Model C has already fragmented. As a result we see strong local variations in the rotation velocities produced by massive clumps dominating the gravitational field in their surroundings (see also Immeli et al., 2004b). Because of the higher central surface densities model C displays the largest rotation velocities and the steepest increase in the rotation curve of all the three models.
The inclusion of star formation and supernova feedback in Model SF adds an additional source of pressure and a collisionless component to the simulation. The effects of feedback prevent the formation of an initial distinct ring as seen in Model B, which has identical initial conditions. However, as can be seen in Fig. 3 also Model SF develops ring structures, which are short-lived and less distinct than in Models A and B and more similar to the ring in Model C.
3.3. Clumps and bulges
Fragmentation due to gravitational instability leads to a clump-dominated evolution phase of our systems. The Toomre parameter
| (3) |
predicts instability for , where is the epicycle frequency, is the radial velocity dispersion and is the surface density, (Toomre, 1964, for a revised criterion for turbulent disks see Romeo et al., 2010 ).
As the temperature of the gas in the disk is typically , the corresponding sound speed is . As we show in section 3.4, the velocity dispersion of the gas is significantly higher than in the region undergoing fragmentation, which justifies the use of for the calculation of . The velocity dispersion at this phase is nearly constant with surface density (see section 3.4). Thus the surface density distribution , which evolves differently as a function of radius in the three models, determines the different fragmentation patterns. Consequently, fragmentation first occurs in the regions of highest surface density, which are the ring regions in Models A and B, and the center in Model C.
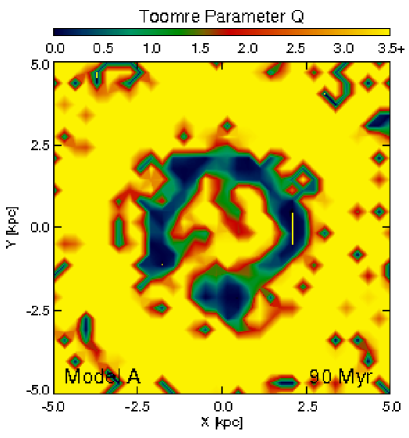
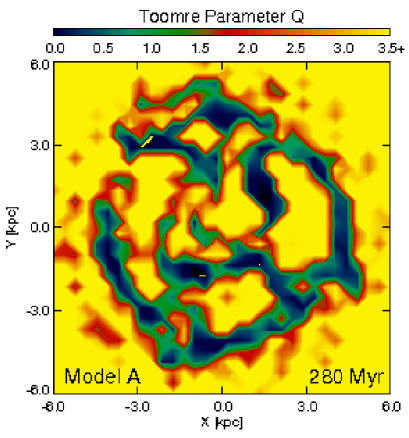
In the left panel of Fig. 6 we plot a map of the Toomre parameter in the disk of Model A in the ring phase at . The ring is beautifully visible as the region with the lowest values of , with indicating that it is unstable. The ring has already started to fragment, as the shape of the region is no longer circular. At larger radii some regions are also visible, however they are outside the equilibrium disk region and the determination of is thus not significant, as the criterion holds only for a thin, differentially rotating disk.
After the fragmentation phase the evolution of the system is dominated by clumps. We use a friends-of-friends algorithm to detect clumps, setting a lower mass limit of , which corresponds to SPH particles. The smoothing kernel is calculated using a number of particles and the clumps are thus well resolved. We also performed tests using the clump detection method described in Bournaud et al. (2007), which defines a clump as a region with a mass above the minimum mass and an over-density of , where is the average surface density at the disk radius and . Using this clump definition does not alter our conclusions.
The clumps forming in the fragmentation phase have typical initial masses of . The Jeans mass, (Binney & Tremaine, 1987), gives an upper mass limit of masses stabilized against gravitational collapse by pressure support. Using the relations and , where is the scale-height of the disk, we find
| (4) |
Fig. 4 shows that the typical surface density in rings is . In section 3.4, we show that the corresponding vertical velocity dispersion in the ring phase is 30-40 . Consequently, clumps with masses of are consistent with local Jeans theory. The clumps quickly grow in mass due to merging and accretion of diffuse material. The fraction of gas within the disk region, which is bound in clumps also increases with time reaching very high values of for the gas-only simulations.
The top left panel of Fig. 7 depicts the surface density map for Model A at , which shows four massive clumps () and several smaller clumps with masses of . Two of the massive clumps (in the lower half of the plot) are closely interacting. In the right panel of Fig. 6 we plot a map of the Toomre parameter at this time. The clumps are visible as regions of . The initially rather spherical clumps develop during the simulation into rotationally-flattened, centrifugally supported mini-disks that interact in the disk plane. The global Toomre parameter is thus no longer an appropriate measure for the stability of the clump regions. New clumps primarily form at the outer radii of the disk due to newly accreted material. These outer regions are also Toomre unstable with , as can be seen in the right panel of Fig. 6.
The mini-disks are typically aligned in the mid-plane with the exception of Model B, where the fragmentation occurs during a phase of ongoing strong accretion. The vertical center-of-mass velocity of these clumps is thus higher, which results in vertical offsets in the position of the clumps. However, also in Model B, the vertical velocity dispersion within the clumps and their vertical extent are as small as in Models A and C.
The gas-only models do not show a clear bulge formation process. This is partly caused by the fact that we did not run these simulations for longer than , when massive clumps have formed and we thus expect star formation to play a major role. In all these simulations however the most massive structure settles in the most central position and can thus be interpreted as a proto-bulge structure. In Models A and C the final stages show typically clumps with masses and smaller clumps. Model B shows a high clump-merger rate in the final resulting in only 3 massive and three smaller clumps. Our gas-only models are thus different from previous models of gravitationally unstable, clump-dominated disks, which included prescriptions for star formation (e.g. Immeli et al., 2004a; Bournaud et al., 2007). These models typically show that massive clumps migrate inwards and coalesce to form a bulge within a few 100 Myr. The main reason for the difference is that almost all of the gas is bound in massive clumps and the transfer of angular momentum can only occur between these clumps or between a clump and the dark matter component. The dynamical friction timescale is shorter for more massive clumps and thus they migrate to central positions more quickly. However, our simulations distinctly lack a diffuse gas component which could absorb angular momentum. We have run isolated unstable disk galaxies similar to those of Bournaud et al. (2007) and were able to reproduce the bulge formation process by including star formation.
As discussed in section 3.2, the effects of feedback significantly alter the formation of over-dense structures within the disk region of Model SF. The clumps in this model are consequently less dense, less distinct and less flattened than in Models A,B,C. However, as can be seen in Fig. 3 also Model SF develops irregular, clumpy morphology and ring structures. The density contrast , where of these structures is significantly lower than in the gas-only simulations. However, if we lower the clump criterion of Bournaud et al. (2007) to we still detect clumps of masses . The second row in Fig. 3 clearly depicts two of these structures in the face-on stellar surface density maps.
The morphology of the developing disk changes rapidly on timescales of a few . The displayed morphologies show similarities to the models of Immeli et al. (2004a). The stellar component and the larger amount of diffuse gas in this model, allow a more efficient outward transport of angular momentum and lead to a more efficient inward migration of clumpy material than in the gas-only simulations, in broad agreement with previous work (e.g. Immeli et al., 2004a; Bournaud et al., 2007). The system of clumps initially displays various irregular morphologies before forming a bar-like structure (). The morphology of the bar varies, but it persists until the end of the simulation at as is depicted in the lower rows of Fig. 3. At the final stage the model does however not depict a central excess of surface density , as had been found in simulations of isolated, unstable disks by Bournaud et al. (2007). The radial surface density profile is well-fit by an exponential with a scale-length out to . The final stellar mass of this disk is with a gas fraction of per cent. Initial test runs with static dark potentials and of isolated disks produced stronger central components (bulges). This indicates that the interaction of the baryonic component with the dark halo plays a strong role in reducing the central dark matter density (see also Johansson et al., 2009b). Ongoing accretion of material with increasing angular momentum onto the disk can also prevent a central surface density excess.
Star formation occurs mainly in the over-dense structures. The morphologies are very similar for both the gas and stellar components. The SFR averaged over 25 Myr periods, increases initially from when the disk starts forming at to a nearly constant value of between and , which is the phase dominated by the irregular disk structures. These SFRs are thus similar to observations of high- disks. The SFR then steadily decreases due to gas consumption, being at , at and at .
3.4. Velocity dispersion
We define a disk region by determining a disk radius and a vertical extent selecting the rotationally supported part of the centrally forming baryonic object. We then calculate the vertical and radial velocity dispersions and as 111We use a subscript glob to indicate that the dispersion is global, i.e. calculated for the whole disk region.
| (5) |
taking into account all gas particles in this region. These quantities are thus measures for the global non-circular velocities and disk thickness. Radial inflow velocities, which vary with position could contribute to . However, we do not observe regular inflows in our gas-only Models, which are dominated by clump-clump interactions after fragmentation. We plot the dispersions as a function of time in Fig. 8 for the Models A,B and C. As the temperature of the gas in the disk is typically , the sound speed is . As is valid in the disk regions, we focus on the discussion of velocity dispersions.
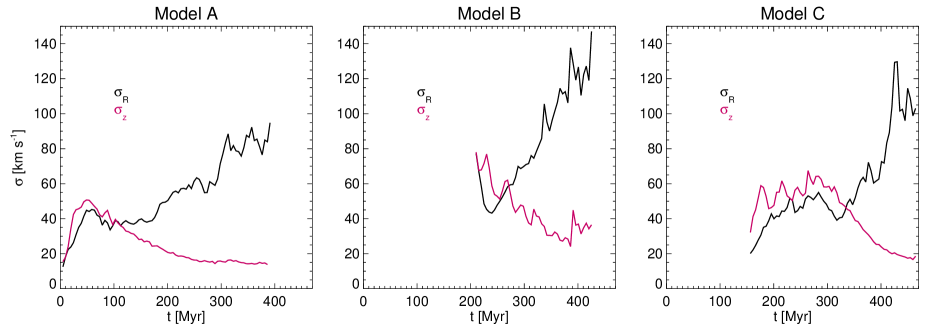
For Model A (left panel) we find that during the early formation phase the vertical dispersion is high () and the radial dispersion stays constant () until the fragmentation of the ring. The vertical dispersion, starts to decline after to a nearly constant level of after . The radial dispersion, , on the other hand starts to increase with the onset of gravitational instability reaching values of with strong fluctuations caused by major clump-clump interactions, which hardly effect . We ran a test-simulation of Model A without gas self-gravity and found that for this run the z and R dispersions show similar declining behavior, thus confirming that disk self-gravity is driving the high radial dispersions.
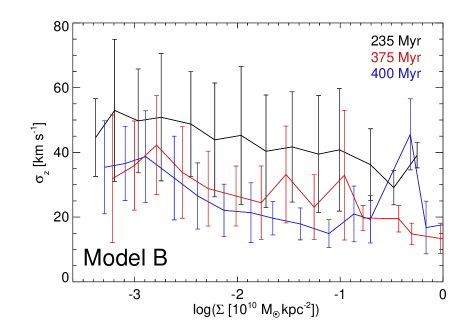
For Model B (middle panel of Fig. 8) the initial amplitude of the velocity dispersion is larger (), which is a result of the almost simultaneous infall of disk material at a large range or radii. After this first formation phase, decreases steeply to reach typical values of at , whereas increases to values of , thus resembling the evolution in Model A. After showing a clear decreasing tendency, the evolution of is affected by a temporary increase at . This increase coincides with two close interactions of two clumps each, which have an offset in vertical position. This in turn results in vertical gravitational forces increasing the velocity dispersion temporarily. The merger activity remains high at the end of this simulation preventing a further decline in .
Model C features a longer phase of significant (vertical) accretion onto the inner disk regions and an inside-out growth of the disk resulting in a delay of the fragmentation phase compared to Model B. The right panel of Fig. 8 depicting model C thus shows a combination of the features of the other two Models: exhibits first a relatively constant phase with , followed by a steep increase after the gravitational instability sets in. The vertical dispersion is initially at a high constant level () before declining steeply to reach a typical value of in a similar way as in Model A.
For the corresponding rotation-to dispersion ratios , we find for radial velocity dispersion that holds at all times in Models A, B and C, which is in agreement with observations (Cresci et al., 2009). For the vertical velocity dispersion, is only within this interval during the accretion dominated phase. After that, increases to values of , more similar to low-redshift disks.
The decline in the vertical gas velocity dispersion displayed by Models A, B and C results from the dissipation of energy in random motions . As has been argued by Elmegreen & Burkert (2010), the time evolution of is determined by the energy input by accretion (or any other driver of dispersion) and the dissipation of energy, which acts on a timescale , where is the vertical extent of the disk. For and , the timescale is . The decrease in in our models is slower, as accretion processes are still active, but become increasingly less important compared to dissipation. Elmegreen & Burkert (2010) argue, that accretion can only drive high velocity dispersions in an initial phase of disk formation, in agreement with our models.
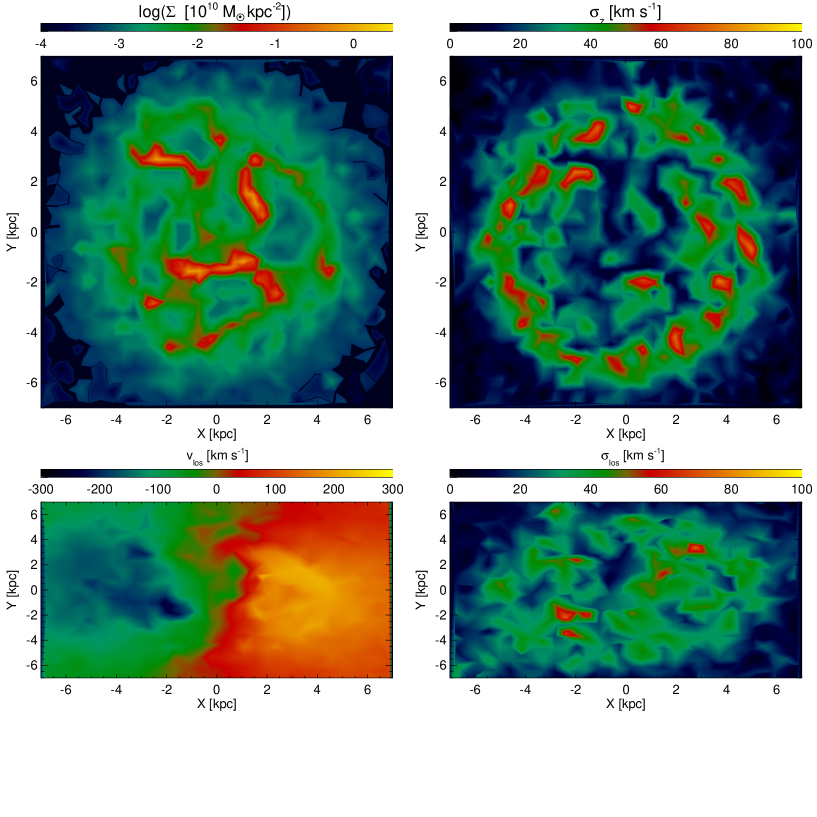
The analysis above suggests that there should be different velocity dispersion patterns for face-on and inclined observations of our objects in the massive clump phase. We show in Fig. 7 the predicted observational patterns of Model A at , a time at which the expected difference due to the inclination should be large. We choose Model A as the accretion in the later phases occurs primarily at the outer edge of the disk enabling us to distinguish between accretion and disk-gravity driven velocity dispersion. Furthermore, in gas-only models we do not have the additional effects of star formation and feedback complicating the picture. The top left panel of Fig. 7 shows that the system is dominated by four massive clump complexes, of which the lower two clumps are interacting. The presence of these clumps also affects the predicted line-of sight velocity map for an inclined view as shown in the bottom left panel. The top right panel depicts the line-of-sight velocity dispersion map for a face-on and the right bottom for an inclined view. Thus, the top right panel shows the vertical z-dispersion. High gas surface densities correspond to minima in . The impact of accretion is reflected by a ring-like structure of high at large radii. However, on the other hand, for the inclined view the high surface densities correspond to high values of line-of-sight dispersion, due to the high radial dispersion. In contrast to the global quantities displayed in figure 8, these velocity dispersions are local quantities, reflecting the substructure in the disks.
We note that not all clumps correspond to high at all times as there are several effects playing a role. As discussed in section 3.3, the clumps are centrifugally-supported mini-disks showing a rotational velocity increasing with radius in the center-of-mass frame. This variation in contributes to the line-of sight dispersion . However, the clumps are hardly ever axisymmetric (cf. Fig. 7), but shaped by clump-clump interactions and tidal forces, which in each clump create an intrinsic radial velocity dispersion. Major interactions of clumps such as mergers produce high intrinsic planar dispersions thus resulting in the highest values of the inclined-view dispersion. A third effect contributing to the high values of in Fig. 8 is the clump-to-clump dispersion originating from the different radial center-of-mass velocities of the individual clumps.
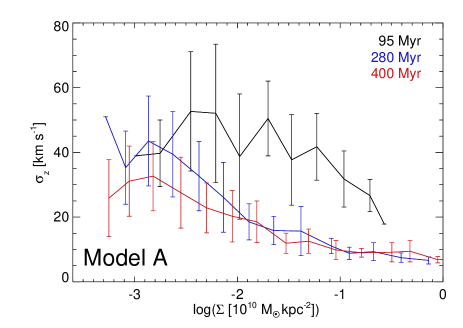
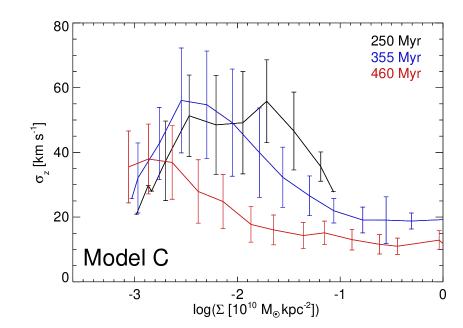
Unlike at (Fig. 7), where high surface density is correlated with low vertical velocity dispersion , this is not the case for the ring phase of Model A at , which is displayed in the top row of Fig. 4. Fig. 8 shows a relatively high global at that time. In Fig. 9 we plot disk surface density vs local vertical velocity dispersion . The dispersion was determined for a pixelated map of the disk for regions within the disk radius for Models A,B and C at three different stages of evolution. The black curve in the upper panel depicts the ring phase of Model A, when dispersion is mainly driven by accretion and is relatively independent of as applies to a wide range of surface densities. In the regions with the highest surface densities, which correspond to the clumps that are about to form, the dispersion is already slightly smaller. For the subsequent clump-dominated phase, represented by the blue and the red curves, there is a clear trend of decreasing with increasing surface density with for the high density regions, a trend that is also depicted in Fig. 7.
For Model B, shown in the middle panel, the initial disk/ring phase represented by the black curve corresponds to high vertical dispersions for all surface densities. The red and the blue curves again illustrate general trends of decreasing with time and of lower dispersion for higher densities, similar to Model A. However these curves also show features contradicting these trends, most prominently the peak of the blue curve at for high surface densities. This distinct feature originates from the clump-clump mergers with vertical offset as discussed in Section 3.3. The corresponding curves for Model C are depicted in the lower panel. They reveal a similar evolution to those of Model A.
The low -dispersions in the massive clumps result from the efficient dissipation of energy in random motions in the dense gas. It is easier to drive and sustain high vertical velocity dispersion by accretion in low surface density regions than in high regions. The reason for this is, that depends strongly on surface density, whereas the energy in the accretion flow per area is independent of surface density. Moreover, the accretion rates on average decline in all models resulting in a decline in with time also for low-to medium surface densities.
An anisotropy in velocity dispersions with for gravitationally unstable disks was already discussed by Toomre (1964). Bottema (2003) found for the gas component in SPH simulations of (marginally) -stable, isolated late-type disk galaxies, but attributed this finding to supernova feedback effects. More recently, Agertz et al. (2009a) found a similar anisotropy for HI gas in their study of large scale galactic turbulence in simulations of isolated disk galaxies. They note that their velocity dispersions are ’gravity driven’, which includes gravitational instability with , as in our simulations, but also non-axisymmetric perturbations with .
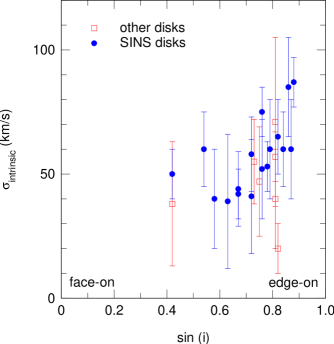
In Fig. 10 we plot observed intrinsic velocity dispersions in massive disk galaxies from the SINS survey (Förster Schreiber et al., 2009) (blue dots) and other high-z disks (red squares; Epinat et al., 2009; Stark et al., 2008; van Starkenburg et al., 2008; Wright et al., 2007) as a function of the inclination angle , under which the disk has been observed. The observations reveal a systematic variation of velocity dispersion with , where disks that have been observed under the lowest inclination angle (), show the lowest dispersions . These disks typically have a dispersion of , whereas strongly inclined systems show values as high as . This is similar to our results displayed in Figs. 7 and 8, where the vertical dispersion , which is equal to the line-of-sight dispersion for face-on disks () is systematically lower than the radial dispersion , which contributes to more strongly for more inclined disks. Unfortunately, no data for face-on disks is yet available, and the line-of-sight velocities of disks with still have significant contributions from radial velocities. The lowest values for tend to be slightly higher than the values for in our simulations, with Model B being the best match to these observations.
3.5. Stellar Disk Scale Heights
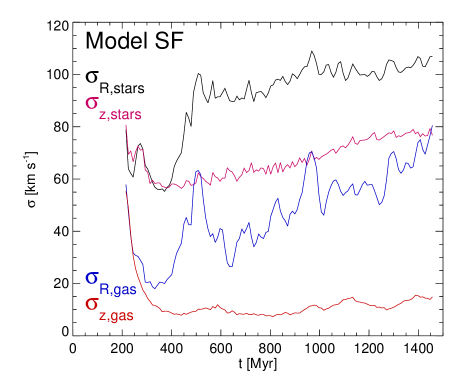
Finally, we study whether small vertical gas velocity dispersions also lead to cold stellar disks with small scale heights. The global gas velocity dispersion in Model SF, which is displayed in Fig. 11, initially exhibits similar behavior to Model B. However, because of the lack of distinct clumps and clump interactions the increase in the global radial velocity dispersion is delayed and limited to values of . The vertical velocity dispersion declines similarly to the gas-only models.
We calculate global stellar velocity dispersions at a certain time in Model SF including all stellar particles that have formed at and show them in Fig. 11. Defined as such, the included stellar population changes from one time to the next. The stellar velocity dispersion for Model SF are significantly larger than the gas velocity dispersions. The vertical stellar dispersion is almost constant, increasing from at to at . however initially () shows a similar trend to with the dispersion rising to values of in the bar phase after a minimum of . The evolution of stellar velocity dispersions with time as displayed in Fig. 11 is thus similar to the results of Immeli et al. (2004a) for central stellar velocity dispersions in simulations of gravitationally unstable disks.
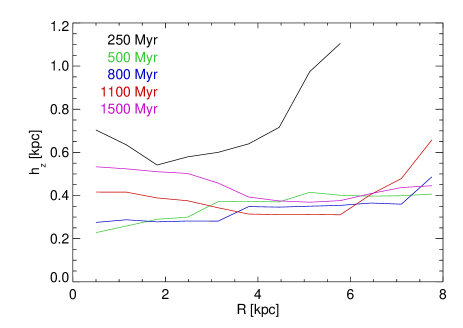
In Fig. 12 we display stellar exponential scale-heights as a function of the disk-radius extracted from an edge-on view of the galaxy. In the initial formation phase the stellar disk is thick with stellar scale heights of as can also be seen in the top row of Fig. 3. In this phase the disk is dominated by strong accretion-processes as discussed in section 3.4. A population of stars that have formed in clouds before entering the disk settle in a thick disk. However, new stars typically form near the mid-plane of the disk and consequently the scale-heights decrease in the phases with the highest SFRs. Typical values are for , comparable to the local Milky Way thin disk. This evolution is in agreement with a constant , as the surface density of the disk is continuously increasing. After the scale-heights in the central region begin to increase again up to values . This heating is caused by the bar structure. The scale-height depends only weakly on disk-radius with the strong early variation at 250 Myr caused by the small radial extent of the disk, which is in the first stages of its formation. Finally, we note, that the specific prescription for star formation and the choice of the star formation density threshold , influences the formation of the disk, especially in the early phases, and thus the disk scale heights.
4. Discussion
We have shown that different infall scenarios with disks forming inside-out or simultaneously at a large range of radii can result in the formation of rings. We argue that distinct edges of disks lead to enhanced accretion of material at these locations which results in rings. Such focal points could also originate from enhanced infall of material with a certain angular momentum or scenarios which have less continuous infall, for example an evolution driven by minor mergers (Naab et al., 2009, see also Burkert & Hartmann, 2004). The position of the ring is initially determined by the angular momentum distribution of the material, which forms the first disk in the center of the halo. As displayed by one of our models, the ring radius can increases later-on if material with higher angular momentum settles into the equatorial plane before the ring breaks up. We conclude that these ring formation processes should play a role in massive high-redshift ring galaxies. We also find that rings and clumps characteristically influence the shape of the rotation curves of galaxies.
Our simulations indicate that observations of rings, clumps and bulges in disk galaxies at redshift are likely to display systems during different stages of evolution. Our gas-only models are not able to reproduce the formation of bulges very well, as they lack diffuse gas and stellar components. However we expect massive star formation to set in once massive clumps have formed, which would lead to a faster migration of clumps to the center as shown in Model SF. When we include a simple, but widely-used model for star formation and subsequent feedback, our simulations still display the formation of clumpy and ring-like structure, however their density-contrasts compared to the rest of the disk are lower than in the gas-only simulations. Stars mainly form in these structures, which are not long-lived. Our treatment is too simplistic to allow for a statement on whether feedback can destroy clumps in disks (cf. Krumholz & Dekel, 2010; Murray et al., 2010).
Interestingly, our Model SF does not show a strong central component in its final stage, its radial surface density profile is relatively well fit by an exponential with a scale length comparable to that of the Milky Way. Transfer of angular momentum from the baryonic component to the dark matter plays an essential role, which is in agreement with the conclusions of Burkert et al. (2010), who concluded that adiabatic contraction (e.g. Blumenthal et al., 1986) of the halo due to baryonic infall is problematic, as it predicts halo spin parameters that are significantly higher than expected. It is also in agreement with Pedrosa et al. (2010), whose simulations of galaxy formation in dark halos are also not able to reproduce the predictions of the adiabatic contraction theory.
We have run Model SF without feedback and find that due to the lack of additional pressure, clumps with similar masses to those of the gas-only runs (), but a less flattened morphology, form in the early disk formation phase (). The star formation occurs mainly within them at extremely high rates () consuming almost all first-infall gas within . After a clump-growth and migration phase the clump phase lasts until . The final system again does not display a strong central component, the bulge is however more massive than in Model SF. We note that the observational signatures of typical clumpy disks (SFR, clump fraction) are intermediate to our simulations with and without feedback.
We find that accretion of gas can drive high velocity dispersion of the order of in radial and vertical direction, as long as it penetrates disk regions of low to medium surface densities. Thus accretion plays an important role in the transient early phases of disk assembly, but affects the massive clumps region in later evolutionary stages less strongly. We note, that the infall of gas clouds produced by thermal instability onto the disks in our simulations enhances high velocity dispersions. The thermal instability arises due to numerical noise in the initial conditions, however, as has been argued by Kaufmann et al. (2006), realistic counterparts of these clouds are likely to exist in gas accretion onto galaxies. The decrease of with time is consistent with estimated dissipation timescales and with predictions of Elmegreen & Burkert (2010) Gravitational instability and the gravitational interactions between massive clumps however are able to produce high dispersions for in-plane motions. The vs time plot of Fig. 8 reveals phases of driving velocity dispersion by accretion and disk-instability, in agreement with the predictions of Elmegreen & Burkert (2010). Peaks of produced by close interactions of the most massive clumps. Clump-clump mergers increase the radial dispersion for all our models. However, only in Model B, which features the largest vertical offsets of clumps, they also effect the vertical dispersion due to vertical gravitational forces between vertically offset interacting clumps. Except for phases dominated by mergers of this kind, all models show a characteristic decrease of with time , as the dissipation of energy in random motions starts to become increasingly more effective and to dominate over the driving of high velocity dispersions by accretion. The rotation-to-radial gas velocity dispersion ratios agree very well with observations of high- disks for our Models A, B and C at all times. For the vertical dispersion, only agrees with observations during the accretion-dominated phase.
In the clump dominated phase, all models also show a characteristic decrease of with increasing surface density , as long as they are not affected by mergers of clumps with vertical offsets. Because of this, face-on views of clumpy disks display minima of the line-of-sight dispersion at the positions of the clumps, whereas for an inclined view, the clumps correspond to higher than average dispersion resulting from the high in-plane dispersion. This is not true for the ring phase, in which is relatively independent of . However, already in the phase of initial ring fragmentation, the clumps, which are about to form, show smaller values of than the rest of the ring.
We present observational evidence for a systematic variation of vertical velocity dispersion with viewing-angle of the disk for galaxies. The observed dispersion for disks with the lowest inclination angle is still higher than the vertical dispersion in our Models A and C, only partly explained by the contribution from in-plane motions. Model B is a better match to the observations for low-inclination disks. A possible explanation might be that feedback processes and/or ongoing strong vertical accretion into the massive clump region create high radial and vertical velocity dispersions of the order of the observed face-on value and vertical offsets of clumps and thus play a significant role vertically, but not for the in-plane motions, whose dispersion is dominated by disk self-gravity. The symmetry of our initial conditions also defines a perfect disk plane. Mini-disks inclined to the disk plane would also give rise to vertical dispersions.
The scale-heights of our forming stellar disk in Model SF are significantly thinner than those simulated by Bournaud et al. (2009) and do actually not correspond to thick disks. Only the early phase, which is characterized by high accretion rates into all disk regions displays exponential scale-heights . The final scale-heights are larger than that of the Milky Way thin disk but lower than that of the thick disk. One reason for this is that our Model SF includes feedback and does not display distinct, massive and long-lived clumps. In our test-run without feedback, we find that scale-heights are higher by a factor of due to the more compact clumps that scatter stars more efficiently, and show stronger radial variations, but still they are thinner than the Milky Way thick disk. We have also run test-simulations of isolated, massive disks with similar initial conditions to Bournaud et al. (2007) and have been able to produce scale-heights of the order of . The final scale-height depends critically on the Toomre Q factor of the initial disk. The lower Q, the more massive and distinct the clumps that form and the more vertically extended the disks.
The scale-heights are however always smaller by a factor of compared to Bournaud et al. (2009). The reason for this might be that Bournaud et al. used a sticky particle code for the gas component, whereas we use an SPH code. We also find small variations of scale-height with radius, possibly on account of different halo potentials. The increase in scale-height is consistent with the idea that the disk thickens by stars being scattered off massive clumps. In contrast to collisionless stellar particles this is not possible for massive gas clouds, which due to their larger cross-section dissipate kinetic energy in close encounters. A simple estimate for the velocity a particle can gain perpendicular to its original direction is given by
| (6) |
where is the impact parameter, is the scale-radius of the clump, is the relative velocity of the clump and the particle and is the clump mass (Binney & Tremaine, 1987, p.474). Taking this as an estimate for velocity dispersion and using , , and , we find . Thus disk heating is likely to occur in clumpy, massive galaxies. However, the efficiency of this process depends on how compact the clumps are, how long they survive and where and when the stars form. Because of this it is not clear, whether this is the only process at work in creating thick disks in high-redshift galaxies and whether they are the birthplace of present-day thick disks. Distinct, massive clumps are also present in our run of Model SF without feedback. However, the continuous accretion of gas continuously allows continuous star formation and reduces the disk heating.
Given the limitations inherent in our models, we are able to study essential physical processes that are important for the early stages of galaxy evolution and their signatures. We are also able to qualitatively reproduce observational signatures of galaxies allowing us to draw conclusions about the role these processes play in these objects. However, more detailed effort is necessary to understand in detail the observational properties of high-redshift disk galaxies.
References
- Agertz et al. (2009a) Agertz, O., Lake, G., Teyssier, R., Moore, B., Mayer, L., & Romeo, A. B. 2009a, MNRAS, 392, 294
- Agertz et al. (2009b) Agertz, O., Teyssier, R., & Moore, B. 2009b, MNRAS, 397, L64
- Aumer & Binney (2009) Aumer, M. & Binney, J. J. 2009, MNRAS, 397, 1286
- Binney & Tremaine (1987) Binney, J. & Tremaine, S. 1987, Galactic Dynamics, Princeton University Press, Princeton, NJ
- Blumenthal et al. (1986) Blumenthal, G. R., Faber, S. M., Flores, R., & Primack, J. R. 1986, ApJ, 301, 27
- Bottema (2003) Bottema, R. 2003, MNRAS, 344, 358
- Bournaud & Elmegreen (2009) Bournaud, F. & Elmegreen, B. G. 2009, ApJ, 694, L158
- Bournaud et al. (2007) Bournaud, F., Elmegreen, B. G., & Elmegreen, D. M. 2007, ApJ, 670, 237
- Bournaud et al. (2009) Bournaud, F., Elmegreen, B. G., & Martig, M. 2009, ApJ, 707, L1
- Bullock et al. (2001) Bullock, J. S., Dekel, A., Kolatt, T. S., Kravtsov, A. V., Klypin, A. A., Porciani, C., & Primack, J. R. 2001, ApJ, 555, 240
- Burkert et al. (2010) Burkert, A., Genzel, R., Bouche, N., Cresci, G., Khochfar, S., Sommer-Larsen, J., Sternberg, A., Naab, T., Foerster-Schreiber, N., Tacconi, L., Shapiro, K., Hicks, E., Lutz, D., Davies, R., Buschkamp, P., & Genel, S. 2010, ArXiv e-prints, arXiv:0907.4777
- Burkert & Hartmann (2004) Burkert, A. & Hartmann, L. 2004, ApJ, 616, 288
- Burkert & Lin (2000) Burkert, A. & Lin, D. N. C. 2000, ApJ, 537, 270
- Ceverino et al. (2010) Ceverino, D., Dekel, A., & Bournaud, F. 2010, MNRAS, 404, 2151
- Cresci et al. (2009) Cresci, G., Hicks, E. K. S., Genzel, R., Schreiber, N. M. F., Davies, R., Bouché, N., Buschkamp, P., Genel, S., Shapiro, K., Tacconi, L., Sommer-Larsen, J., Burkert, A., Eisenhauer, F., Gerhard, O., Lutz, D., Naab, T., Sternberg, A., Cimatti, A., Daddi, E., Erb, D. K., Kurk, J., Lilly, S. L., Renzini, A., Shapley, A., Steidel, C. C., & Caputi, K. 2009, ApJ, 697, 115
- Daddi et al. (2010) Daddi, E., Bournaud, F., Walter, F., Dannerbauer, H., Carilli, C. L., Dickinson, M., Elbaz, D., Morrison, G. E., Riechers, D., Onodera, M., Salmi, F., Krips, M., & Stern, D. 2010, ApJ, 713, 686
- Dekel et al. (2009a) Dekel, A., Birnboim, Y., Engel, G., Freundlich, J., Goerdt, T., Mumcuoglu, M., Neistein, E., Pichon, C., Teyssier, R., & Zinger, E. 2009a, Nature, 457, 451
- Dekel et al. (2009b) Dekel, A., Sari, R., & Ceverino, D. 2009b, ApJ, 703, 785
- Dib et al. (2006) Dib, S., Bell, E., & Burkert, A. 2006, ApJ, 638, 797
- Elmegreen & Burkert (2010) Elmegreen, B. G. & Burkert, A. 2010, ApJ, 712, 294
- Elmegreen et al. (2009) Elmegreen, B. G., Elmegreen, D. M., Fernandez, M. X., & Lemonias, J. J. 2009, ApJ, 692, 12
- Epinat et al. (2009) Epinat, B., Contini, T., Le Fèvre, O., Vergani, D., Garilli, B., Amram, P., Queyrel, J., Tasca, L., & Tresse, L. 2009, A&A, 504, 789
- Förster Schreiber et al. (2009) Förster Schreiber, N. M., Genzel, R., Bouché, N., Cresci, G., Davies, R., Buschkamp, P., Shapiro, K., Tacconi, L. J., Hicks, E. K. S., Genel, S., Shapley, A. E., Erb, D. K., Steidel, C. C., Lutz, D., Eisenhauer, F., Gillessen, S., Sternberg, A., Renzini, A., Cimatti, A., Daddi, E., Kurk, J., Lilly, S., Kong, X., Lehnert, M. D., Nesvadba, N., Verma, A., McCracken, H., Arimoto, N., Mignoli, M., & Onodera, M. 2009, ApJ, 706, 1364
- Förster Schreiber et al. (2006) Förster Schreiber, N. M., Genzel, R., Lehnert, M. D., Bouché, N., Verma, A., Erb, D. K., Shapley, A. E., Steidel, C. C., Davies, R., Lutz, D., Nesvadba, N., Tacconi, L. J., Eisenhauer, F., Abuter, R., Gilbert, A., Gillessen, S., & Sternberg, A. 2006, ApJ, 645, 1062
- Genzel et al. (2008) Genzel, R., Burkert, A., Bouché, N., Cresci, G., Förster Schreiber, N. M., Shapley, A., Shapiro, K., Tacconi, L. J., Buschkamp, P., Cimatti, A., Daddi, E., Davies, R., Eisenhauer, F., Erb, D. K., Genel, S., Gerhard, O., Hicks, E., Lutz, D., Naab, T., Ott, T., Rabien, S., Renzini, A., Steidel, C. C., Sternberg, A., & Lilly, S. J. 2008, ApJ, 687, 59
- Genzel et al. (2006) Genzel, R., Tacconi, L. J., Eisenhauer, F., Förster Schreiber, N. M., Cimatti, A., Daddi, E., Bouché, N., Davies, R., Lehnert, M. D., Lutz, D., Nesvadba, N., Verma, A., Abuter, R., Shapiro, K., Sternberg, A., Renzini, A., Kong, X., Arimoto, N., & Mignoli, M. 2006, Nature, 442, 786
- Governato et al. (2010) Governato, F., Brook, C., Mayer, L., Brooks, A., Rhee, G., Wadsley, J., Jonsson, P., Willman, B., Stinson, G., Quinn, T., & Madau, P. 2010, Nature, 463, 203
- Haardt & Madau (1996) Haardt, F. & Madau, P. 1996, ApJ, 461, 20
- Hinshaw et al. (2009) Hinshaw, G., Weiland, J. L., Hill, R. S., Odegard, N., Larson, D., Bennett, C. L., Dunkley, J., Gold, B., Greason, M. R., Jarosik, N., Komatsu, E., Nolta, M. R., Page, L., Spergel, D. N., Wollack, E., Halpern, M., Kogut, A., Limon, M., Meyer, S. S., Tucker, G. S., & Wright, E. L. 2009, ApJS, 180, 225
- Immeli et al. (2004a) Immeli, A., Samland, M., Gerhard, O., & Westera, P. 2004a, A&A, 413, 547
- Immeli et al. (2004b) Immeli, A., Samland, M., Westera, P., & Gerhard, O. 2004b, ApJ, 611, 20
- Johansson & Efstathiou (2006) Johansson, P. H. & Efstathiou, G. 2006, MNRAS, 371, 1519
- Johansson et al. (2009a) Johansson, P. H., Naab, T., & Burkert, A. 2009a, ApJ, 690, 802
- Johansson et al. (2009b) Johansson, P. H., Naab, T., & Ostriker, J. P. 2009b, ApJ, 697, L38
- Katz et al. (1996) Katz, N., Weinberg, D. H., & Hernquist, L. 1996, ApJS, 105, 19
- Kaufmann et al. (2006) Kaufmann, T., Mayer, L., Wadsley, J., Stadel, J., & Moore, B. 2006, MNRAS, 370, 1612
- Kaufmann et al. (2007) —. 2007, MNRAS, 375, 53
- Kennicutt (1998) Kennicutt, Jr., R. C. 1998, ARA&A, 36, 189
- Kereš et al. (2005) Kereš, D., Katz, N., Weinberg, D. H., & Davé, R. 2005, MNRAS, 363, 2
- Klessen & Hennebelle (2010) Klessen, R. S. & Hennebelle, P. 2010, accepted to A & A, arXiv:0912.0288
- Krumholz & Dekel (2010) Krumholz, M. R. & Dekel, A. 2010, MNRAS, 635
- McKee & Ostriker (1977) McKee, C. F. & Ostriker, J. P. 1977, ApJ, 218, 148
- Murray et al. (2010) Murray, N., Quataert, E., & Thompson, T. A. 2010, ApJ, 709, 191
- Naab et al. (2009) Naab, T., Johansson, P. H., & Ostriker, J. P. 2009, ApJ, 699, L178
- Navarro et al. (1996) Navarro, J. F., Frenk, C. S., & White, S. D. M. 1996, ApJ, 462, 563
- Noguchi (1999) Noguchi, M. 1999, ApJ, 514, 77
- Pedrosa et al. (2010) Pedrosa, S., Tissera, P. B., & Scannapieco, C. 2010, MNRAS, 402, 776
- Pettini et al. (1994) Pettini, M., Smith, L. J., Hunstead, R. W., & King, D. L. 1994, ApJ, 426, 79
- Rand & Kulkarni (1990) Rand, R. J. & Kulkarni, S. R. 1990, ApJ, 349, L43
- Robitaille & Whitney (2010) Robitaille, T. P. & Whitney, B. A. 2010, ApJ, 710, L11
- Romeo et al. (2010) Romeo, A. B., Burkert, A., & Agertz, O. 2010, accepted to MNRAS, arXiv:1001.4732
- Schönrich & Binney (2009) Schönrich, R. & Binney, J. 2009, MNRAS, 399, 1145
- Shapiro et al. (2008) Shapiro, K. L., Genzel, R., Förster Schreiber, N. M., Tacconi, L. J., Bouché, N., Cresci, G., Davies, R., Eisenhauer, F., Johansson, P. H., Krajnović, D., Lutz, D., Naab, T., Arimoto, N., Arribas, S., Cimatti, A., Colina, L., Daddi, E., Daigle, O., Erb, D., Hernandez, O., Kong, X., Mignoli, M., Onodera, M., Renzini, A., Shapley, A., & Steidel, C. 2008, ApJ, 682, 231
- Springel (2005) Springel, V. 2005, MNRAS, 364, 1105
- Springel et al. (2005) Springel, V., Di Matteo, T., & Hernquist, L. 2005, MNRAS, 361, 776
- Springel & Hernquist (2003) Springel, V. & Hernquist, L. 2003, MNRAS, 339, 289
- Stark et al. (2008) Stark, D. P., Swinbank, A. M., Ellis, R. S., Dye, S., Smail, I. R., & Richard, J. 2008, Nature, 455, 775
- Steidel et al. (2010) Steidel, C. C., Erb, D. K., Shapley, A. E., Pettini, M., Reddy, N. A., Bogosavljević, M., Rudie, G. C., & Rakic, O. 2010, accepted to ApJ
- Sutherland & Dopita (1993) Sutherland, R. S. & Dopita, M. A. 1993, ApJS, 88, 253
- Tacconi et al. (2010) Tacconi, L. J., Genzel, R., Neri, R., Cox, P., Cooper, M. C., Shapiro, K., Bolatto, A., Bouché, N., Bournaud, F., Burkert, A., Combes, F., Comerford, J., Davis, M., Schreiber, N. M. F., Garcia-Burillo, S., Gracia-Carpio, J., Lutz, D., Naab, T., Omont, A., Shapley, A., Sternberg, A., & Weiner, B. 2010, Nature, 463, 781
- Toomre (1964) Toomre, A. 1964, ApJ, 139, 1217
- van Starkenburg et al. (2008) van Starkenburg, L., van der Werf, P. P., Franx, M., Labbé, I., Rudnick, G., & Wuyts, S. 2008, A&A, 488, 99
- Wright et al. (2007) Wright, S. A., Larkin, J. E., Barczys, M., Erb, D. K., Iserlohe, C., Krabbe, A., Law, D. R., McElwain, M. W., Quirrenbach, A., Steidel, C. C., & Weiss, J. 2007, ApJ, 658, 78
- Zhao et al. (2009) Zhao, D. H., Jing, Y. P., Mo, H. J., & Börner, G. 2009, ApJ, 707, 354