Mid-infrared spectroscopy of high-redshift 3CRR sources
Abstract
Using the Spitzer Space Telescope, we have obtained rest frame 9–16 µm spectra of 11 quasars and 9 radio galaxies from the 3CRR catalog at redshifts . This complete flux-limited 178 MHz-selected sample is unbiased with respect to orientation and therefore suited to study orientation-dependent effects in the most powerful active galactic nuclei (AGN). The mean radio galaxy spectrum shows a clear silicate absorption feature () whereas the mean quasar spectrum shows silicates in emission. The mean radio galaxy spectrum matches a dust-absorbed mean quasar spectrum in both shape and overall flux level. The data for individual objects conform to these results. The trend of the silicate depth to increase with decreasing core fraction of the radio source further supports that for this sample, orientation is the main driver for the difference between radio galaxies and quasars, as predicted by AGN unification. However, comparing our high- sample with lower redshift 3CRR objects reveals that the absorption of the high- radio galaxy MIR continuum is lower than expected from a scaled up version of lower luminosity sources, and we discuss some effects that may explain these trends.
1 Introduction
There is strong evidence that many luminous active galactic nuclei (AGN) are surrounded by dust in a torus-like geometry leading to orientation-dependent obscuration of the nuclear region (Antonucci & Miller, 1985; Barthel, 1989; Antonucci, 1993; Urry & Padovani, 1995). Despite the general consensus on the AGN unification principle, it is still a matter of debate whether obscuration is indeed the dominating effect on the observed differences between radio galaxies and quasars. The question remains if every obscured (type-2) AGN has a (type-1) AGN hidden by a “torus” or if some of the observed differences may arise from other effects, for instance different evolutionary states, different star forming activity in the hosts, or different accretion rates.
Orientation-dependent effects can only be tested with type-1 and type-2 AGN samples matched in isotropic emission. Low-frequency (meter wavelength) radio-selected AGN are particularly attractive for studying orientation-dependent properties at other wavelengths because the integrated emission from the radio lobes is optically thin and essentially isotropic. This paper therefore focuses on powerful double-lobed radio galaxies (type-2) and steep-spectrum quasars (type-1) taken from the 3CRR catalogue (Laing et al., 1983), a subset of the deeper and larger 3CR sample (Spinrad et al., 1985). The 3CRR sample provides a complete, flux-limited sample of radio-loud objects selected at 178 MHz. Mid infrared (MIR) and far infrared (FIR) observations of orientation-unbiased samples are valuable tools for the study of unification schemes. They probe the intrinsic energy budget of the nuclear regions where the optical/UV radiation from the accretion disk is absorbed by the surrounding dust, which then re-emits the absorbed energy at infrared wavelengths. Thus, the infrared might serve as a “calorimeter” for the radiative output in the nucleus. However, while the infrared radiation has the ability to penetrate the obscuring dust, it will still suffer some (wavelength-dependent) extinction, which may yield important clues as to the nature of the obscurer itself.
At lower redshift () the large number of radio galaxies compared to quasars is inconsistent with orientation-dependent models (e.g., Fig. 1 of Singal, 1993). It has been argued that this might be due to an additional population of low-luminosity radio galaxies which falls below the selection limit in typical higher-redshift, low-frequency-selected samples. These low-luminosity radio galaxies often show quite different multi wavelength properties with moderately absorbed (and less luminous) accretion-related X-ray emission (e.g. Hardcastle et al., 2009), optical spectra of low ionization (e.g. Buttiglione et al., 2009), and weak MIR emission (Meisenheimer et al., 2001; Ogle et al., 2006; van der Wolk et al., 2010).
At intermediate redshifts () numerous studies — often utilizing IR data — show that the unification picture works well for radio galaxies and quasars (e.g. Barthel, 1989; Haas et al., 2004). To date, a large number of 3CR objects have been studied in the MIR and FIR with ISO (e.g. van Bemmel et al. 2000;Meisenheimer et al. 2001; and as compiled by Siebenmorgen et al. 2004 and by Haas et al. 2004) and with Spitzer (e.g. Shi et al., 2005; Haas et al., 2005; Ogle et al., 2006; Cleary et al., 2007). While such studies were vital to establish the unification picture at , some of this work also indicated that on average quasars seem to be a factor of a few more luminous in the infrared than radio galaxies when normalized by their total radio luminosity. To explain this effect, it was argued that non-thermal contributions of a beamed radio core increase the infrared fluxes of quasars in addition to the wavelength-dependent obscuration of the torus in radio galaxies (e.g. Hes et al., 1995; Cleary et al., 2007). Meisenheimer et al. (2001) and Haas et al. (2004) saw the MIR/FIR difference between quasars and radio galaxies but did not model it in detail (though the simplest explanation — obscuration — was briefly mentioned), and Siebenmorgen et al. (2004) have interpreted the difference in accordance with an obscuration scenario.
At high redshifts () the situation is less clear. For the 3CR sources at these redshifts, sensitive FIR (60-200 m) observations have yet to be made, but 3.6–24 µm photometry of the complete high- part () of the 3CR sample has been obtained with Spitzer. The rest frame 2–10 µm spectral energy distributions (SEDs) provide evidence for dust emission which is a factor 3–5 weaker in type-2 AGN compared to type-1 AGN (Haas et al., 2008). The mean radio galaxy SED is consistent with a reddened version of the mean quasar SED, leaving little room for a significant contribution of beamed non-thermal emission to the infrared SEDs of quasars, at least for that sample.
Apart from the unification issues, it is vital to further explore the largely unknown MIR properties of high redshift radio-loud AGN and to expand the luminosity range and potentially the AGN-host contrast studied so far. Therefore, we here analyze Spitzer spectra of the quasars and radio galaxies in the 3CRR sample at redshift . We use a CDM cosmology with km s-1 Mpc-1, , and .
| Object | references | |||||||||
| (Jy) | (mJy) | (mJy) | ||||||||
| (1) | (2) | (3) | (4) | (5) | (6) | (7) | (8) | (9) | ||
| Quasars | ||||||||||
| 3C 068.1 | 1.238 | 14.0 | 0.80 | 1.1 | 4 | 9. | 3 | 0.7 | -0. | 05 |
| 3C 181 | 1.382 | 15.8 | 1.00 | 9.0 | 8 | 8. | 7 | 0.5 | 0. | 19 |
| 3C 186 | 1.063 | 15.4 | 1.15 | 15.0 | 7 | 8. | 2 | 0.6 | -0. | 12 |
| 3C 190 | 1.197 | 16.4 | 0.93 | 73.0 | 7 | 13. | 4 | 1.5 | 0. | 60 |
| 3C 204 | 1.112 | 11.4 | 1.08 | 26.9 | 4 | 8. | 3 | 0.5 | -0. | 13 |
| 3C 208 | 1.109 | 18.3 | 0.96 | 51.0 | 4 | 5. | 8 | 0.5 | -0. | 27 |
| 3C 212 | 1.049 | 16.5 | 0.92 | 186.0 | 1 | 15. | 5 | 0.9 | -0. | 11 |
| 3C 245 | 1.029 | 15.7 | 0.78 | 1219.0 | 12 | 28. | 3 | 1.9 | -0. | 02 |
| 3C 268.4 | 1.400 | 11.2 | 0.80 | 45.0 | 11 | 15. | 6 | 0.8 | 0. | 05 |
| 3C 287 | 1.055 | 17.8 | 0.42 | 3280.0 | 9 | 7. | 1 | 0.6 | -0. | 23 |
| 3C 325 | 1.135 | 17.0 | 0.70 | 2.4 | 5 | 4. | 5 | 0.3 | -0. | 21 |
| Radio Galaxies | ||||||||||
| 3C 013 | 1.351 | 13.1 | 0.93 | 0.18 | 2 | 5. | 6 | 0.9 | 0. | 85 |
| 3C 065 | 1.176 | 16.6 | 0.75 | 0.52 | 2 | 2. | 2 | 0.2 | 0. | 30 |
| 3C 252 | 1.105 | 12.0 | 1.03 | 2.2 | 5 | 11. | 8 | 1.0 | 0. | 61 |
| 3C 266 | 1.272 | 12.1 | 1.01 | 0.4 | 6 | 2. | 9 | 0.4 | 0. | 72 |
| 3C 267 | 1.144 | 15.9 | 0.93 | 1.87 | 10 | 6. | 0 | 0.5 | 0. | 77 |
| 3C 324 | 1.206 | 17.2 | 0.90 | 0.17 | 3 | 8. | 3 | 0.7 | 1. | 71 |
| 3C 356 | 1.079 | 12.3 | 1.02 | 1.1 | 5 | 7. | 4 | 0.6 | 0. | 91 |
| 3C 368 | 1.132 | 15.0 | 1.24 | 0.22 | 3 | 8. | 1 | 0.7 | 1. | 74 |
| 3C 469.1 | 1.336 | 12.1 | 0.96 | 2.4 | 10 | 8. | 3 | 1.3 | 1. | 74 |

2 Data
Our sample comprises all objects of the 3CRR catalog111http://3crr.extragalactic.info/ with 222Due to an updated redshift (Grimes et al., 2005), 3C 325 is included. 4C 16.49 (: Aars et al., 2005) should in principle be part of the sample, but at the time the observations were defined the NED redshift was , and therefore no data were obtained for this source. . This selection includes 20 sources in total, 11 quasars and 9 radio galaxies. Some basic properties of the sources are presented in Table 1. The redshift range was selected to cover the rest frame wavelengths 9–16 m when using the LL1 spectral module of the Infrared Spectrograph (IRS, Houck et al. 2004) on board Spitzer Space Telescope (Werner et al., 2004). For , the spectral window of the IRS/LL1 ( m) includes redshifted low- and high-excitation atomic emission lines [Ne II] 12.8 m, [Ne V] 14.3 m, and [Ne III] 15.5 m. It also covers potential 11.3 m PAH emission from star formation and the silicate feature at 9.7 m.
18 objects were observed for a total of 2880 seconds each with IRS in the LL1 module (PID-40314, PI M. Haas). The remaining objects, 3C 356 (PID 03349, PI R. Siebenmorgen) as well as 3C 325 (PID 00074, PI J. Houck), were observed previously in LL1 for a total of 960 s each. The individual frames were averaged for each nod position separately, and the resulting images were used to subtract the background from the other nod. The final background-subtracted images were cleaned of residual rogue pixels and cosmic rays using irsclean. The spice software was used to calibrate and extract one dimensional spectra. The extracted spectra from the two nod positions were then averaged into a single spectrum.
The comparison of our spectroscopy with photometric measurements in the MIPS (Rieke et al., 2004) 24 m filter reveals a good agreement except for 3C 13, 3C 65, 3C 68.1, and 3C 267, all of which show a flux deficit in the spectra. Checking the pointing for the observation reveals that for 3C 13, the spectroscopic slit fell slightly off-center thus missing part of the flux. We applied a multiplicative factor of 1.8 to the spectrum to bring it to the level of the photometric measurement. For the radio galaxy 3C 267, the MIPS 24 m image reveals a faint source to the north-west which is also partly covered by the slit. The distance of this faint source from the radio galaxy is close to the nod throw along the slit. While this configuration can potentially lead to an overcorrection when the two nod positions are subtracted from each other to remove the background, we cannot identify the faint source on averaged 2-dimensional spectral frames at the individual nod positions. A multiplicative factor of 1.2 is needed to match the spectrum with the photometry. For the other two sources, 3C 65 and 3C 68.1, no immediate cause for the flux difference could be identified. For these objects we applied correction factors of 1.5 and 1.3, respectively. These corrections do not affect the basic conclusions drawn here, but we mention that wavelength-dependent slit losses could result in overestimating the silicate depth in 3C 13 (section 3.2).
2.1 Creating Average Spectra and SEDs
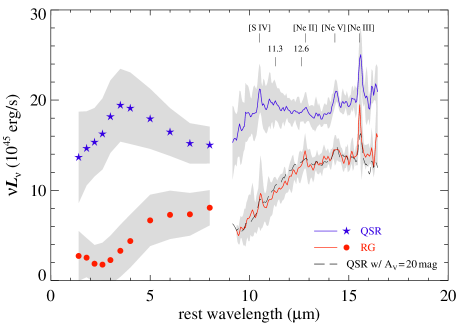
All objects have been securely detected, and continuum features such as silicates in emission or absorption can be observed in individual sources (see Table 1 for measured rest-frame MIR fluxes and Fig.1 for the observed spectra). Because the quality of the spectra is often limited, we created separate average spectra for the radio galaxies and quasars. First, the individual spectra were shifted into the rest frame of the source, interpolated onto a common wavelength grid, and then the interpolated spectra were transformed into . To avoid the average spectra being dominated by the most MIR luminous objects, the spectra were normalized in before averaging. While this normalization is well suited to emphasize differences in the spectral shape, information about the absolute MIR luminosity is removed from the average spectra. This information, however, may be recovered using the extended radio luminosity of the sources.
Due to their selection, the quasars and radio galaxies in this sample span the same range of radio luminosities. The actual rest frame mean values are erg/s for the quasars and erg/s for the radio galaxies. First we used the 15 m normalization factors to scale the individual values. Then we normalized the average IR SEDs of each class to have the same average of erg/s, which is the mean rest frame 178 MHz radio luminosity of the complete sample.
In addition to the spectra, observed photometry at 3.6, 4.5, 5.8, 8.0, 16, and 24 m (Haas et al., 2008) was used to construct average near-infrared (NIR)/MIR SEDs for the sample. The photometric measurements were shifted in wavelength into the rest frame of the individual sources and then spline interpolated onto a common wavelength grid. Figure 1 shows the observed as well as the interpolated photometry together with the spectra. After transforming the interpolated values into we applied the same scaling factors as for the spectra and then averaged the photometry. After normalization, all the quasar SEDs are very similar to each other in shape (except for the strength of a NIR bump, see section 3.1), while the radio galaxy SEDs tend to be more diverse (Fig. 1). This has already been explored by Haas et al. (2008) for their larger and fainter sample (which includes the current sample), and the trends are similar. Despite the diversity in the radio galaxy SEDs, we did not exclude any object from the averaging process.
3 Results and Discussion
3.1 Average SEDs
Figure 2 shows the average spectra and photometry for the radio galaxies and quasars. The combination of the deep silicate absorption at 9.7 m and the overall lower flux levels indicate that the radio galaxies on average suffer considerable absorption throughout the entire MIR continuum relative to quasars. Applying a reddening screen of mag to the average quasar spectrum yields a very good match with the radio galaxy spectrum in the continuum level as well as in the shape of the silicate absorption feature.333We here use the MIR extinction curve from Chiar & Tielens (2006) normalized to the peak of the silicate feature at 9.7 m and . From the MIR point of view, this strongly supports the idea that the quasars and radio galaxies in our sample are in fact intrinsically identical with the former being essentially unobscured while the latter suffer from extinction. The good match of the average radio galaxy spectrum to the reddened quasar spectrum also implies that the intrinsic radio galaxy spectrum is not flat. In particular, the average radio galaxy must have silicate emission underlying the absorption feature (see section 3.2).
We here assumed a screen scenario where the absorbing material is placed in front of the emitter. However, in the clumpy torus models which in recent years were able to successfully explain the dust emission in local Seyfert galaxies (e.g. Hönig et al., 2006; Elitzur, 2008; Nenkova et al., 2008), the MIR-emitting zone is not located at a single radius but is spread over a range of radii, thus essentially creating a mixed-case scenario for parts of the absorber. In general, screen extinction underestimates column density by different amounts at different wavelengths. In addition, the bulk of the MIR emission will originate at moderate depth within the obscuring structure thus suffering (far) less extinction than radiation from the accretion disk or from hot dust located near the accretion disk. Thus, depending on the complexity of the geometry, the mean determined from the spectroscopy represents a lower limit and will in most cases underestimate the total column density by a large factor (see e.g. Levenson et al. 2007).
A notable feature in the average quasar SED is the prominent NIR bump at 2–5 µm (Fig. 2). This component is, to different degrees, present in the SEDs of essentially all individual quasars (Fig. 1). Such NIR bumps have been previously reported for individual type-1 AGN (e.g. Barvainis, 1987; Rodríguez-Ardila & Mazzalay, 2006; Riffel et al., 2009) and can be seen also in larger samples of quasars and in composite SEDs (e.g. Edelson & Malkan, 1986; Elvis et al., 1994; Gallagher et al., 2007). They are generally identified with graphite dust near the sublimation temperature located very close to the active nucleus (e.g. Barvainis, 1987; Mor et al., 2009). There is some indication that the strength of this feature increases with increasing visible/UV luminosity of the quasar (Edelson & Malkan, 1986; Gallagher et al., 2007).
In contrast to the quasars, the radio galaxies show no noticeable 2–5 µm bump. Screen reddening the average quasar SED with mag leaves an excess for m and especially at the location of the NIR bump (Fig.3, top). This feature is either missing in the radio galaxies, or it might suffer higher extinction than the longer-wavelength continuum.
For their larger sample, Haas et al. (2008) found that radio galaxy SEDs between 2 and 10 m are on average consistent with reddened quasars, similar to our result from the spectroscopy at 10–16 m. Because their sample of 3CR objects contains a large number of fainter and higher-redshift sources compared to the sample of 3CRR objects studied here, we performed the same analysis as described by Haas et al. but limiting the objects to our 20 sources. Using their approach, it would require a screen extinction of mag to match the average 2–10 m SEDs of radio galaxies and quasars in our sample. This value is higher than the value determined from the MIR spectroscopy alone ( mag, mag) as discussed above.

For the discrepancy at m, several possibilities can be imagined. One example is inaccuracies in the MIR extinction curves. Different extinction curves show differences in the continuum at 8 m and in the silicate feature (e.g. Mathis et al., 1983; Rieke & Lebofsky, 1985; Chiar & Tielens, 2006), and an incorrect ratio between continuum and silicate extinction could be part of the problem. However, considering the good fit in the silicate depth and in the continuum extinction for the spectra (Fig. 3, top), the extinction curve used here (Chiar & Tielens, 2006) works well at least at longer wavelengths. Moreover, published extinction curves (e.g., Indebetouw et al., 2005; Nishiyama et al., 2009) are all similar and equally featureless shortwards of the silicate feature. With curves such as these, it is not possible to match the NIR and MIR simultaneously in a screen configuration affecting all wavelengths equally.
An alternative solution can be found by including in the fits a separate blackbody component representing the NIR bump. Although a solid theoretical foundation for the origin and the properties of the NIR bump is still missing, it can be well described as a single temperature blackbody (e.g. Barvainis, 1987; Mor et al., 2009). If the bump comes from dust, the necessary high temperature places this dust component close to the nucleus, and the radiation from this component would have to penetrate a larger dust column than the rest of the continuum emission. Assuming a black body component from nuclear hot dust suffers more extinction than the rest of the IR continuum, screen-reddening of the average quasar SED is consistent with the average radio galaxy SED (Fig. 3, middle), and the derived temperature of the NIR bump blackbody ( K) is in the range expected from previous studies in the literature (e.g. Mor et al., 2009). The major requirement in this scenario is that the screen opacity for the NIR bump component () must be significantly higher than the opacity affecting other components ().
It could also be suggested that the NIR bump is absent in most radio galaxies. Subtracting a single-temperature blackbody from the average quasar spectrum before screen reddening the remaining continuum gives a good fit as well (Fig. 3, bottom). However, this scenario would imply that there are intrinsic differences between radio galaxies and quasars, where the latter host an additional dust component close to the nucleus. Such a scenario seems unlikely for the majority of the objects. Visible-light imaging and polarization studies show that at , essentially all luminous radio galaxies show the so-called alignment effect (Chambers et al., 1987; McCarthy et al., 1987), and much of this emission turns out to be scattered light from a hidden quasar (e.g. Cimatti et al., 1993, 1997; Vernet et al., 2001). Thus, at higher redshifts most if not all radio galaxies host a hidden quasar, arguing for the similarity of both types of objects. This also strongly argues that the main difference between these two types of objects is in the orientation of their nuclear structures with respect to us. Further clues on the nature of the NIR bump might be provided by detailed radiative transfer modeling of the SEDs of the sources (F. Heymann, in preparation). Regardless of the reason why the NIR bump is not seen in radio galaxies, the estimated value for changes very little. That is because it is determined mostly by the (rest frame) 10–13 m slope and secondarily by the (rest frame) 8 m photometry and hardly at all by shorter-wavelength assumptions or data. The rest of this paper uses only , and the NIR difference does not affect our main conclusions.
3.2 Individual Spectra
3.2.1 Fitting the Silicate Feature
A striking feature in Figure 2 is the deep 9.7 m silicate absorption observed for the radio galaxies. The long wavelength side of this feature is well measured in the spectra, and the shorter wavelength photometry data confirm the presence and depth of this feature. The silicates alone provide clear evidence that in the mean radio galaxy, a substantial amount of absorbing dust lies between the MIR continuum emitter and the observer.
For further analysis we determined the depth of the silicate feature in the individual objects by fitting the observed spectrum and photometry with an input spectrum reddened by a dust screen. Considering the uncertainties in treating the NIR bump component, we limited the fits for the individual objects to m. We again used the extinction curve presented by Chiar & Tielens (2006) and assumed that the intrinsic continuum of every source resembles the average quasar SED, including silicates in emission. In order to parameterize the average quasar SED, it was fit by a linear combination of three blackbodies of variable temperature. One of these blackbodies was multiplied by the MIR extinction curve to include a silicate emission feature We do not assign any physical interpretation to this fit as it was only used to yield a smooth representation of the average quasar continuum. This smooth continuum was then taken as the intrinsic continuum for the reddening fits to the individual objects.
Figure 4 shows two examples for our fitting procedure, and the derived values for for all objects are given in Table 1. As in the radio galaxy average spectrum, all individual galaxy data longwards of 3 m can be fitted by introducing stronger reddening of a NIR bump (or assuming such a component is absent). In the majority of cases, variations of the screen with other fit parameters are smaller than 0.1. Therefore we assign this value as an uncertainty to the individual screen values.

Silicates appear in absorption in all radio galaxies and, with the exception of 3C 190, in emission in all quasars. Thus the average spectra accurately represent the two populations. Unlike Galactic sources, however, the silicate emission feature in the average quasar spectrum peaks at 11 m. Such a shift in the peak wavelength of the silicate emission is frequently observed in AGNs (e.g. Siebenmorgen et al., 2005; Sturm et al., 2005; Hao et al., 2005; Shi et al., 2006). Under the assumption that the emission is optically thin, the shift can be explained as a result of folding the silicate opacity curve with the (steeply rising) black body curve of the silicate grains (Siebenmorgen et al., 2005). Lower temperatures would then shift the peak of the silicate feature to longer wavelengths. Alternative explanations for the shift of the silicate emission peak wavelength in AGN include variations in the dust grain size distribution (e.g. Sturm et al., 2005), effects from dust chemistry (e.g. Markwick-Kemper et al., 2007; Li et al., 2008), or radiative transfer effects (e.g. Nikutta et al., 2009).
The only quasar not showing silicate emission is 3C 190, which shows a shallow silicate absorption feature instead (Table 1). 3C 190 also has the reddest MIR spectrum of all quasars studied in this paper. Notably, 3C 190 is a compact steep spectrum (CSS: projected linear radio sizes smaller than 15 kpc) source in the radio, a class of objects which may represent young or frustrated sources. This class may show different MIR properties compared to large double-lobed sources (P. Ogle, in preparation). However, the two other CSS sources in our sample (the quasars 3C 186 and 3C 287) appear very similar to the other quasars in their MIR properties, including obvious silicate emission.
The radio galaxy 3C 65 stands out by having a very small value compared to the other radio galaxies. It was also one of the sources where we applied a multiplicative factor to match the spectrum with the higher photometric 24 m flux. As discussed in §2, pointing errors are more likely to cause an overestimate than an underestimate of .
3.2.2 Silicate feature and orientation
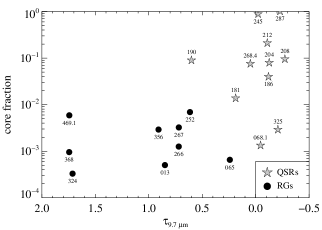
The observed extinctions can be connected with the orientations of the sources by analyzing the radio properties of the objects (Table 1). Due to relativistic beaming effects, the 5 GHz flux of the compact radio core in our objects depends to some extent on the orientation of the radio jet. Therefore the ratio of the radio core flux and the (isotropic) extended flux can be used as an indicator of the approximate inclination of the radio source (e.g., Orr & Browne, 1982). Because the radio jet is thought to be oriented along the polar direction with respect to the obscuring structure, one might expect an anti-correlation between the core fraction and the extinction in the optical and MIR.444We here determine the core fraction as the ratio between the 5 GHz radio core flux (Tab. 1) and the 5 GHz total flux taken from Laing & Peacock (1980). We used the observed fluxes and did not apply a K-correction. This has been demonstrated to be the case from the optical spectra of quasars which show redder continua (and larger Balmer line ratios) with decreasing core fraction (e.g. Baker & Hunstead, 1995). Figure 5 shows the core fraction of our objects as a function of . All sources in this figure with high silicate extinction have weak cores, while most sources with silicate emission show stronger cores. This supports an orientation-based explanation for the differences between the MIR properties of radio galaxies and quasars in the current sample.
3.2.3 Silicate extinction and 15 m luminosity
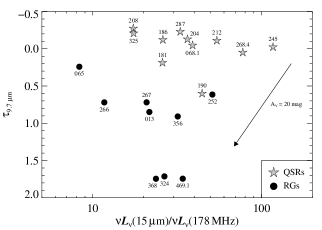
While earlier studies (e.g. Haas et al., 2008) showed that the MIR difference between quasars and radio galaxies is consistent with absorption, the actual amount of absorption was still unknown. This necessary piece of information can be derived from the silicate feature depth. The average spectra in Figure 2 already indicate that radio galaxies are on average less MIR luminous than quasars and that this is consistent with absorption. Figure 6 shows the comparison for individual objects. Quasars and radio galaxies show considerable overlap in their 15 m luminosities, but the depth of the silicate feature separates the two classes almost completely. Radio galaxies occupy a larger range of observed than quasars but with systematically higher values. The striking feature of Figure 6 is that dereddening will match up the radio galaxies with the quasars in both the silicate strength and radio-normalized MIR luminosity.
The characterization of radio galaxies as reddened quasars appears to be in conflict with results at lower redshifts. For objects with strong radio cores, Hes et al. (1995) and Cleary et al. (2007) have proposed that beamed synchrotron emission can make significant contributions even at MIR wavelengths. Cleary et al. (2007) compared the MIR continuum properties of a sample of radio galaxies and quasars also selected from the 3CRR catalogue. They found that, normalized to their 178 MHz luminosities, quasars are on average 4 times more luminous than radio galaxies at (rest) 15 m. Based on SED fitting with a spherically symmetric dust model, Cleary et al. assigned half of this difference to non-thermal emission from a beamed radio core in the quasars while the remaining half was thought to arise from MIR absorption in the radio galaxies. This combination agrees with standard AGN unification schemes.
Except for cases borderline to flat spectrum quasars such as 3C 245, our steep-spectrum objects lack such strong cores, and enhanced MIR emission due to non-thermal radiation seems unlikely. If the MIR continuum flux of the quasars in our sample were enhanced by synchrotron emission, they would lie systematically at higher luminosities than the de-reddened radio galaxies (Fig. 6). Furthermore, we would not expect the reddened quasars to fit the radio galaxies in both continuum level and silicate feature strength without any corrections for non-thermal contributions (Fig. 2). Thus, while a non-thermal component at some level is not entirely ruled out, the results for our sample do not require one.
3.3 Radio-normalized 15 m luminosity
Our data set expands the comparison between low and intermediate redshift (and luminosity) radio sources to more powerful sources. A comparison provides new insight on the luminosity dependence of the radio-normalized 15 m dust emission.
3.3.1 Comparison data
We calculated for our objects as well as for two comparison samples at and at . For the comparison samples, we used all FR-II (Fanaroff & Riley, 1974) radio sources in the 3CRR catalog observed spectroscopically with Spitzer. Spectroscopic MIR data are available for 42 out of 49 sources (86%) at and for 40 out of 60 sources (67%) at . We used data from Ogle et al. (2006), Cleary et al. (2007), and Hardcastle et al. (2009) or retrieved the spectra directly from the Spitzer archive and, after standard data reduction, determined the MIR fluxes. Rest frame radio and MIR luminosities were calculated in the same manner as for our high-redshift sample using observed spectral indices from the 3CRR webpage. Figure 7 shows versus redshift.
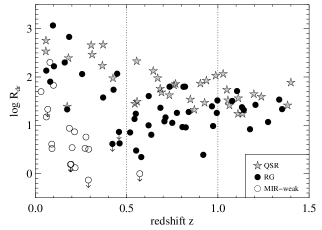
Especially at lower redshift, a population of MIR-underluminous radio galaxies has been found (e.g., Meisenheimer et al., 2001; Shi et al., 2005; Ogle et al., 2006). Such objects also have quite different multi-wavelength properties compared to MIR-luminous radio galaxies (e.g. Buttiglione et al., 2009; Hardcastle et al., 2009), and they may represent a population of radio galaxies with low (radiative) accretion power. We therefore present the statistics below excluding all the “MIR-weak” objects with erg/s (Ogle et al., 2006). This excludes one source at and 17 sources at . All three samples at the different redshifts include a small number of CSS sources. Excluding those sources would not affect the statistics in any significant way.
3.3.2 Luminosity dependence
| sample | number of | |||
|---|---|---|---|---|
| ( in erg s-1 Hz-1) | sources | |||
| QSR: | 7 | |||
| RG: | 11 | |||
| QSR: | 10 | |||
| RG: | 18 | |||
| QSR: | 11 | |||
| RG: | 10 | |||
| QSR: | 8 | |||
| RG: | 8 | |||
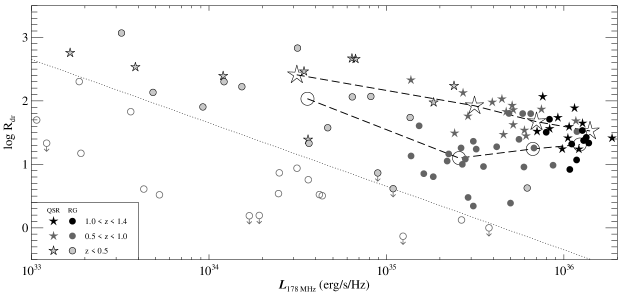
Figure 8 shows as a function of radio luminosity . The most striking features of this figure are:
-
1)
The of quasars decreases steadily with increasing . This decline is seen over almost three orders of magnitude in and over the full redshift range (Fig. 7) covered here.
-
2)
For the radio galaxies (excluding the MIR-weak sources), at low to intermediate decreases similar to the quasars. However, for erg/s/Hz, flattens or even increases towards the highest luminosities. This leads to an apparent convergence of quasars and radio galaxies in the highest luminosity/redshift bin.
In order to quantify these trends, we divided the objects into four luminosity bins in . For each luminosity bin we then calculated the mean and the mean for the radio galaxies and the quasars separately. The results are indicated in Figure 8 and summarized in Table 2. These numbers confirm that the ratio of between radio galaxies and quasars changes with luminosity and that there seems to be a maximum difference at a luminosity of a few times erg/s/Hz, where most sources belong to the intermediate redshift () sample. Because the quasars show a fairly continuous decrease in over all (or ) covered here, the variation in the ratio is probably mostly due to the radio galaxies.
One possible explanation of the trends we observe is that the fraction of the total power emitted by the radio lobes increases with . Because for our flux-limited sample an increase in radio luminosity on average translates into an increase in redshift, one could imagine increased lobe power due to (on average) denser intergalactic environments at higher redshifts. Such effects, however, should apply to radio galaxies and quasars alike and cannot easily explain the upturn for the most luminous radio galaxies.
The apparent decline in Figure 8 could in principle be caused by the simple fact of plotting versus , but this again would not explain the rising for the most luminous radio galaxies. Therefore we assume that there is a real physical effect dependent on luminosity and differing for quasars and radio galaxies.
One example of a possible physical effect is that the dust covering angle may be reduced at high luminosities, for example by destroying dust or pushing it farther away from the nucleus. This would be consistent with the receding-torus model (e.g. Lawrence, 1991). A decline of with luminosity is expected in such a model if the height of the torus remains constant. However, the height could be blown up by, for instance, accompanying starbursts, and this could also be correlated with luminosity (Haas et al., 2004). But even in this picture the behaviour in for the most luminous radio galaxies remains a puzzle.
An alternative explanation could involve the effects of additional absorption of the radio galaxies’ 15 m continuum emission by dust in the host galaxy, but outside the torus. A high dust column density in the host would be required for such behavior. In a situation where the dust (including the torus) is pushed to larger radii due to the increased luminosity of the nucleus, the line-of-sight dust column density in the host might become too small to make significant contributions to the total absorption of the continuum emission. Mid- and far-IR observations of the optically-selected, mostly radio quiet Palomar-Green (PG) quasars indicate that the cold end of the dust temperature distribution of the most luminous PG quasars at is surprisingly warm compared with PG quasars of low and intermediate luminosity (Haas et al., 2003). This suggests that the amount of colder dust in these (hyper)-luminous IR sources is relatively small and that the AGN effectively heats much of the host galaxy’s dust. If this scenario applies for our high- 3CRR radio galaxies as well, then the total line-of-sight dust column density may be too small to be able to absorb as much as one would expect from a scaled-up version of lower-luminosity AGNs, which are located in hosts relatively richer in dust. In other words, if the AGN power relative to the host’s dust mass exceeds a critical threshold, the maximum possible extinction declines, hence the ratio of (QSR)/(RG) declines as well.
Most likely there will not be a single explanation for the observed trends but a combination of effects will have to be considered. Additional insights may come from extending the luminosity range by including Herschel observations of the highest redshift 3CRR sources, or by including further constraints from a Chandra X-ray study of the present sample (B. Wilkes, in preparation).
3.4 Emission Lines
Four prominent emission lines can be identified in the average spectra (Figure 2): the low ionization [Ne II] line, the medium ionization species [S IV] and [Ne III], and the high ionization AGN tracer [Ne V]. We determined emission-line fluxes only from the average spectra, but their uncertainties still are large. This is for two reasons. The individual spectra in which emission lines can be identified show a wide range of emission-line equivalent widths for each type of object. This dispersion among individual objects leads to considerable uncertainty for the line fluxes in the average spectra. In addition, the measured emission-line fluxes in the average spectra depend strongly on the placement of the continuum. Especially for weak or noisy features on top of a complex continuum, this results in large errors. For these reasons, conclusions from the emission lines should be considered tentative. With these caveats in mind, within the uncertainties the emission line ratios for radio galaxies and quasars are similar. Moreover the line luminosities are comparable as well (Table 3).
| [S IV] | [Ne II] | [Ne V] | [Ne III] | |
|---|---|---|---|---|
| 10.5 m | 12.8 m | 14.3 m | 15.5 m | |
| QSRs | 2.5 | 1.2 | 1.9 | 4.6 |
| RGs | 2.2 | 1.5 | 1.6 | 4.2 |
The spectra cover the position of the 11.3 m PAH feature, but this star formation tracer was not detected in the average spectra. This suggests that the MIR emission in our objects is strongly dominated by the AGN and that any contributions from star formation are small compared to AGN emission. 3CR radio sources at also have less star formation than optically or NIR selected radio-quiet QSOs at comparable redshifts (Shi et al., 2007). In fact, in most lower-redshift 3CR sources, PAH features remain undetected. This is consistent with the finding that many of the radio sources are hosted by rather quiescent elliptical galaxies (e.g., Floyd et al., 2008).
4 Conclusions
The 3CRR sample at represents the most radio-luminous steep-spectrum quasars and double-lobed radio galaxies for which the rest-frame MIR 9–16 m wavelength range is accessible with the Spitzer Infrared Spectrograph. The sample is unbiased with respect to orientation.
-
1)
The quasar SEDs are very similar to each other in shape. They show a strong NIR and MIR continuum, silicates in emission, and an emission bump at 2–5 m.
-
2)
The mean radio galaxy spectrum ( m) is consistent with a quasar spectrum reddened by a dust screen of mag both in spectral shape and in flux level.
-
3)
Radio galaxy extinctions indicated by their 2–5 m SEDs are higher than the extinction derived from the silicate absorption and the (rest) 15 m flux. This can be explained if the component responsible for the NIR bump in the quasar SED suffers more extinction than the MIR emission.
-
4)
All sources in our sample with silicate absorption have small core fraction (), while objects with silicate emission often show stronger cores. This strongly supports the idea that the observed extinction in our sample is related to the orientation of the source.
-
5)
The average spectra show similar emission-line ratios for radio galaxies and quasars, and no PAH features are detected. This argues in favor of similar intrinsic AGN power and star-forming activity in quasars and radio galaxies, as predicted by unified schemes.
-
6)
The comparison of our high- sample with lower redshift 3CRR sources reveals a steady decline of the quasar with increasing luminosity, and a partial decline, followed by a high-luminosity upturn, of the radio galaxies’ . Possible explanations for these trends may involve an increased fraction of power emitted by the radio lobes due to different galactic environments at higher and/or different dust geometries due to the higher nuclear luminosities (e.g distance of the dust from the nucleus, solid angle of the dust exposed to the radiation, or total dust column density on the line of sight).
While the MIR spectra provide valuable insight into the nature of the MIR emission and the relation between the most powerful type-1 and type-2 radio AGN, we expect further constraints from Chandra X-ray and Herschel far infrared/sub-mm observations of this sample.
References
- Aars et al. (2005) Aars, C. E., Hough, D. H., Yu, L. H., Linick, J. P., Beyer, P. J., Vermeulen, R. C., & Readhead, A. C. S. 2005, AJ, 130, 23
- Akujor et al. (1991) Akujor, C. E., Spencer, R. E., Zhang, F. J., Davis, R. J., Browne, I. W. A., & Fanti, C. 1991, MNRAS, 250, 215
- Antonucci & Miller (1985) Antonucci, R.; Miller, J. S. 1985, ApJ, 297, 621
- Antonucci (1993) Antonucci, R. 1993, ARA&A, 31, 473
- Baker & Hunstead (1995) Baker, J. C., & Hunstead, R. W. 1995, ApJ, 452, L95
- Barthel (1989) Barthel, P. D. 1989, ApJ, 336, 606
- Barvainis (1987) Barvainis, R. 1987, ApJ, 320, 537
- Best et al. (1997) Best, P. N., Longair, M. S., & Roettgering, J. H. A. 1997, MNRAS, 292, 758
- Best et al. (1998) Best, P. N., Carilli, C. L., Garrington, S. T., Longair, M. S., & Rottgering, H. J. A. 1998, MNRAS, 299, 357
- Bridle et al. (1994) Bridle, A. H., Hough, D. H., Lonsdale, C. J., Burns, J. O., & Laing, R. A. 1994, AJ, 108, 766
- Buttiglione et al. (2009) Buttiglione, S., Capetti, A., Celotti, A., Axon, D. J., Chiaberge, M., Macchetto, F. D., & Sparks, W. B. 2009, A&A, 495, 1033
- Chambers et al. (1987) Chambers, K. C., Miley, G. K., & van Breugel, W. 1987, Nature, 329, 604
- Chiar & Tielens (2006) Chiar, J. E., & Tielens, A. G. G. M. 2006, ApJ, 637, 774
- Cimatti et al. (1993) Cimatti, A., di Serego-Alighieri, S., Fosbury, R. A. E., Salvati, M., & Taylor, D. 1993, MNRAS, 264, 421
- Cimatti et al. (1997) Cimatti, A., Dey, A., van Breugel, W., Hurt, T., & Antonucci, R. 1997, ApJ, 476, 677
- Cleary et al. (2007) Cleary, K., Lawrence, C. R., Marshall, J. A., Hao, L., & Meier, D. 2007, ApJ, 660, 117
- Edelson & Malkan (1986) Edelson, R. A., & Malkan, M. A. 1986, ApJ, 308, 59
- Elitzur (2008) Elitzur, M. 2008, New Astronomy Review, 52, 274
- Elvis et al. (1994) Elvis, M., et al. 1994, ApJS, 95, 1
- Fanaroff & Riley (1974) Fanaroff, B. L. & Riley, J. M. 1974, MNRAS, 167, 31
- Fernini et al. (1997) Fernini, I., Burns, J. O., & Perley, R. A. 1997, AJ, 114, 2292
- Floyd et al. (2008) Floyd, D. J. E., et al. 2008, ApJS, 177, 148
- Gallagher et al. (2007) Gallagher, S. C., Richards, G. T., Lacy, M., Hines, D. C., Elitzur, M., & Storrie-Lombardi, L. J. 2007, ApJ, 661, 30
- Grimes et al. (2005) Grimes, J. A., Rawlings, S., & Willott, C. J. 2005, MNRAS, 359, 1345
- Haas et al. (2003) Haas, M., et al. 2003, A&A, 402, 87
- Haas et al. (2004) Haas, M., et al. 2004, A&A, 424, 531
- Haas et al. (2005) Haas, M.; Siebenmorgen, R.; Schulz, B.; Krügel, E.; Chini, R. 2005, A&A, 442, L39
- Haas et al. (2008) Haas, M., Willner, S. P., Heymann, F., Ashby, M. L. N., Fazio, G. G., Wilkes, B. J., Chini, R., & Siebenmorgen, R. 2008, ApJ, 688, 122
- Hardcastle et al. (2009) Hardcastle, M. J., Evans, D. A., & Croston, J. H. 2009, MNRAS, 396, 1929
- Hao et al. (2005) Hao, L., et al. 2005, ApJ, 625, L75
- Hes et al. (1995) Hes, R., Barthel, P. D., & Hoekstra, H. 1995, A&A, 303, 8
- Houck et al. (2004) Houck, J. R., Roellig, T. L., van Cleve, J., Forrest, W. J., Herter, T., Lawrence, C. R., Matthews, K., et al. 2004, ApJS, 154, 18
- Hönig et al. (2006) Hönig, S. F., Beckert, T., Ohnaka, K., & Weigelt, G. 2006, A&A, 452, 459
- Indebetouw et al. (2005) Indebetouw, R.; Mathis, J. S.; Babler, B. L.; et al. 2005, ApJ, 619, 931
- Laing & Peacock (1980) Laing, R. A., & Peacock, J. A. 1980, MNRAS, 190, 903
- Laing et al. (1983) Laing, R. A., Riley, J. M., & Longair, M. S. 1983, MNRAS, 204, 151
- Lawrence (1991) Lawrence, A. 1991, MNRAS, 252, 586
- Levenson et al. (2007) Levenson, N. A., Sirocky, M. M., Hao, L., Spoon, H. W. W., Marshall, J. A., Elitzur, M., & Houck, J. R. 2007, ApJ, 654, L45
- Li et al. (2008) Li, M. P., Shi, Q. J., & Li, A. 2008, MNRAS, 391, L49
- Liu et al. (1992) Liu, R., Pooley, G., & Riley, J. M. 1992, MNRAS, 257, 545
- Lüdke et al. (1998) Lüdke, E., Garrington, S. T., Spencer, R. E., Akujor, C. E., Muxlow, T. W. B., Sanghera, H. S., & Fanti, C. 1998, MNRAS, 299, 467
- Mantovani et al. (1992) Mantovani, F., Junor, W., Fanti, R., Padrielli, L., Browne, I. W. A., & Muxlow, T. W. B. 1992, MNRAS, 257, 353
- Mathis et al. (1983) Mathis, J. S., Mezger, P. G., & Panagia, N. 1983, A&A, 128, 212
- Markwick-Kemper et al. (2007) Markwick-Kemper, F., Gallagher, S. C., Hines, D. C., & Bouwman, J. 2007, ApJ, 668, L107
- McCarthy et al. (1987) McCarthy, P. J., van Breugel, W., Spinrad, H., & Djorgovski, S. 1987, ApJ, 321, L29
- Meisenheimer et al. (2001) Meisenheimer, K., Haas, M., Müller, S. A. H., Chini, R., Klaas, U., & Lemke, D. 2001, A&A, 372, 719
- Mor et al. (2009) Mor, R., Netzer, H., & Elitzur, M. 2009, ApJ, 705, 298
- Nenkova et al. (2008) Nenkova, M., Sirocky, M. M., Nikutta, R., Ivezić, Ž., & Elitzur, M. 2008, ApJ, 685, 160
- Nikutta et al. (2009) Nikutta, R., Elitzur, M., & Lacy, M. 2009, ApJ, 707, 1550
- Nishiyama et al. (2009) Nishiyama, S., Tamura, M., Hatano, H., Kato, D., Tanabé, T., Sugitani, K., & Nagata, T. 2009, ApJ, 696, 1407
- Ogle et al. (2006) Ogle, P., Whysong, D., & Antonucci, R. 2006, ApJ, 647, 161
- Orr & Browne (1982) Orr, M. J. L., & Browne, I. W. A. 1982, MNRAS, 200, 1067
- Pearson et al. (1985) Pearson, T. J., Readhead, A. C. S., & Perley, R. A. 1985, AJ, 90, 738
- Pedelty et al. (1989) Pedelty, J. A., Rudnick, L., McCarthy, P. J., & Spinrad, H. 1989, AJ, 98, 1232
- Reid et al. (1995) Reid, A., Shone, D. L., Akujor, C. E., Browne, I. W. A., Murphy, D. W., Pedelty, J., Rudnick, L., & Walsh, D. 1995, A&AS, 110, 213
- Rieke & Lebofsky (1985) Rieke, G. H., & Lebofsky, M. J. 1985, ApJ, 288, 618
- Rieke et al. (2004) Rieke, G. H., et al. 2004, ApJS, 154, 25
- Riffel et al. (2009) Riffel, R. A., Storchi-Bergmann, T., & McGregor, P. J. 2009, ApJ, 698, 1767
- Rodríguez-Ardila & Mazzalay (2006) Rodríguez-Ardila, A., & Mazzalay, X. 2006, MNRAS, 367, L57
- Saikia et al. (1990) Saikia, D. J., Junor, W., Cornwell, T. J., Muxlow, T. W. B., & Shastri, P. 1990, MNRAS, 245, 408
- Shi et al. (2005) Shi, Y., et al. 2005, ApJ, 629, 88
- Shi et al. (2006) Shi, Y., et al. 2006, ApJ, 653, 127
- Shi et al. (2007) Shi, Y., et al. 2007, ApJ, 669, 841
- Siebenmorgen et al. (2004) Siebenmorgen, R., Freudling, W., Krügel, E., & Haas, M. 2004, A&A, 421, 129
- Siebenmorgen et al. (2005) Siebenmorgen, R., Haas, M., Krügel, E., & Schulz, B. 2005, A&A, 436, L5
- Singal (1993) Singal, A. K. 1993, MNRAS, 262, L27
- Spinrad et al. (1985) Spinrad, H., Marr, J., Aguilar, L., & Djorgovski, S. 1985, PASP, 97, 932
- Sturm et al. (2005) Sturm, E., et al. 2005, ApJ, 629, L21
- Urry & Padovani (1995) Urry, M. & Padovani, P. 1995, PASP, 107, 803
- van Bemmel et al. (2000) van Bemmel, I. M., Barthel, P. D., & de Graauw, T. 2000, A&A, 359, 523
- van der Wolk et al. (2010) van der Wolk, G., Barthel, P. D., Peletier, R. F., & Pel, J. W. 2010, A&A, 511, 64
- Vernet et al. (2001) Vernet, J., Fosbury, R. A. E., Villar-Martín, M., Cohen, M. H., Cimatti, A., di Serego Alighieri, S., & Goodrich, R. W. 2001, A&A, 366, 7
- Werner et al. (2004) Werner, M. W., Roellig, T. L., Low, F. J., Rieke, G. H., Rieke, M., Hoffmann, W. F., Young, E., et al. 2004, ApJS, 154, 1