Photo-induced insulator-metal transition of a spin-electron coupled system
Abstract
The photo-induced metal-insulator transition is studied by the numerical simulation of real-time quantum dynamics of a double-exchange model. The spatial and temporal evolutions of the system during the transition have been revealed including (i) the threshold behavior with respect to the intensity and energy of light, (ii) multiplication of particle-hole (p-h) pairs by a p-h pair of high energy, and (iii) the space-time pattern formation such as (a) the stripe controlled by the polarization of light, (b) coexistence of metallic and insulating domains, and (c) dynamical spontaneous symmetry-breaking associated with the spin spiral formation imposed by the conservation of total spin for small energy-dissipation rates.
pacs:
PACS numbers: 71.10.-w, 71.10.Fd, 78.20.BhChanges of electronic states induced by the photo-irradiation have been the subject of intensive studies in chemistry, biology and physics. For example, the photo-induced chemical reactions in molecules are the basis of many biological functions. In solids, the structural changes induced by the absorption of photons and the relaxation after it are a common phenomenon Toyozawa . In particular, in correlated electrons such as the transition metal oxides, the collective nature of the system enhances the sensitivity to the external stimuli including photons, and hence even the weak photo-irradiation can trigger the changes of whole system as the phase transition spincross ; munekata ; koshihara ; miyano ; fiebig . This is because in strongly correlated electronic systems, the rich phases of spin/charge/orbital orderings with nearly degenerate energies compete with each other Imada . For example, in the case of manganites, colossal magneto-resistance effect occurs because the weak external magnetic field drives a transition from the insulating charge/spin/orbital ordered state to the ferromagnetic metallic state Tokura , and similar transition can be triggered also by the photo-irradiation miyano .
In contrast to these ample examples of photo-induced phase transitions, the theoretical studies are still in the premature stage. Although a classical model for the photo-induced phase transition has been proposed NagaosaOgawa , the quantum theory of photo-induced dynamics of correlated electrons are limited to small size systems or to one-dimensional systems matsueda1 ; matsueda2 ; yonemitsu . Recently, we have proposed a model for the real-time quantum dynamics of correlated electrons, i.e., a double exchange model deGennes where the electrons are interacting with the classical spins, to simulate the relaxation after the photo-excitation kfn . In that work, we have developed a theoretical method for the fully quantum-mechanical time-evolution of electronic wavefunction combined with the Landau-Lifshitz-Gilbert (LLG) equation for classical spins, which enables the analysis of the larger-scale/higher-dimensional systems. By that theoretical study, the self-organized space-time structure induced by the quantum transitions during the relaxation has been revealed kfn .
In this paper, we present the real-time quantum dynamics of the photo-induced insulator-to-metal (IM) transition for a generalized double exchange model showing the competing antiferromagnetic insulating (AFI) and ferromagnetic metallic (FM) states separated by the first-order phase boundary. Many unexplored issues can be addressed in this model, i.e, the threshold behavior with respect to the intensity/energy of light, the effect of the polarization of light, space-time pattern formation during the transition, the role of the conservation of total spins, and the asymmetry between the two directions of the transition.

We start with the Hamiltonian,
| (1) | |||||
where denotes a nearest-neighbor pair, and are indices for electron spin, respectively, and are Pauli matrices. The local spins, ’s, are taken to be classical vectors with magnitude , and other notations are standard. We consider the half-filled case, i.e., one electron per site. In Eq.(1), we have introduced the biquadratic exchange interaction with coupling constant , which gives an energy barrier between ferromagnetic (F) and antiferromagnetic (AF) states when is negative.
Figure 1(a) shows the ground state phase diagram of the model Eq. (1) on the two-dimensional square lattice, in the plane of and with fixed = in units of . The solid curve indicates the boundary of first-order phase transition. In the right side, the antiferromagnetic spins open a gap and the system is insulating. In the left side, the spins are perfectly or almost ferromagnetic. In the ferromagnetic state, the system is metallic, but the small staggered component opens a small gap for foot . The phase transition at 1.2 (broken line) is of the continuous second order.
Let us focus on the boundary of first-order phase transition. Figure 1(b) shows the energy as a function of the angle between the sublattice spin directions for size system in periodic boundary condition with a parameter set, =1, =1, =, =, =1. This condition is used hereafter. The AF state and the F state, respectively given by and 0, are almost degenerate, and show the local stabilities with the potential barrier between them.
We introduce the Landau-Lifschitz-Gilbert (LLG) equation for the motion of the local spins, where with being the electronic wavefunction of a Slater determinant at time obtained by solving the Schrödinger equation as discussed in Ref. kfn . The Gilbert damping constant describes all the other relaxation processes of the spins than the coupling to the conduction electrons.
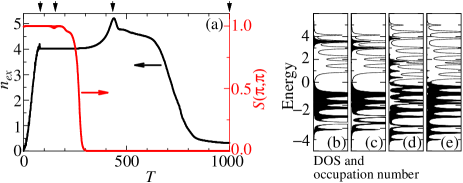
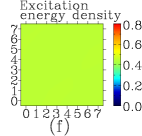
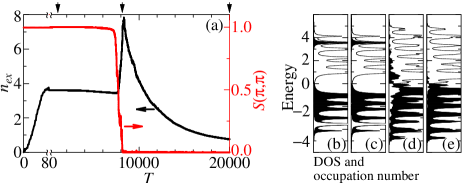
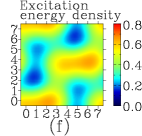
Figure 2 shows time-evolution of the photo-excited electronic state and its relaxation dynamics for . The unit of time is and hence is typically sec assuming eV. We start with the AFI state, i.e., the electronic state has an insulating energy-gap and lower energy band is occupied by electrons and the upper energy band is empty at . In order to mimic the thermal fluctuation, we introduce a random tilting of each spin from the perfect AF configuration up to 0.1 rad which corresponds to the state with an excitation energy of from the ground state. The photo-excitation is achieved by introducing the time-dependent vector potential into the hopping matrix element: for the nearest-neighbor pair in -direction, we use where the phase of the hopping matrix element is given by the vector potential. In the early stage, , we have applied in this simulation. The frequency is tuned for the energy difference between the second highest and the second lowest energy levels of the AF state on the finite size system. The particles are excited from lower to upper energy band (see Fig. 2(a)) and the particle-hole (p-h) pairs are created on the second highest and the second lowest energy levels (see Fig. 2(b)). In the excited state, the spatial distribution of excitation energy is uniform as seen in Fig.2(f). At , total amount of the excited electron is about 4, and after that, .

|
|
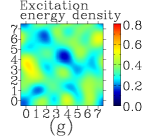
Up to , the local-spin structure is almost AF one, so that the density of states (DOS) hardly changes as shown by thin lines in Fig. 2(b) and (c). However, the electronic state has been changed dramatically, i.e., the electron occupation shows a time evolution and the spatial distribution of excitation energy forms a stripe pattern as seen in Figs. 2(c) and (g). Correspondingly, the transverse component of the local-spins shows a dynamical pattern as in Fig. 2(j). During the photo-excitation by the light polarized in direction, the electrons are accelerated along the direction. The polarized motion of electrons derives a deformation of the local-spin structure to be favorable for the electron motion. The characteristics of the relaxation dynamics appear in the stripe pattern as seen in Fig. 2(g) reflecting the wave function and the spatial distribution of the excited p-h pairs.
In the period , the system shows a drastic change, that is, AFI to FM transition. For , the spin-structure-factor is almost 1, and we clearly see the insulating energy-gap between upper and lower energy bands, i.e., the system is the (excited) AFI. For , on the other hand, is almost 0, and the gap closes. In fact, the energy level structure is very close to that of the tight-binding Hamiltonian for free-electrons with a Zeeman splitting. (The sparse energy level distribution around zero in energy axis is due to the finite-size effect.) As seen in Fig. 2(k), the local-spin becomes the F state corresponding to the metallic electronic-states. The electrons, however, remain still highly excited. As seen in Figs. 2(a) and (d), the total number of excited electrons above Fermi level increases and shows a peak at . After that, it decreases but is as large as the number of initially excited electrons, up to . On the other hand, it has been confirmed that the total energy of the system, i.e., the electrons and the local spins, decreases monotonically due to the Gilbert damping.
The enhancement of the total number of excited electrons above Fermi level is due to the Auger process. This is a characteristics of the interacting electron systems, and is in sharp contrast to the relaxation dynamics of conventional semiconductors which physics is well described by the single carrier problem. This multiplication of p-h pairs during the relaxation dynamics offers an interesting possibility to enhance the photo-current generation and solar cell reaction.
|
This AFI-to-FM transition, however, does not occur when the excitation is not strong enough. For the results shown in Fig. 2, the photo-excitation has been done in the early stage, , with . By decreasing the period , we can reduce the number of the p-h pairs by the photo-excitation . We find that the IM transition hardly occurs for 2, in the present numerical condition.
We have also examined the frequency dependence for the IM transition. In the case that , the threshold of the IM transition is lying on in the numerical simulations. Although the IM transition occurs even in this case, we do not find the Auger process. Comparison with the above case of , it is concluded that the higher energy photon is more effective to induce the IM transition through the Auger process.
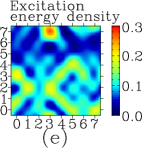
When is close to the threshold, we find the coexistence of the insulating and metallic domains. The results for and are summarized in Fig. 3. The local-spin state changes gradually in a long time period, 150 1100 (see the time dependence of in Fig. 3(a)). A long time later, the AF (blue) and F (yellow) domains are spatially separated as seen in Fig. 3 (d), and the corresponding excitation energy density is shown in Figs. 3 (e). The energy levels and occupation numbers before and after the transition are shown in Figs. 3(b) and (c), respectively. The residual p-h pairs in Fig. 3 (c) are confined in the F metallic domain, so that the electronic state form a slightly higher energy density region on the F domain and the stable AFI domain (see Figs. 3(d) and (e)). This meta-stable state continues for a long time within our simulation (at least up to ).
|

|
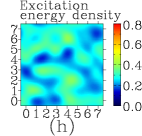
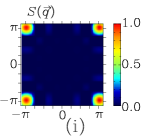
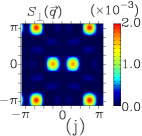
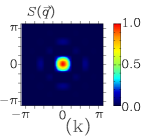
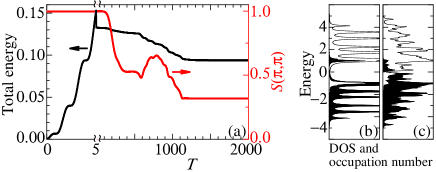
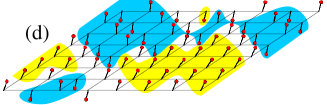
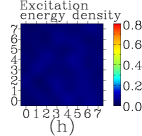
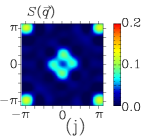
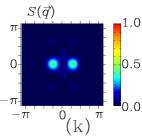
We have also studied the more realistic case of =0.01 (Fig. 4). Other parameters are the same with the case shown in Fig. 2. Due to the reduced relaxation rate, it takes much longer time for whole relaxation dynamics compared with that in Fig. 2. Despite the reduced relaxation rate, the real-time dynamics of the electronic and local-spin states is not silent and is rather active. During the relaxation dynamics, the direction of the staggered magnetization changes drastically. And the spatial inhomogeneity of the electronic state has also been developed (see Fig. 4(f)). The slow energy relaxation is advantageous for the Auger process resulting in the large amount of p-h pair creation at when the gap closing occurs (see Fig. 4(a)). At this transition, all the local-spins play very active dynamics with developing spatial inhomogeneity of the electronic state (see Fig. 4(g)). The change of spin configuration from AF state is clearly seen in the equal-time spin-structure-factor shown in Figs. 4(a) and (j): The intensity at becomes small and that at around the center region is grown. Near the center, there exist four spots, and two of them disappear later on in the time evolution. Finally, a spiral spin-structure is obtained in this case (see Fig. 4(k)). Due to the Gilbert damping , the total spin-angular-momentum can change in the relaxation dynamics. For large the spin state can be easily changed from AF to F as in Fig. 2(g) but not for small because the conservation law becomes effective. Therefore, the ferromagnetic state is avoided and the spiral spin configuration appears characterized by the equal-time spin-structure-factor shown in Fig. 4(k). In the present case, the propagation vector of the spiral spin-state is in direction. This is the dynamical symmetry breaking, and the direction ( in this particular case) is chosen by the accidental reason while the memory of the polarization of photo-excitation ( direction) has been already lost.
So far, we have discussed the AFI-to-FM transition. As shown in Fig. 1(b), FM and AFI states are almost degenerate, so that FM-to-AFI transition of this system is worth to be examined. In the F state, however, the excitation with is prohibited. Therefore, we have prepared the initial excited-state within F state by putting the initial electron occupation by ”hand”. Although we have examined a number of numerical simulations, metal-to-insulator transition has not been obtained. The numerical results suggest that metal-to-insulator transition is much more difficult than insulator-to-metal transition in the present model.
In summary, we have studied the insulator-to-metal transition by the photo-irradiation in a model of competing AF and F states. (i) The threshold behavior with respect to the intensity and energy of lights, (ii) Auger process, i.e., multiplication of particle-hole (p-h) pairs by a p-h pair of high energy, (iii) the space-time pattern formation including the stripe controlled by the polarization of light, and (iv) the intriguing spin spiral state by the conservation of total spin for weak Gilbert damping have been revealed. The photo-carrier generation under the external electric field and its implications to the solar cell reaction are the issues left for future studies.
The authors are grateful to Y. Tokura, M. Kawasaki, H. Matsueda, T. Tohyama, S. Ishihara, and K. Tsutsui for useful discussions. This work is supported by Grant-in-Aid for Scientific Research (Grant No. 19048015, 19048008, 17105002, 21244053, and 21360043) and a High-Tech Research Center project for private universities from the Ministry of Education, Culture, Sports, Science and Technology of Japan, Next Generation Supercomputing Project of Nanoscience Program, JST-CREST and NEDO. N.N. is supported also by Strategic International Cooperative Program (Joint Research Type) from JST, and Funding Program for World-Leading Innovative R D on Science and Technology (FIRST Program).
References
- (1) Y. Totozawa, Optical Processes in Solids (Cambridge University Press, 2003).
- (2) Y. Ogawa et al., Phys. Rev. Lett. 84, 3181 (2000).
- (3) Y. Mitsumori et al., Phys. Rev. B 69, 033203 (2004).
- (4) S. Koshihara et al., Phys. Rev. Lett. 78, 4617 (1997).
- (5) K. Miyano et al., Phys. Rev. Lett. 78, 4257 (1997).
- (6) M. Fiebig et al., Science 280, 1925 (1998).
- (7) M.Imada, A. Fujimori, and Y. Tokura, Rev. Mod. Phys. 70, 1039 (1998).
- (8) Y. Tokura, Rep. Prog. Phys. 69, 797 (2006).
- (9) N. Nagaosa and T. Ogawa, Phys. Rev. B 39, 4472 (1989).
- (10) H. Matsueda et al., Phys. Rev. B 77, 193112 (2008).
- (11) Y. Kanamori, H. Matsueda and S. Ishihara, Phys. Rev. Lett. 103, 267401 (2009).
- (12) K. Yonemitsu and N. Maeshima, Phys. Rev. B 79, 125118 (2009).
- (13) P.-G. de Gennes, Phys. Rev. 118, 141 (1960).
- (14) W. Koshibae, N. Furukawa, and N. Nagaosa, Phys. Rev. Lett. 103, 266402 (2009).
- (15) For , the system is insulating since the energy bands for up and down spin split into two bands separated by a gap in F state.