Sideways displacement of penumbral fibrils by the solar flare on 2006 December 13
Abstract
Flares are known to restructure the magnetic field in the corona and to accelerate the gas between the field lines, but their effect on the photosphere is less well studied. New data of the Solar Optical Telescope (SOT) onboard Hinode provide unprecedented opportunity to uncover the photospheric effect of a solar flare, which associates with an active region NOAA AR 10930 on 2006 December 13. We find a clear lateral displacement of sunspot penumbral regions scanned by two flare ribbons. In the impulsive phase of the flare, the flare ribbons scan the sunspot at a speed of around 18 km s-1, derived from Ca II and G-band images. We find instantaneous horizontal shear of penumbral fibrils, with initial velocities of about 1.6 km s-1, produced when a flare ribbon passes over them. This velocity decreases rapidly at first, then gradually decays, so that about one hour later, the fibrils return to a new equilibrium. During the one hour interval, the total displacement of these fibrils is around 2.0 Mm, with an average shear velocity of 0.55 km s-1. This lateral motion of the penumbral fibrils indicates that the magnetic footpoints of these field lines being rearranged in the corona also move.
1 INTRODUCTION
Solar flares are one of the most spectacular phenomena in solar physics, and quickly release magnetic energy stored in the corona in a short time. Flare-associated changes in the magnetic field are fundamental, and of importance in the general physics of magnetic energy storage and explosive release. These changes in photospheric magnetic fields largely include two topics: long-term changes before the flare and short-term changes during the flare, among which the short-term changes mean magnetic changes that occur on the flare time-scale (Zhao et al., 2009). The rapid short-term magnetic field changes in the course of flares was first reported by Patterson & Zirin (1981). However, Patterson (1984) later recognized that the reported magnetic transients were not real changes in the magnetic field but could be explained by transient emission of the Fe I 5324 Å line which was used to produce the magnetograms. Qiu & Gary (2003) provided a scenario that the observed transient polarity reversal in MDI magnetograms is likely to be produced by distorted measurements when the Ni I 6768 Å line comes into emission or strong central reversal as a result of non-thermal beam impact on the atmosphere in regions of strong magnetic fields. They called this transient polarity reversal as magnetic “anomaly”.
On the other hand, Kosovichev & Zharkova (1999) detected rapid variations of the photospheric magnetic field during an X-class flare in AR 8210 on 1998 May 2, and Cameron & Sammis (1999) found a significant change in the longitudinal magnetic fields in NOAA AR 6063 during an X9.3 flare. Sudol & Harvey (2005) further presented new evidence of longitudinal magnetic field changes accompanying 15 X-class flares. Associated with Bastille Day flare/CME event (Zhang et al., 2001), Kosovichev & Zharkova (2001) detected two types of rapid magnetic changes : irreversible changes and magnetic transients. Recently, Wang et al. (2004) and Deng et al. (2005) found penumbral decay and neighboring umbral core darkening rapidly right after the flares. Liu et al. (2005) further studied this type of short-term evolution of sunspot structure associated with seven major flares, and proposed accordingly a reconnection picture to interpret the findings. Moreover, Chen et al. (2007) found that the rapid and permanent structural changes are evidenced in the time profile of white light mean intensity and are not likely resulted from flare emission. In addition, Wang et al. (2009) and Zhao et al. (2009) discovered rapid, significant and persistent changes and flare induced signals in polarization measurements during flare events.
Here, we report on observations from Hinode spacecraft of sideways displacement of penumbral fibrils driven by a solar flare on Dec. 13, 2006. This displacement carries potentially interesting information about the flare induced variations of the magnetic fields and sunspots.
2 OBSERVATIONS AND ANALYSIS
Active region NOAA AR 10930 displayed the evolution of a complex magnetic structure, surrounded by many small dark pores and bright magnetic faculae (Zhang et al., 2007; Li & Zhang, 2009). Images of the X3.4 flare related to the active region on December 13, 2006, were obtained by the Solar Optical Telescope (SOT, Tsuneta et al., 2008) onboard Hinode in two spectral filters: the molecular line G-band and Ca II H. In each filter the images were obtained every 2 minutes, and the pixel size of the 20481024 images was 0.11 arcsec.
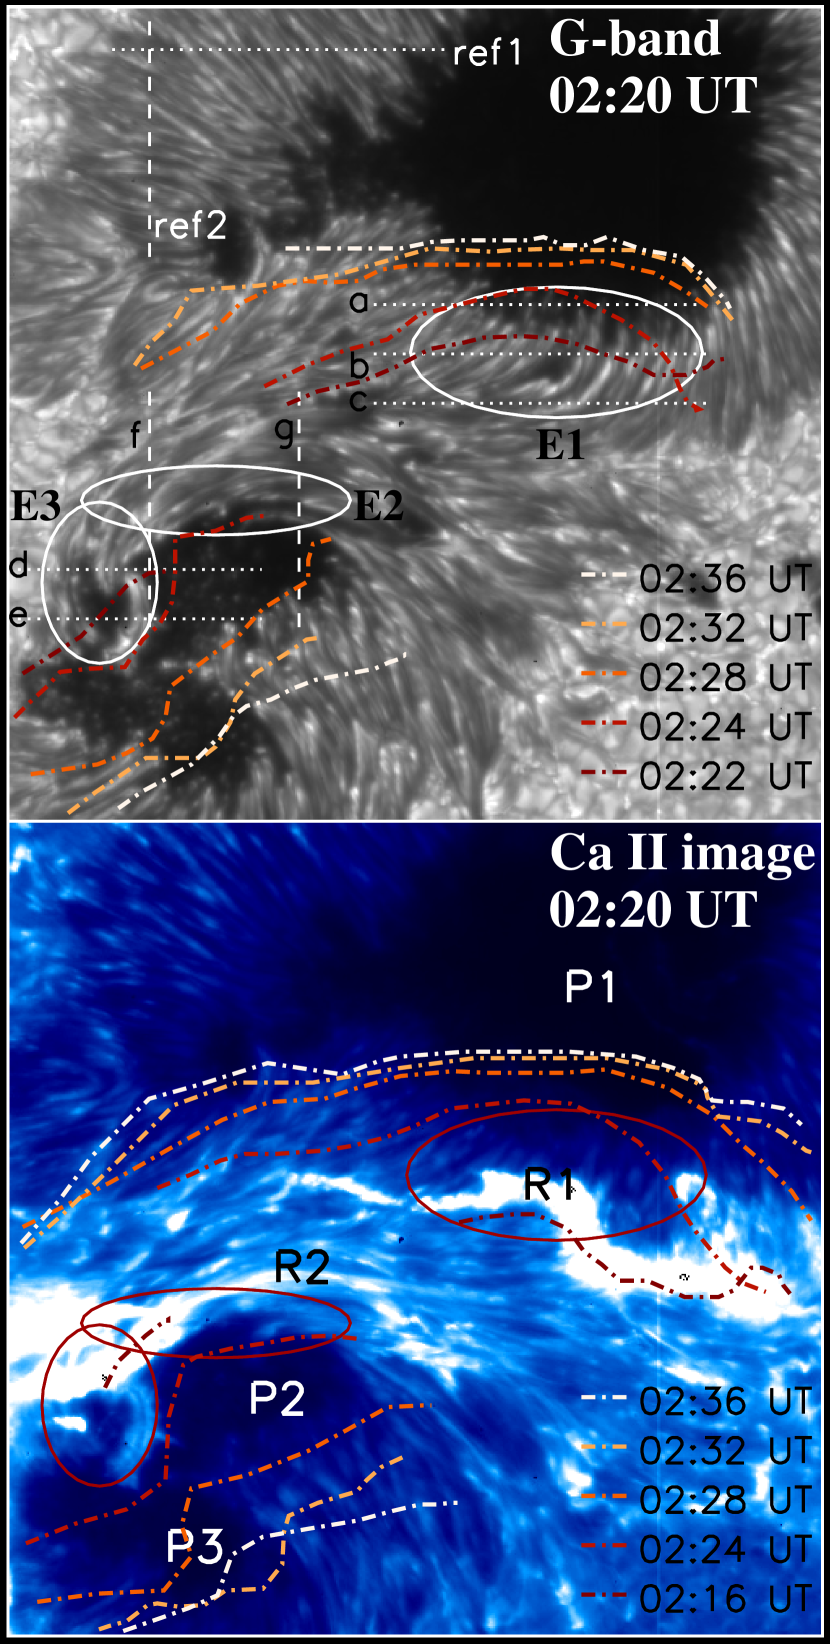
A first signature of the flare appeared in the Ca II H images at about 2:08 UT between two sunspots with the opposite magnetic polarity (Kosovichev & Sekii, 2007). The energy release was probably triggered by strong shearing flows around the following sunspot (Zhang et al., 2007). The flare emission quickly extended during the next 10 min, forming a two-ribbon structure. Figure 1 displays a G-band (top) and a co-temporal Ca II image (bottom) from Hinode/SOT. The three ellipses ‘E1’, ‘E2’ and ‘E3’ outline the flare-affected regions determining from time slice maps, and overplotted on the Ca II image. The dash-dotted curves represent the leading edge of the two ribbons at different times. At 02:22 UT, the two flare ribbons (R1 and R2) first became visible in the G-band images, indicating that the perturbation extends into the photosphere. R1 moved laterally across the penumbra of the sunspot P1 with a velocity of 18 km -1 in the first 2 minutes, after which its horizontal propagation velocity decreased rapidly. The ribbons on the Ca II images first appeared at 02:16 UT, 6 minutes earlier than on the G-band. From 02:16 to 02:20 UT, the apparent motion velocity of R1 was about 12 km s-1, and from 02:20 to 02:24 UT, R1 scanned across the penumbra with a velocity of 19 km s-1. Then the chromospheric ribbon also quickly slowed down. In the course of the scanning, the two ribbons expanded in length and separated from each other, subsequently they intrude from the penumbrae into the umbrae of the sunspots. The dotted and the dashed lines labeled ‘a’ to ‘g’ and ‘ref1’, ‘ref2’, cut the penumbrae fibrils, respectively. The lines ‘a’ to ‘g’ lie in the parts of the penumbra where we see an immediate influence of the flare during the passage of the ribbons (see the accompanying movie), while ‘ref1’ and ‘ref2’ are located in parts of the penumbra that are not crossed by the flare ribbons. Time slices of the measured quantities along these lines are shown in Figs. 2-4.
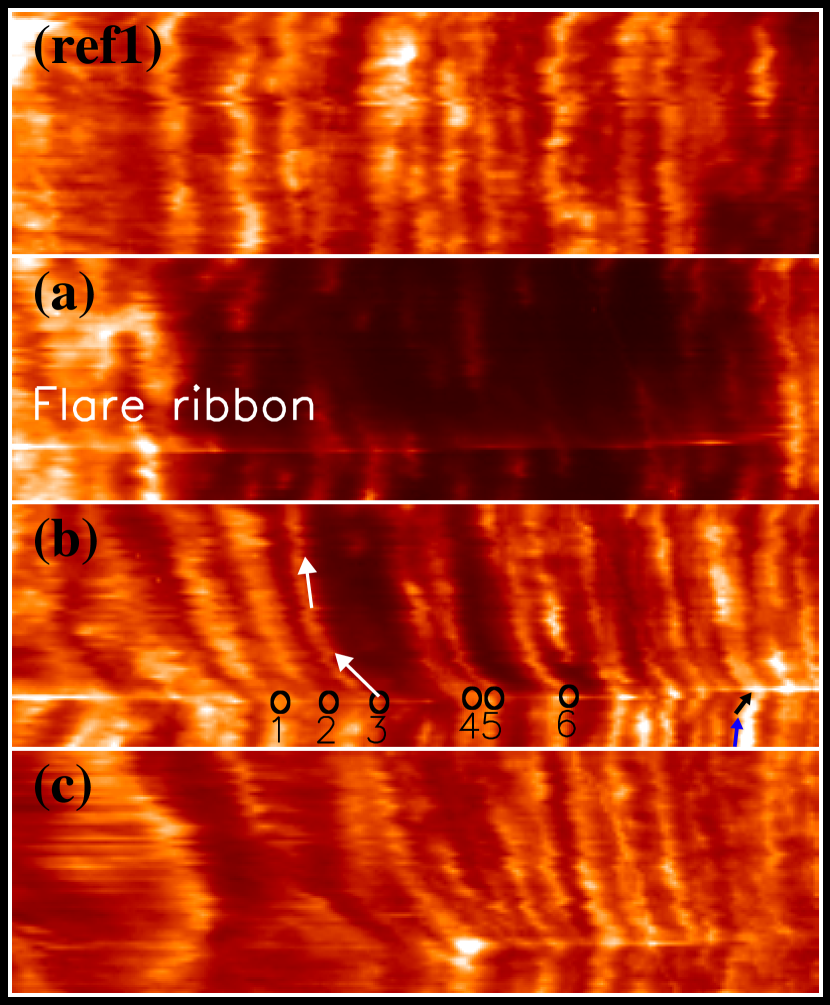
We display four time-slice maps taken from the G-band images in Fig. 2. From top to bottom, these maps correspond to the four lines ‘ref1’, ‘a’, ‘b’ and ‘c’, respectively. The X-axis is the distance (22 Mm) of the lines from left to right, which cut the penumbra of the largest sunspot ‘P1’. The Y-axis of each map denotes time, running from 2006 Dec. 13, 02:00 to 04:00 UT (from bottom to top). Bright horizontal strips on maps (a)-(c) represent the flare ribbon ‘R1’ at the time when it crosses that particular cut, while moving from the neutral area of the active region to the umbra of the largest sunspot ‘P1’. The top map indicates the G-band signals at the position ‘ref1’ where it is not disturbed by the flare ribbon R1, and the others maps (a)-(c), the signals affected by the ribbon. From map (ref1), we find no shear motion of the penumbral fibrils. However, from maps (a)-(c), we find that there is a rightwards tilt of these fibrils before the arriving of the flare ribbon R1 (see the blue and black arrows in Fig. 2b). The inward motion of bright/dark structures can explain the rightwards tilt in the time-slice maps (a), (b), (c) between 02:00 UT and 02:14 UT (e.g. see the blue arrow). However, the rightwards tilt between 02:14 UT and 02:22 UT (see the black arrow) is due to lateral rightwards displacement of the penumbral fibrils and it is related to the flare. Moreover, we find distinct opposite sideward displacement (see the white arrows) when the flare ribbon first scans the fibril in the photospheric layers. The whole fibril is offset perpendicular to its long direction and not just the part at which the flare ribbon currently resides (see the accompanying movie). Numbers 1-6 mark the positions where the lateral velocities are plotted in the bottom of Fig. 5. The lateral motion lasts for about one hour. This is much longer than the duration of the flare ribbon resides in the penumbra, which is 4-10 minutes, depending on which part of the penumbra we are considering. Although the signals on numbers ‘1’ and ‘2’ still display shear motion one hour after the initial shear, this motion is mainly contributed from the outward movement of bright material along the penumbral fibrils, seen from G-band movie. In the one hour interval from the original shear, the displacements at the six positions 1-6 are 2.1 Mm, 2.1 Mm, 2.0 Mm, 1.9 Mm, 1.8 Mm and 1.4 Mm, respectively. Evidently, the displacement of the penumbral fibrils started immediately after the flare ribbon reached the region.
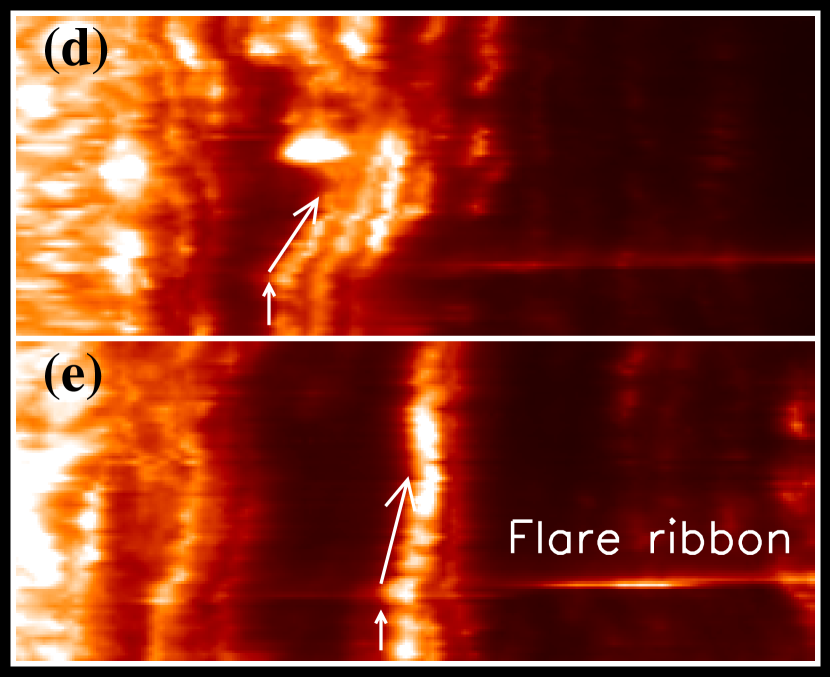
Figure 3 shows time-slice maps along lines ‘d’ and ‘e’ in the penumbra of the opposite polarity spot during and after the passage of the flare ribbon R2. This flare ribbon looks like a bright horizontal strip on each map, at the time when it crosses that particular cut, while moving from the central area of the active region to the umbra of the smaller sunspot ‘P2’. Figure 3(d) shows that the fibrils along this cut display a lateral motion. This motion lasts for about 50 minutes with a final displacement of 1.6 Mm. Figure 3(e) shows the displacement of a lightbridge which separates the two sunspots (P2 and P3). The lightbridge displays a smaller displacement (0.7 Mm) in the 50 minutes interval.
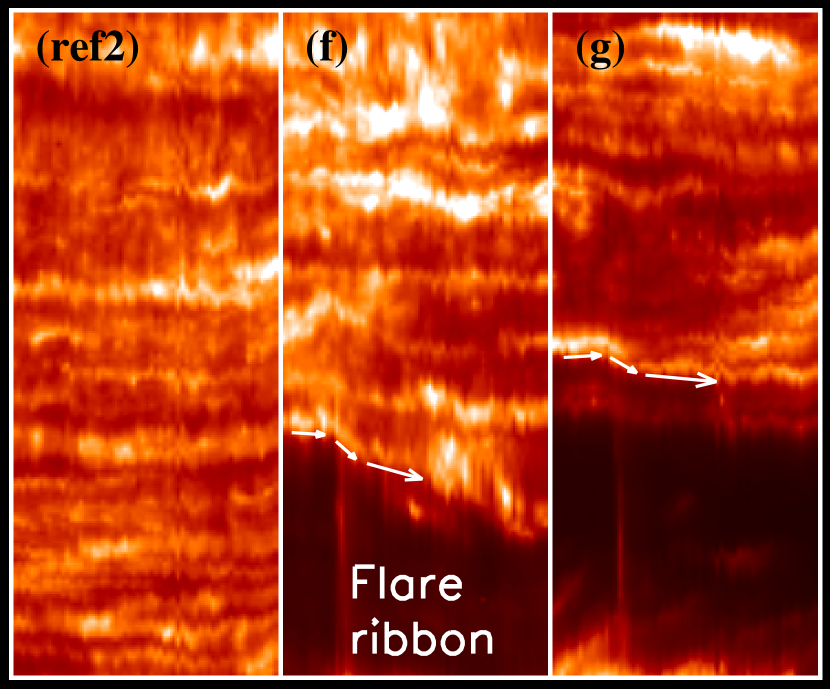
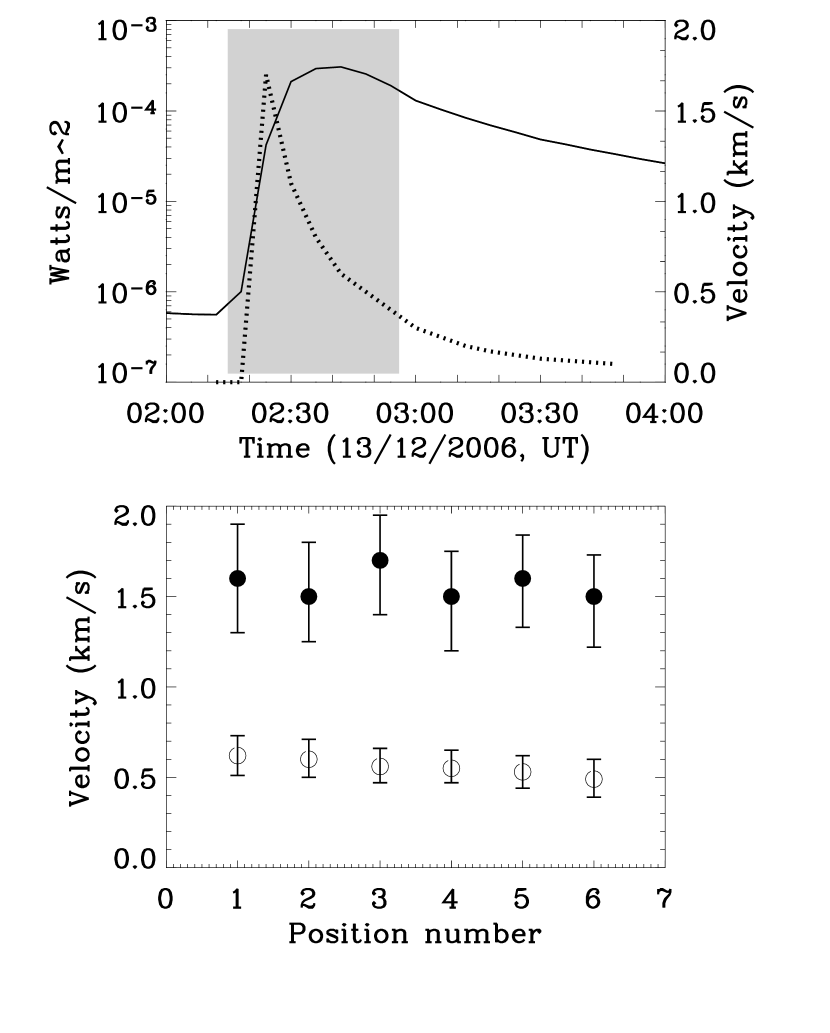
Figure 4 shows three time-slice maps (corresponding to the three lines ‘ref2’, ‘f’ and ‘g’ in Fig. 1) taken from the G-band images. The top panel of Fig. 4(ref2) confirms that the penumbral fibrils in regions unaffected by the flare ribbon remain at the line ‘ref2’ position, quite stable in the two hour interval. The penumbral fibrils cut by the lines ‘f’ and ‘g’ are parallel to the umbral boundary of sunspot P2. When flare ribbon R2 scans the penumbra, the fibrils displayed in map ‘f’ shear with a velocity of 1.1 km s-1 in the first 10 minutes. For map ‘g’, the shear velocity of the penumbral fibrils is 0.8 km s-1. The lateral motion last for about 30 minutes, along both cuts, which is shorter than that of the fibrils displayed in Figs. 2 and 3. The top panel of Fig. 5 displays soft X-ray flux (solid curve) of the flare measured by GOES-12 and lateral horizontal speed (dotted curve) at the position of number ‘3’ denoted in Fig. 2. Light gray area represents the period at which the flare is strongest. The shear appears suddenly at 02:24 UT, with a peak velocity of 1.6 km s-1, then the velocity decreases rapidly, and lasts for about one hour. On the bottom panel, the filled circles represent the peak lateral velocities between 2:24 and 2:28 UT at the six positions showed in Fig. 2, and the empty circles, the mean lateral velocities between 2:24 and 3:24 UT. The peak velocities of all the six positions are around 1.6 km s-1, while the mean velocity, 0.55 km s-1.
3 DISCUSSION AND CONCLUSIONS
The observations of the solar flare of December 13, 2006 from Hinode reveal a flare-induced displacement of penumbral fibrils, as seen in series of G-band images. The displament was started locally immediately after the passage of a flare ribbon. Fibrils not crossed by the flare ribbon are not seen to move. The passage of the flare ribbon produces a strong acceleration of the fibrils transverse to their elongated direction almost instantaneously. This results in a peak velocity reaching up to 1.6 km s-1. The maximum value of the horizontal displacement reaches 2.0 Mm, although at most locations the displacement is smaller, so that it is perhaps not surprising that the discovery of such photospheric effects of flares had to await the advent of data with consistent high resolution approaching 0.2′′ as provided by Hinode.
Wang et al. (2004) studied three X-class flares in the active region NOAA 10486 and found that the penumbral segments decayed rapidly right after the flares; meanwhile, the adjacent umbral cores became darker. The location of such a disappearance of penumbral structure coincides with, or is close to, the flare kernel. Moreover, these changes are permanent, e.g., they remained well after the flares and did not go back to the preflare level. They put forward the interpretation of the results: magnetic fields become more vertical after flares, which cause penumbrae to decay. The umbrae become darker as a result of enhancement of longitudinal magnetic field. However, in this study, we find the sideways displacement of the penumbral fibrils associated with the flare instead of the penumbral decay observed by Wang et al. (2004).
The structure of the magnetic field in the penumbra is complex, with interlaced fibrils of different magnetic inclination (e.g. Lites et al., 1993; Title et al., 1993; Solanki & Montavon, 1993; Solanki, 2003), which are related to fibril brightness in inner and lateral penumbra. As the cause of the shift, we propose the motion of field lines rearranged by the flares. Zirin (1984) have provided evidence that the coronal magnetic field rearranges itself significantly in the course of a flare. Such a rearrangement also leads to force that attempt to move the photospheric footpoints of the affected fields lines. Since the gas density is 8 orders of magnitude higher in the photosphere than in the corona and the pressure is 105 times higher, it is generally assumed that the field in the photosphere cannot be moved (line-tying). In a sunspot, however, the plasma (Solanki et al., 1993), so that magnetic field can also move the plasma bodily.
Our results therefore test the line-tying condition often involved in coronal magnetic field studies (Hood, 1986; Zweibel & Bruhwiler, 1992) and shows that although linetying is not exactly fulfilled, even in the case of an X-class flare and the field lines anchored in the penumbra, their footpoints move by less than 2 Mm. This suggests that the line-tying condition is relatively well fulfilled, e.g. for reconnection work. Furthermore, the sideways displacement occurred simultaneous with the passage of the flare ribbon may be the result of the lower reconnection site during the flare event.
In addition, under some assumptions, we estimate the value of the magnetic energy needed to result in the sideways displacement of the penumbral fibrils. Here, we use 108 km2 to be the area of these penumbral fibrils, and 103 km, the height. As the density of the photosphere is about 10-9 g cm-2, then the mass of these penumbral fibrils is 1017 g. The maximum velocity of these penumbral fibrils is 1.6 km s-1. Therefore, the kinetic energy of these penumbral fibrils are about 1027 erg. That is to say, more than 1027 erg magnetic energy will lead to the sideways displacement of the penumbral fibrils. Actually, the magnetic energy of lots of big flares are beyond this value. With higher spatial resolution observations (such as Hinode), we may find more flare events with sideways displacement of the penumbral fibrils. More major flare events need to be examined if the revealed magnetic changes in the course of flare by this study are common.
References
- Cameron & Sammis (1999) Cameron, R., & Sammis, I. 1999, ApJ, 525, L61
- Chen et al. (2007) Chen, W. Z., Liu, C., Song, H., et al. 2007, Chin. J. Astron. Astrophys., 7, 5, 733
- Deng et al. (2005) Deng, N., Liu, C., Yang, G., et al. 2005, ApJ, 623, 1195
- Hood (1986) Hood, A. W. 1986, Sol. Phys., 105, 307
- Kosovichev & Zharkova (1999) Kosovichev, A. G., & Zharkova, V. V. 1999, Sol. Phys., 190, 459
- Kosovichev & Zharkova (2001) Kosovichev, A. G., & Zharkova, V. V. 2001, ApJ, 550, L105
- Kosovichev & Sekii (2007) Kosovichev, A. G., & Sekii, T., 2007,ApJ, 670, L147
- Li & Zhang (2009) Li, L. P., & Zhang, J. 2009, ApJ, 706, L17
- Lites et al. (1993) Lites, B. W., Elmore, D. F., Seagraves, P., et al. 1993, ApJ, 418, 928
- Liu et al. (2005) Liu, C., Deng, N., Liu, Y., et al. 2005, ApJ, 622, 722
- Patterson & Zirin (1981) Patterson, A., & Zirin, H. 1981, ApJ, 243, L99
- Patterson (1984) Patterson, A. 1984, ApJ, 280, 884
- Qiu & Gary (2003) Qiu, J., & Gary, D. E. 2003, ApJ, 599, 615
- Solanki & Montavon (1993) Solanki, S. K., & Montavon, C. A. P. 1993, A&A, 275, 283
- Solanki et al. (1993) Solanki, S. K., Walther, U., & Livingston, W. 1993, A&A, 277, 639
- Solanki (2003) Solanki, S. K. 2003, A&A Rev., 11, 153
- Sudol & Harvey (2005) Sudol, J. J., & Harvey, J. W. 2005, ApJ, 635, 647
- Title et al. (1993) Title, A. M., et al. 1993, ApJ, 403, 780
- Tsuneta et al. (2008) Tsuneta, S. et al. 2008, Sol. Phys., 249, 167
- Wang et al. (2004) Wang, H. M., Liu, C., Qiu, J., et al. 2004, ApJ, 601, L195
- Wang et al. (2009) Wang, J. X., Zhao, M., & Zhou, G. P. 2009, ApJ, 690, 862
- Zhang et al. (2001) Zhang, J., Wang, J. X., Deng, Y. Y., Wu, D. J. 2001, ApJ, 548, L99
- Zhang et al. (2007) Zhang, J., Li, L. P., & Song, Q., 2007, ApJ, 662, L35
- Zhao et al. (2009) Zhao, M., et al. 2009, Research in Astron. Astrophys., 9, 7, 812
- Zirin (1984) Zirin, H. 1984, ApJ, 281, 884
- Zweibel & Bruhwiler (1992) Zweibel, E. G., & Bruhwiler, D. L. 1992, ApJ, 399, 318