The Green Bank Telescope Galactic H II Region Discovery Survey
Abstract
We discovered a large population of previously unknown Galactic H II regions by using the Green Bank Telescope to detect their hydrogen radio recombination line emission. Since recombination lines are optically thin at 3 wavelength, we can detect H II regions across the entire Galactic disk. Our targets were selected based on spatially coincident 24 and 21 continuum emission. For the Galactic zone and we detected 602 discrete recombination line components from 448 lines of sight, 95% of the sample targets, which more than doubles the number of known H II regions in this part of the Milky Way. We found 25 new first quadrant nebulae with negative LSR velocities, placing them beyond the Solar orbit. Because we can detect all nebulae inside the Solar orbit that are ionized by O-stars, the Discovery Survey targets, when combined with existing H II region catalogs, give a more accurate census of Galactic H II regions and their properties. The distribution of H II regions across the Galactic disk shows strong, narrow ( 1 kpc wide) peaks at Galactic radii of 4.3 and 6.0 kpc. The longitude-velocity distribution of H II regions now gives unambiguous evidence for Galactic structure, including the kinematic signatures of the radial peaks in the spatial distribution, a concentration of nebulae at the end of the Galactic Bar, and nebulae located on the kinematic locus of the 3 Arm.
1 INTRODUCTION
H II regions are the formation sites of massive OB stars. Because the main sequence lifetimes of OB stars are , H II regions are zero age objects compared to the age of the Milky Way. They thus reveal the locations of current Galactic star formation. They are the archetypical tracers of Galactic spiral structure. Their chemical abundances, moreover, indicate the present state of the interstellar medium (ISM) and reveal the elemental enrichment caused by the nuclear processing of many stellar generations. They provide unique and important probes of billions of years of Galactic chemical evolution (GCE). Individual Galactic H II regions are astrophysically important objects that reveal details of the impact of the star formation process on the ISM. Knowing the physical properties of H II region/photo-dissociation region/molecular cloud complexes provides important constraints on the physics of star formation and the evolution of the ISM.
Modern Galactic H II region surveys began with studies of the Palomar optical survey plates (Sharpless, 1953, 1959). Radio recombination lines (RRLs) from Galactic H II regions were discovered in 1965 during the commissioning of the NRAO 140 Foot telescope; Höglund & Mezger (1965) detected emission at 6 wavelength from M 17 and Ori A. Because the Galactic ISM is optically thin at centimeter wavelengths, RRL surveys were able to discover large numbers of H II regions distributed throughout the entire Galactic disk. Pioneering RRL surveys were done by, e.g., Reifenstein et al. 1970, Wilson et al. 1970, Downes et al. 1980, Caswell & Haynes 1987, and Lockman 1989. These surveys gave important insights into Galactic structure and the spatial pattern of massive star formation. Particularly noteworthy was the discovery of a metallicity gradient across the Galactic disk, made apparent by RRL measurements of H II region electron temperatures (Wink, Wilson, & Bieging, 1983; Shaver et al., 1983; Quireza et al., 2006). This Galactic-scale metallicity gradient placed strong constraints on GCE. By the time of the Lockman (1989) survey, however, almost all of the reasonably strong radio continuum sources, as revealed by contour maps often drawn by hand, had been observed; large angular scale surveys for discrete H II regions using -wave RRLs as tracers ceased. Despite these efforts, the census of Galactic H II regions was clearly incomplete. The advent of modern high-resolution, Galactic-scale infrared and radio surveys, coupled with the unprecedented spectral sensitivity of the NRAO Green Bank Telescope (GBT), has made the GBT H II Region Discovery Survey (HRDS) possible.
2 TARGET SAMPLE
We assembled our target list from the following multi-frequency, large solid angle Galactic surveys: the infrared Spitzer Galactic Legacy Infrared Mid-Plane Survey Extraordinaire (GLIMPSE: Benjamin et al., 2003) and MIPSGAL (Carey et al., 2009), the NRAO VLA Galactic Plane Survey made in 21 H I and continuum (VGPS: Stil et al., 2006), the VLA MAGPIS at 20 continuum (Helfand et al., 2006), and the NRAO VLA Sky Survey (NVSS: Condon et al., 1998). Our targets were selected by finding objects that showed spatially coincident 24 Spitzer MIPSGAL and 20 continuum emission, either from the VGPS or the NVSS. Our method was not automated, but instead relied on visual inspection of radio and IR emission maps. We removed known H II regions, planetary nebulae (PNe), luminous blue variables, and supernova remnants (SNRs) from the target sample using the SIMBAD database.
This criterion is a strong indication that a target is emitting thermally (Haslam & Osborne, 1987; Broadbent, Osborne, & Haslam, 1989), and therefore is likely an H II region or a PNe. Warm dust absorbs the far ultraviolet radiation from the exciting star(s) and re-emits in the IR, whereas plasma ionized by the same star(s) gives rise to free-free thermal emission at -wavelengths. It is certainly true that the radio continuum can result from a mixture of free-free (thermal) and synchrotron (non-thermal) emission. Fürst, Reich, & Sofue (1987) showed that one can discriminate thermally from non-thermally emitting objects by using the ratio of the infrared to radio fluxes. The IR/radio flux ratio for H II regions is typically 100 times larger than that for non-thermally emitting SNRs, so it is easy to to differentiate between the two by eye. Our visual inspection of the IR and radio images should have eliminated all the SNRs from our target sample. Sources showing coincident mid-IR and -wave continuum emission almost invariably are thermally emitting: 95% of our sample targets show hydrogen RRL emission with line to continuum ratios of which together suggests that our targets are emitting thermally.
3 GREEN BANK TELESCOPE OBSERVATIONS
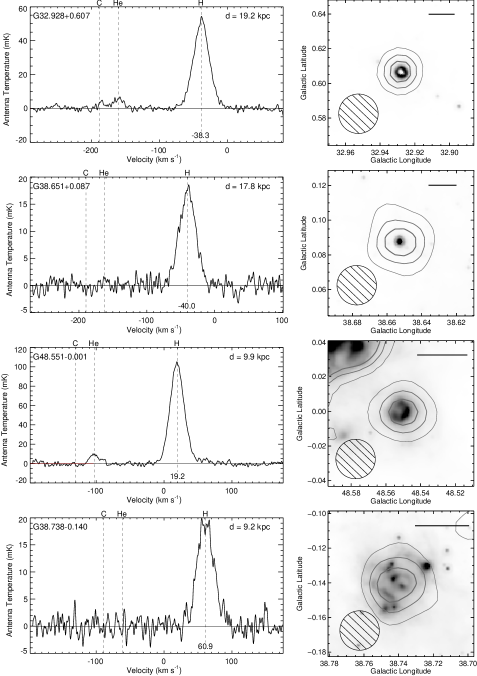
Figure 1 shows some representative GBT HRDS RRL detection spectra together with Spitzer MIPSGAL 24 images of the nebulae with contours of the VGPS 20 continuum emission superimposed. (The MIPS detector is saturated in the central region of G32.928+0.607.) The sensitivity of the GBT and the power of its Autocorrelation Spectrometer together made the HRDS possible. To achieve high sensitivity, we used techniques pioneered by Balser (2006), who realized that there are 8 H RRL transitions, to , that can be measured simultaneously by the GBT with the ACS at 3 wavelength (X-band). (The transition, however, is spectrally compromised by confusing, higher order RRL transitions.) Balser (2006) showed that all these transitions can be averaged (after they are re-sampled onto the same velocity scale) to significantly improve the RRL signal-to-noise ratio, thus giving an extremely sensitive X-band H average nebular spectrum.
This observing technique, coupled with the sensitivity afforded by the GBT’s aperture, gave us unprecedented spectral sensitivity per unit observing time advantage compared with all previous -wavelength RRL surveys of Galactic H II regions. The vast majority of our detections took only a single OffOn total power observation. After Gaussian smoothing over 5 channels to a resolution of 1.86 (to be compared with the 25 RRL typical line width), the r.m.s. noise for a single OffOn observation was typically 1. All details of the HRDS observing and analysis techniques, together with a catalog of the source properties, are discussed by Anderson et al. (2010, in preparation).
We also used the Digital Continuum Receiver to measure the free-free continuum flux for all our HRDS targets. These show a power law distribution for fluxes mjy. Below this the fitted power law overestimates the observed distribution which implies that the HRDS is complete to a flux limit of . Using the stellar fluxes given by Sternberg, Hoffmann, & Pauldrach (2003), we estimate that optically thin H II regions ionized by single O9 stars within the Solar orbit have flux densities 120 at 9. The HRDS thus should be finding all such H II regions and, furthermore, is capable of detecting O3 stars at heliocentric distances of 20 (Rubin, 1968; Anderson, 2009).
4 DISCUSSION
The GBT HRDS has doubled the number of known H II regions in the Galactic zone and . Each discovery gives a position and LSR velocity for the nebula. We detected 602 discrete Hydrogen RRL components from 448 target lines of sight, including 65 infrared bubbles found in the Spitzer GLIMPSE survey. We found 129 multiple velocity component sources (29% of the target sample). Figure 2 shows the longitude-velocity distribution of the HRDS nebulae, projected onto the Galactic plane.
Although the HRDS found 448 H II regions, the number of physically distinct nebulae represented by the 602 discrete Hydrogen RRL components is not well known. Thermal radio sources can often be resolved into several apparently physically distinct emission regions, each having a somewhat different position and RRL velocity. Furthermore, the most massive star-forming complexes, W 43 for example, are extended and fragmented into many sub-clumps of localized star formation, which together can ionize a very large zone. Many of our multiple velocity component targets may be detecting such low density ionized gas in addition to RRL emission from another, physically distinct nebula. Here we follow the convention established by Lockman (1989) and assume that each of our 602 RRLs is produced by a distinct object. One should keep in mind, however, that the concept of a “discrete H II region” may not apply to many of the complex nebulae seen in the inner Galaxy.
Here we assume that all the HRDS sources are H II regions. Anderson et al. (2010, in preparation) show that the level of contamination in the HRDS sample by heretofore unknown SNRs, PNe, luminous blue variables, etc., is very small. This conclusion is based on considerations of galactic structure, scale height, RRL line widths, and the RRL line-to-continuum ratios (i.e. nebulae electron temperatures).
Here we use the Paladini et al. (2003) catalog as a proxy for the sample of previously known H II regions. The Paladini et al. (2003) catalog of Galactic H II regions is a compilation of 24 Galactic H II region single-dish, medium resolution ( few arcmin) surveys covering the entire Galactic plane. There is, however, no definitive, complete compilation of all previously detected Galactic H II regions. Our HRDS nebulae are new, previously unknown H II regions because they are not listed in the Paladini et al. (2003) compilation, the Lockman, Pisano, & Howard (1996) survey, the Ultra-Compact nebulae studied by Araya et al. (2002), Watson et al. (2003), and Sewilo et al. (2004), nor are they in the SIMBAD database.
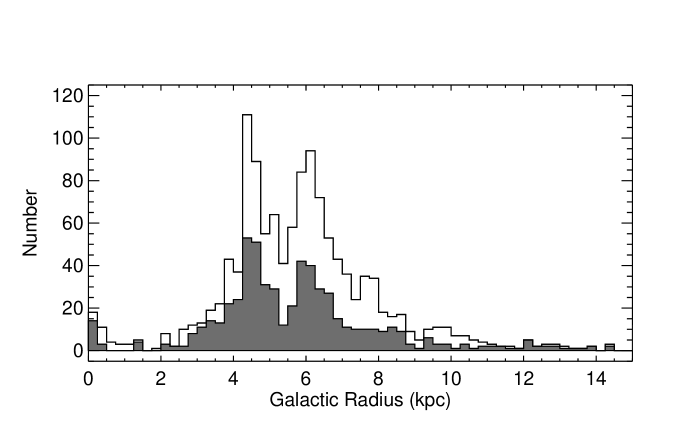
The LSR velocity of each HRDS H II region maps into a unique Galactocentric radius, . Using the Brand (1986) rotation curve, Figure 3 shows the azimuthally averaged distribution of Galactic H II regions as a function of . The filled histogram shows the HRDS nebulae; the open histogram is the total H II region sample (1276 nebulae: HRDS & Paladini et al., 2003). The distribution of H II regions across the Galactic disk shows strong, narrow ( 1 wide) peaks at Galactic radii of 4.25 and 6.00 kpc. There is still an overall dearth of H II regions within 4 radius (Burton, 1976; Lockman, 1981; Bronfman et al., 2000). In the = 2 to 4 zone, however, the HRDS has found 75 new nebulae, whereas Paladini et al. (2003) list only 56. The majority of these HRDS RRL components appear to be associated with the Galactic Bar at 3. The Galactic Bar and 3 Kpc Arm, however, produce large streaming motions that occur throughout the inner Galaxy, making all determinations that assume circular rotation uncertain inside 4 kpc radius (Burton & Liszt, 1993).
Together, Figs. 2 and 3 show that the level of PNe contamination in the HRDS sample must be minimal. Because PNe are an old stellar population their Galactic orbits are well-mixed. PNe show, therefore, no structure in their Galactocentric radial distribution and their Galactic longitude-velocity distribution is a scatter plot constrained only by velocities permitted by Galactic rotation. Any PNe contamination of the HRDS sample must therefore be very small, otherwise these interlopers would suppress the unambiguous signal of Galactic structure seen in the HRDS Galactocentric radial and Longitude-Velocity distributions.
Figure 4 shows that the longitude-velocity distribution of the new HRDS and previously known H II region sample together now give unambiguous evidence for an ordered pattern of Galactic structure. Doubling the census makes the contrast of the – features striking. The empty zones in Fig. 4 are just as important in this regard as are the features seen. The sample of 1276 nebulae clearly shows the kinematic signatures of the radial peaks in the spatial distribution (Fig. 3), a concentration of nebulae at the end of the Galactic Bar, at 30 ° and +100 (Benjamin et al., 2005; Churchwell et al., 2009), and nebulae located on the kinematic locus of the 3 Arm.
The H II region Galactocentric radial distribution peaks at 4.3 and 6.0 have traditionally been associated with the Scutum-Centaurus and Sagittarius spiral arms. In the first Galactic quadrant they imply tangent point longitudes of 30° and 45°, respectively, for = 8.5. The Brand (1986) rotation curve terminal velocities for these directions are 107 and 65, respectively. The straight lines in Fig. 4 are the solid body loci defined by these tangent points and terminal velocities. These loci trace the over-densities in the H II region – distribution for quite well. These Northern tangent point longitudes show evidence for non-circular streaming motions of 10.
Over 50 years after its discovery (van Woerden, Rougoor, & Oort, 1957), the precise astrophysical nature of the Milky Way’s 3 Kpc Arm remains enigmatic. The ellipse drawn in Fig. 4 shows the locus of the Cohen & Davies (1976) 3 Kpc Arm kinematic expanding ring model ( = 4, , ). Discovered by the very first 21 H I surveys, the 3 Kpc Arm also contains considerable amounts of molecular gas (Bania, 1977, 1980, 1986). Although the near side of the Arm, the segment between the Sun and the Galactic Center, is quite prominent, the far side of the Arm was only recently discovered by Dame & Thaddeus (2008). Because of this spatial symmetry and its extreme non-circular velocities, the 3 Kpc Arm provides strong evidence that the Milky Way is a m=2 barred spiral galaxy (Fux, 1999).
Knowing that on-going star formation is occurring in the 3 Kpc Arm may help constrain theories of its dynamical origin. The 3 Kpc Arm lacks large numbers of H II regions (Lockman, 1980, 1981), but there are some in it (Bania, 1980). Although the HRDS found a few more nebulae ( 10 more in the near side Arm, see Fig. 2), it has not, however, found a substantial new population of H II regions along the 3 Kpc Arm – locus. The far side of the Arm, in the quadrant, remains almost devoid of nebulae along the Arm locus. Because the velocities predicted by the expanding ring model will blend with normal Galactic rotation velocities in the and quadrants, the H II region clusterings seen along the Cohen & Davies (1976) ring locus are difficult to interpret.
We were able to determine the distances to G and G in Fig. 1 by using H I emission/absorption experiments to resolve the kinematic distance ambiguity (As Anderson & Bania, 2009, did for the sample of previously known first Galactic quadrant H II regions.) Each nebula is at the far kinematic distance. The majority of our HRDS H II regions are unresolved with our 82″ survey resolution. We are finding that many of these small angular diameter nebulae lie at the far kinematic distance. Earlier RRL surveys missed these nebulae because their weak continuum made them poor target choices.
The HRDS found 25 first quadrant nebulae with negative LSR velocities. In the first Galactic longitude quadrant, a negative RRL LSR velocity unambiguously places the H II region beyond the Solar orbit, at large distances from the Sun, 12, in the outer Galactic disk, 9. Prior to the GBT HRDS, there were only two negative-velocity H II regions known in the , zone. The newly discovered Fig. 1 sources at 40.0 and at 38.3 already match the size of the previous census. The – distribution of these negative velocity sources shows good agreement with maps made by Dame, Hartmann, & Thaddeus (2001). This region in ,-space has traditionally been termed the “Outer Arm”.
Because of their location in the critical region beyond the Solar orbit at , these nebulae will provide new GCE constraints. The HRDS and follow-up GBT observations will allow us to derive the nebular electron temperature, , and helium abundances (Y = /H). Because metals are the main coolants in the photo-ionized gas, both and Y are directly related to the distribution of heavy elements in the Milky Way. There are relatively few H II regions with accurately derived values, especially at the critical 10 region. In the first Galactic quadrant, our 25 new HDRS nebulae can increase the sample size by a factor of 10.
We detected RRL emission from 65 H II regions that are surrounded by mid-infrared bubbles. The Spitzer GLIMPSE survey found almost 600 objects in the inner Galaxy that have a ring-shaped morphology (Churchwell et al., 2006, 2007). These are presumably bubbles that are viewed in projection. These objects have simple morphologies and “swept-up” neutral material; they may be sites of triggered star formation (see, e.g., Deharveng et al., 2009). Churchwell et al. (2006) argue that 75% of GLIMPSE bubbles are caused by B-stars without detectable H II regions. Because of the large number of bubbles that we find enclosing HRDS sources, we speculate that nearly all GLIMPSE bubbles are caused by H II regions.
5 SUMMARY
The advent of modern high-resolution, Galactic-scale infrared and radio surveys, e.g. Spitzer GLIMPSE/MIPSGAL and the VLA VGPS, coupled with the unprecedented spectral sensitivity of the NRAO Green Bank Telescope allowed us to make a major new discovery survey of Galactic H II regions. The GBT HRDS has doubled the number of known H II regions in the Galactic zone and . The census of H II regions, when enhanced by the HRDS, now shows in this Galactic zone a longitude-velocity distribution that gives unambiguous evidence for Galactic structure, including the kinematic signatures of peaks in the radial spatial distribution of nebulae, a concentration of nebulae at the end of the Galactic Bar, and nebulae located on the kinematic locus of the 3 Arm. Doubling the Galactic H II region census makes the contrast of the – features striking. The empty zones in Fig. 4 are just as important in this regard as are the concentrations of nebulae in – space.
We found 25 new nebulae located beyond the Solar orbit, at large distances from the Sun, 12, in the outer Galactic disk, 10. Because of their location, these nebulae will be important for future studies of the radial metallicity gradient in the Galaxy. Many of our new nebulae are seen as bubbles in Spitzer GLIMPSE images. We found 65 such objects and speculate that nearly all the Spitzer GLIMPSE mid-IR identified bubbles are H II regions.
The HRDS nebular distances will be determined by using H I emission/absorption experiments to resolve the kinematic distance ambiguity (see Anderson & Bania, 2009). Because we can detect all nebulae inside the Solar orbit that are ionized by O-stars, the GBT HRDS sources, when combined with existing H II region catalogs, will provide a more complete census of Galactic H II regions with known distances and physical properties, which is the fundamental database needed for ISM evolution studies of the Molecular Cloud/H II Region/Star Cluster/Supernova Bubble life-cycle. This will enhance our ability to study Galactic structure using spatial distributions and to constrain Galactic chemical evolution using spatial patterns of nebular metallicity.
References
- Anderson (2009) Anderson, L. D. 2009, PhD Thesis, Boston Univ. (USA)
- Anderson & Bania (2009) Anderson, L. D., & Bania, T. M. 2009, ApJ, 690, 706
- Araya et al. (2002) Araya, E., Hofner, P., Churchwell, E., & Kurtz, S. 2002, ApJS, 138, 63
- Bania (1977) Bania, T. M. 1977, ApJ, 216, 381
- Bania (1980) Bania, T. M. 1980, ApJ, 242, 95
- Bania (1986) Bania, T. M. 1986, ApJ, 308, 868
- Balser (2006) Balser, D.S. 2006, AJ, 132, 2326
- Benjamin et al. (2003) Benjamin, R. A., et al. 2003, PASP, 115, 953
- Benjamin et al. (2005) Benjamin, R. A., et al. 2005, ApJ, 630, L149
- Brand (1986) Brand, J. 1986, PhD Thesis, Leiden Univ. (Netherlands)
- Broadbent, Osborne, & Haslam (1989) Broadbent, A., Osborne, J. L., & Haslam, C. G. T. 1989, MNRAS, 237, 381
- Bronfman et al. (2000) Bronfman, L., Casassus, S., May, J., & Nyman, L. 2000, A&A, 358, 521
- Burton (1976) Burton, W. B. 1976, ARAA, 14, 275
- Burton & Liszt (1993) Burton, W. B., & Liszt, H. S. 1993, A&A, 274, 765
- Carey et al. (2009) Carey, S.J., et al. 2009, PASP, 121, 76
- Caswell & Haynes (1987) Caswell, J. L., & Haynes, R. F. 1987, A&A, 171, 261
- Churchwell et al. (2007) Churchwell, E., et al. 2007, ApJ, 670, 428
- Churchwell et al. (2006) Churchwell, E., et al. 2006, ApJ, 649, 759
- Churchwell et al. (2009) Churchwell, E., et al. 2009, PASP, 121, 213
- Cohen & Davies (1976) Cohen, R. J. & Davies, R. D. 1976, MNRAS, 175, 1
- Condon et al. (1998) Condon, J. J., Cotton, W. D., Greisen, E. W., Yin, Q. F., Perley, R. A., Taylor, G. B., & Broderick, J. J. 1998, AJ, 115, 1693
- Dame, Hartmann, & Thaddeus (2001) Dame, T. M., Hartmann, D., & Thaddeus, P. 2001, ApJ, 547, 792
- Dame & Thaddeus (2008) Dame, T. M. & Thaddeus, P. 2008, ApJ, 683, L143
- Deharveng et al. (2009) Deharveng, L., Zavagno, A., Schuller, F., Caplan, J., Pomarès, M., & De Breuck, C. 2009, A&A, 496, 177
- Downes et al. (1980) Downes, D., Wilson, T. L., Bieging, J., & Wink, J. 1980, A&AS, 40, 379
- Fux (1999) Fux, R. 1999, å, 345, 787
- Fürst, Reich, & Sofue (1987) Fürst, E., Reich, W., & Sofue, Y. 1987, A&AS, 71, 63
- Haslam & Osborne (1987) Haslam, C. G. T., & Osborne, J. L. 1987, Nature, 327, 211
- Helfand et al. (2006) Helfand, D. J., Becker, R. H., White, R. L., Fallon, A., & Tuttle, S. 2006, AJ, 131, 2525
- Höglund & Mezger (1965) Höglund, B., & Mezger, P. G. 1965, Science, 150, 339
- Lockman (1980) Lockman, F. J. 1980, ApJ, 241, 200
- Lockman (1981) Lockman, F. J. 1981, ApJ, 245, 459
- Lockman (1989) Lockman, F. J. 1989, ApJS, 71, 469
- Lockman, Pisano, & Howard (1996) Lockman, F. J, Pisano, D. J., & Howard, G. J., ApJ, 472, 173
- Paladini et al. (2003) Paladini R., Burigana C., Davies R. D., Maino D., Bersanelli M., Cappellini B., Platania P., & Smoot G. 2003, A&A, 397, 213
- Quireza et al. (2006) Quireza. C., Rood, R. T., Bania, T. M., & Balser, D. S. 2006, ApJ, 653, 1126
- Reifenstein et al. (1970) Reifenstein, E. C., Wilson, T. L., Burke, B. F., Mezger, P. G., & Altenhoff, W. J. 1970, A&A, 4, 357
- Rubin (1968) Rubin, R. H. 1968, ApJ, 154, 391
- Sewilo et al. (2004) Sewilo, M., Watson, C., Araya, E., Churchwell, E., Hofner, P., & Kurtz, S. 2004, ApJS, 154, 553
- Sharpless (1953) Sharpless, S. 1953, ApJ, 118, 362
- Sharpless (1959) Sharpless, S. 1959, ApJS, 4, 257
- Shaver et al. (1983) Shaver, P. A., McGee, R. X., Newton, L. M., Danks, A. C., & Pottasch, S. R. 1983, MNRAS, 204, 53
- Sternberg, Hoffmann, & Pauldrach (2003) Sternberg, A., Hoffmann, T. L., & Pauldrach, A. W. A. 2003, ApJ, 599, 1333
- Stil et al. (2006) Stil, J. M., et al. 2006, AJ, 132, 1158
- van Woerden, Rougoor, & Oort (1957) van Woerden, H., Rougoor, G. W., & Oort, J. H. 1957, Comp. Rend., 249, 1961
- Watson et al. (2003) Watson, C., Araya, E., Sewilo, M., Churchwell, E., Hofner, P., & Kurtz, S. 2003, ApJ, 587, 714
- Wilson et al. (1970) Wilson, T. L., Mezger, P. G., Gardner, F. F., & Milne, D. K. 1970, A&A, 6, 364
- Wink, Wilson, & Bieging (1983) Wink, J. E., Wilson, T. L., & Bieging, J. H. 1983, A&A, 127, 211