Water-ice driven activity on Main-Belt Comet P/2010 A2 (LINEAR)?
Abstract
The dust ejecta of Main-Belt Comet P/2010 A2 (LINEAR) have been observed with several telescopes at the at the Observatorio del Roque de los Muchachos on La Palma, Spain. Application of an inverse dust tail Monte Carlo method to the images of the dust ejecta from the object indicates that a sustained, likely water-ice driven, activity over some eight months is the mechanism responsible for the formation of the observed tail. The total amount of dust released is estimated to be 5107 kg, which represents about 0.3% of the nucleus mass. While the event could have been triggered by a collision, this cannot be decided from the currently available data.
1 Introduction
On January 6, 2010, P/2010 A2 (LINEAR), a comet-like object, was discovered by the LINEAR sky survey. The orbital elements of the object ( = 2.29 AU, = 0.12 and = 5.26 ) are typical of an inner Main-Belt asteroid belonging to the Flora collisional family, and suggest that it is unlikely to have originated in the classical comet source regions (i.e., the Kuiper Belt or the Oort cloud). The object reached perihelion, at a heliocentric distance of =2.0 AU, on 4 December 2009.
Observations taken a few days after its discovery showed an inactive nucleus lying outside a dust cloud that looks like a cometary tail without central condensation (Licandro et al., 2010a, b; Jewitt et al., 2010). This suggested that the observed dust cloud and the nucleus were the result of an impact between two previously unknown asteroids: the dust cloud is a plume of dust and the nucleus is what remains from the largest of the asteroids that collided.
Owing to its cometary-like aspect and orbital parameters, P/2010 A2 can be classified as a Main-Belt Comet (MBC, Hsieh & Jewitt, 2006). In contrast with the other known MBCs, however, P/2010 A2 has a significantly smaller semi-major axis (2.29 AU versus 2.7 AU and 3.2 AU). Until now, the activity observed in MBCs was found to be compatible with a water-ice driven activation mechanism suggesting that those asteroids retained ice layers below their surface and, under certain conditions, become “activated asteroids”. The presence of water-ice on the surface of 24 Themis, the parent asteroid of the Themis family MBCs (Campins et al., 2010; Rivkin & Emery, 2010) strongly support this.
One of the activation mechanisms could be a collision between two asteroids. Collisions are known to take place regularly, but they are so rare that none of the dust plumes that they should generate has ever been seen. If P/2010 A2 is the debris of a collisional event, this would be the first time that the ejecta from such a collision is observed soon after it happened. It would provide a unique opportunity to learn something about asteroid collision processes and about the internal composition of asteroids. Alternatively, if the observed activity is sustained in time as in comets, this leaves open two interesting problems: (1) if water-ice sublimation is the activation mechanism, how does water-ice survive in an asteroid with such a small semi-major axis; or (2) is there any other mechanism capable of ejecting dust in a similar manner as water-ice sublimation does ?
In this paper we present and analyze images of P/2010 A2 obtained with three telescopes at the Roque de los Muchachos Observatory (ORM), La Palma, Spain. In Sect. 2 the observations and data reduction are presented. In Sect. 3 we analyze the combined images using the inverse Monte Carlo dust tail fitting method (e.g. Moreno et al., 2004; Moreno, 2009) to study possible ejection scenarios. The conclusions are presented in Sect. 4.
2 Observations and data reduction
Images of P/2010 A2 were obtained in January 2010 with the Optical System for Imaging and low Resolution Integrated Spectroscopy (OSIRIS; Cepa et al., 2000; Cepa, 2010) camera-spectrograph at the Gran Telescopio Canarias (GTC), with the Auxiliary camera-spectrograph (ACAM) at the William Herschel Telescope (WHT), and with the Andalucia Faint Object Spectrograph and Camera (ALFOSC) at the Nordic Optical Telescope (NOT) all located at the ORM.
The observational circumstances are given in Table 1. For the observations with the NOT, the telescope was set at the comet’s rate motion, while sidereal tracking was used for both WHT and GTC. In all cases the images were obtained in service mode by telescope staff and were reduced by subtracting the overscan level and flat fielded using standard procedures.
The observations with OSIRIS at the GTC were made with the Sloan g′,r′, and i′ filters. OSIRIS provides a field of view 7.87.8 with a gap of 9.2 in the middle and a pixel scale of 0.125pixel-1. To increase the signal-to-noise the data were binned in 22 pixels. The images were calibrated using photometric zeropoints determined from standard star observations.
The observations with ACAM at the WHT were made with the Sloan g′ and r′ filters. ACAM is mounted permanently at a folded-Cassegrain focus of the telescope and has a circular field of view of 8 diameter with a pixel scale of 0.25 pixel-1. The resulting calibrated WHT images show brightness levels in agreement with those obtained at GTC within 10%.
The observations with ALFOSC at the NOT were made with standard Johnson-Cousins and filters. ALFOSC provides a field of view of 6.56.5 with a pixel scale of 0.19 pixel-1. These images were calibrated with stars in the field of view using magnitudes from the USNO-B1.0 catalog (Monet et al., 2003), which provides a photometric accuracy of 0.3 mag.
Using the transformation equations of Fugukita et al. (1996) and the magnitude of the Sun in the standard Johnson-Cousins filter (=–26.75, Cox, 2000), we derive =–26.96. Since =–27.29, the images of the object obtained at GTC and WHT were transformed to standard Johnson-Cousins magnitudes by subtracting 0.33 mag, where we assume for the object the same spectral dependence as for the Sun within the bandpasses of these two red filters. The resulting GTC, WHT, and NOT magnitudes are consistent with their errors and we conclude that the object did not change brightness significantly during our observations.
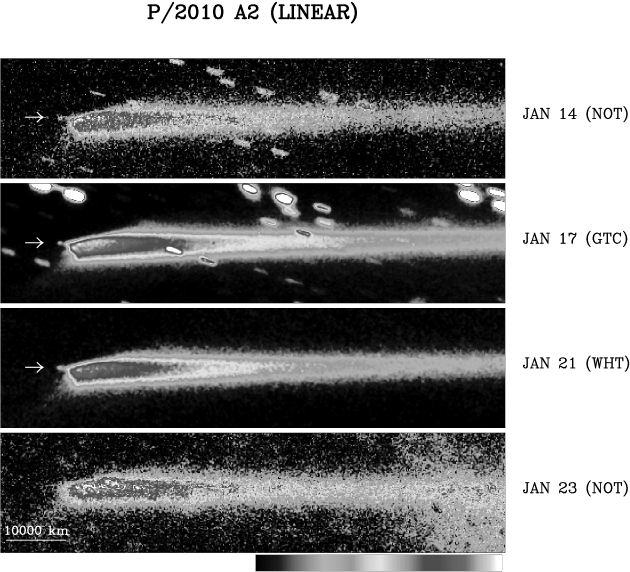
The available images in each night were combined in order to improve the signal-to-noise ratio and converted to solar disk intensity units appropriate for the analysis in terms of dust tail models. Figure 1 depicts some representative images obtained on the different dates with the instruments mentioned above. In this figure one can clearly see the inactive nucleus (marked with an arrow) lying outside the dust cloud that looks like a cometary tail. The absence of a dust cloud surrounding the nucleus indicates that the dust emission has stopped before the observations. Using aperture photometry, we determined the nucleus magnitudes for the GTC, WHT, and NOT images whenever possible (see Table 1). The aperture size was of 1.5, and the nucleus profiles were stellar-like. For the GTC images, which have the best S/N ratio, and using the formalism by Bowell et al. (1989) with a slope parameter of =0.15, we obtained a nucleus absolute magnitude of =21.30.3. Hence, a nucleus diameter of =22040 m can be determined, assuming a bulk albedo of =0.11, typical of a S-type asteroid. This assumption is based on the fact that the S-type asteroids are the most common objects in the inner Main Asteroid Belt (e.g. Bus & Binzel, 2002).
The combined images from GTC and WHT obtained on the 17th and 21st January show the best S/N ratio (see Fig. 1), and were selected for a more detailed analysis. To carry out the analysis in terms of dust tail models an additional rebinning was made of the images. The WHT image was rebinned to 4 pixels, giving a spatial resolution of 772.4 km pixel-1, while the GTC image was rebinned to 3 pixels to give a resolution of 576.3 km pixel-1. Finally, the rebinned images were rotated to the coordinate system, where is the extended radius vector from the Sun, and is perpendicular to and directed opposite to the object’s motion along its orbit (Finson & Probstein, 1968).
3 Application of the inverse dust tail model to P/2010 A2
We have performed an analysis of both the WHT and GTC images by the inverse Monte Carlo dust tail fitting code (e.g. Moreno et al., 2004; Moreno, 2009), which is based on the same procedures as that developed by Fulle (e.g. Fulle, 1989, 2004). Briefly, a large amount of particles (typically 107) of a selected size range are released from the surface of the object in a given time interval, with an assumed velocity law, which may be a function of time and particle size. The particles are then submitted to the radiation pressure and gravity field of the Sun, and their Keplerian orbits are computed. The ratio of the force exerted by the solar radiation pressure and the solar gravity is given by , which can be expressed as , where =1.19 10-3 kg m-2, and is the particle density. For particle radii 0.25 m, the radiation pressure coefficient is 1 (Burns et al., 1979). The inverse method involves the inversion of the overdetermined system of equations , where is the kernel matrix containing the dust tail model, i.e., the surface density of the sample of particles integrated over time and , is the output vector which contains the time-dependent distribution of , and is the brightness of the input image in the selected region of the photographic -plane.
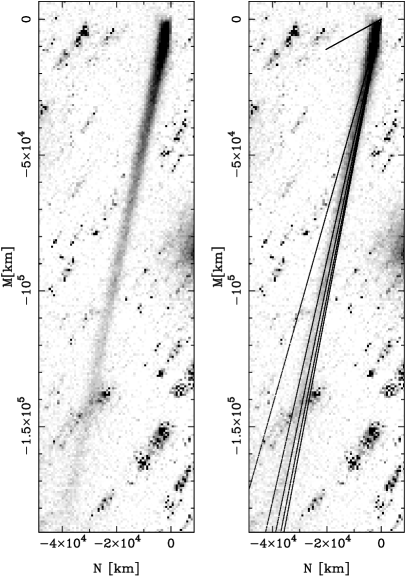
The physical appearance of the tail, detached from the nucleus and sun-ward oriented (see Figures 1 and 2), suggests that most of the dust was already ejected sometime well before the date of the observation, and should be composed of relatively large particles, otherwise they would have been blown away by radiation pressure. This is clearly demonstrated in Figure 2, where the combined WHT image is shown along with the synchrones (Finson & Probstein, 1968) corresponding to ejection times from 272 days before perihelion to 3 days after perihelion. Assuming a particle density of 1000 kg m-3, these synchrones would correspond to particle sizes between 0.001 cm and 1 cm. To start the simulations, and based on the synchrone map, we assumed initially that dust has been ejected at any time starting approximately a year before the observations, with sizes in the range 0.001 cm to 1 cm. We fixed the particle density to = 1000 kg m-3, and the albedo times the phase function to be =0.04, i.e., a Halley-like value. In principle, we assumed isotropic ejection. The better spatial resolution of the GTC image compared to the WHT image might suggest anisotropic ejection, which is particularly indicated by the shape of the isophotes near the nucleus. We will come back to this point later.
For lack of better information, we assumed an ejection velocity as given by , which from hydrodynamical considerations is typical from gas drag by sublimation processes. We did not assume any temporal variation in the ejection velocities, which is reasonable taking into account the low eccentricity of the orbit. We found that the best fits to the images are found when the velocity is given by cm s-1. This imply a velocity of 8.5 cm s-1 for a grain of =1 cm. Using the formulae by Whipple (1951) for a nucleus of 22040 m in diameter as given above and heating efficiency factor of 0.1 we get, at a heliocentric distance of 2 AU, a range of velocities of 12–14 cm s-1 (and smaller values for lower values of the heating efficiency), which are not far from our model results. This would then be consistent with a typical cometary activity scenario where the outgassing is driven by water-ice sublimation.
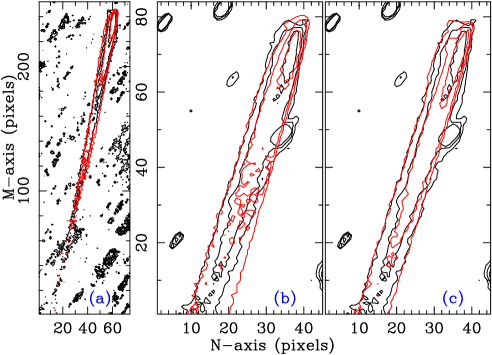
The result of the model fit to the WHT image is shown in figure 3(a), and the derived dust mass loss rates as a function of time are shown in figure 4. The model isophotes reproduce quite closely those of the WHT image. The variation of the mass loss rate indicates that the onset of the activity occurred in late March 2009, with a maximum of activity around early June 2009, with a peak of dust loss rate of about 5 kg s-1, and decreasing to 0.1 kg s-1 near perihelion in early December 2009. The integrated dust loss is 5.4107 kg. Assuming a spherically-shaped nucleus of diameter of 220 m, and a bulk density of 3000 kg m-3, the dust mass in the tail corresponds to 0.3% of the total nucleus mass.
We tried other model combinations to search for other possible solutions. In particular, we tried to fit the data by assuming narrower time intervals for the dust ejection, which could support an interpretation of a single collision event without any further outgassing activity, but we could not find any acceptable solutions even modifying also the particle sizes and ejection velocities with values well above and below the expected values that occur in the laboratory experiments such as presented by Nakamura & Fujiwara (1991).
If the isotropic ejection model with the same input parameters is applied to the GTC image, we obtain the result shown in figure 3(b). In this case, due to the fact that a certain portion of the tail is clipped, the dust mass loss differs from that found for the WHT image, particularly in that the mass loss becomes zero at times earlier than 180 days pre-perihelion (see figure 4). For the same reason, the integrated ejected dust mass is also lower at 1.7107 kg. Looking closely at the fitted isophotes, some mismatch in the tail head near the nucleus can be seen, and also in the outermost isophote towards the sun-ward region. Therefore, we decided to incorporate ejection anisotropy in the model by considering emission from a selected active area at a particular region of a spherically symmetric rotating nucleus. The rotation period was set to 3 hours. After trying tens of models with varying rotational parameters and location of the active area, a very good fit was obtained by taken the argument of the sub-solar meridian at perihelion as =180∘, and the obliquity as =95∘, with an active area occupying a part of the southern hemisphere of the object in the latitude range [–90∘,–40∘]. The resulting fit to the GTC observation is shown in figure 3(c). If a collision triggered the outgassing event, it could have occurred at high southern latitudes on the object. Although this model seems highly speculative, and other alternative scenarios exist, it does produce an excellent fit to the data.
For the resulting time-averaged size distribution, a fit indicates a power-law with an index of –3.40.3, a value typically found in the analysis of dust ejected from comets (e.g. Fulle, 2004).
The above fits indicate that the observations cannot be explained by dust released in a sudden event such as a collision and subsequent ejection of asteroid surface material, but it does need a sustained cometary-like activity during several months after the onset of the activity as described above. Whether the onset of the activity was triggered by a collision event or by another mechanism that might be similar to those occurring in other Main-Belt Comets (Hsieh & Jewitt, 2006), can not be decided from the available data.
4 Conclusions
The application of the inverse dust tail Monte Carlo fitting method to images of the tail of P/2010 A2 tail has revealed that the observed brightness distribution is only consistent with a sustained (possibly water-ice driven) cometary-like activity that spanned approximately 8 months, which is estimated to have started in late March 2009. The total amount of the ejected mass was about 5107 kg, when assuming an albedo times phase function of 4%, and a particle density of 1000 kg m-3. It is not possible to asses whether the outgassing event was triggered by a collision or by another unspecified mechanism. However, the detection of a sustained cometary-like activity over a considerable period of time has obvious consequences for the internal structure of the object. It might indicate that some subsurface ice layer exists in this object. Another option is that there exists another mechanism which is capable of causing ejection of dust in a manner similar to water-ice sublimation.
A more sophisticated (but also more speculative) dust tail model indicates that the dust ejection was localized and originated on the southern hemisphere of the nucleus, with rotation parameters =180∘, obliquity =95∘, and a rotation period of 3 hours. These parameters can be confirmed with further follow-up observations.
References
- Bowell et al. (1989) Bowell, E., Hapke, B., Domingue, D., Lumme, K., Peltoniemi, J., & Harris, A.W. 1989, in Asteroids II, Arizona University Press, Tucson, pp. 524–526
- Burns et al. (1979) Burns, J.A., Lamy, P.L., & Soter, S. 1979, Icarus, 40, 1
- Bus & Binzel (2002) Bus, S.J., & Binzel, R.P. 2002, Icarus, 158, 146
- Campins et al. (2010) Campins, H., Hargrove, K., Pinilla-Alonso, N., Howell, E.S., Kelley, M.S., Licandro, J., Mothé-Diniz, T., Fernández, Y., & Ziffer, J. 2010, Nature, 464, 1320
- Cepa et al. (2000) Cepa, J. et al. 2000, Proc. SPIE, vol. 4008, p. 623
- Cepa (2010) Cepa, J. 2010, Highlights of Spanish Astrophysics V, Astrophysics and Space Science Proceedings, Springer-Verlag, p. 15
- Cox (2000) Cox, A. 2000, Allen’s Astrophysical Quantities (fourth ed), Springer-Verlag, New York
- Finson & Probstein (1968) Finson, M., & Probstein, R. 1968, ApJ, 154, 327
- Fugukita et al. (1996) Fukugita, M., Ichikawa, T., Gunn, J.E., Doi, M., Shimasaku, K., & Schneider, D.P. 1996, Astron. J. 111, 1748
- Fulle (1989) Fulle, M. 1989, Astron. Astrophys., 217, 283
- Fulle (2004) Fulle, M. 2004, in Comets II, ed. M. C. Festou, H. U. Keller, & H. A. Weaver (Tucson, AZ: Univ. Arizona Press), 565
- Hsieh & Jewitt (2006) Hsieh, H.H., & Jewitt, D. 2006, Science, 312, 561
- Jewitt et al. (2010) Jewitt, D., Annis, J., Soares-Santos, M. 2010, IAUCirc 9109
- Licandro et al. (2010a) Licandro, J., Tozzi, G.P., Liimets, T., Haver, R, Buzzi, L. 2010a, IAUCirc 9109
- Licandro et al. (2010b) Licandro, J., Tozzi, G.P., Liimets, T., Cabrera-Lavers, A., Gomez, G. 2010b, CBET 2134
- Monet et al. (2003) Monet, D.G., Levine, S.E., Canzian, B. et al. 2003, AJ125, 984
- Moreno et al. (2004) Moreno, F., Lara, L.M., Muñoz, O., López-Moreno, J.J., and Molina, A. 2004, ApJ, 613, 1263
- Moreno (2009) Moreno, F. 2009, ApJS, 183, 33
- Nakamura & Fujiwara (1991) Nakamura, A., & Fujiwara, A. 1991, Icarus, 92, 132
- Rivkin & Emery (2010) Rivkin, A.S., & Emery, J.P. 2010, Nature, 464, 1322
- Whipple (1951) Whipple, F. 1951, ApJ, 113, 464

| UT date | Telescope | (AU) | (AU) | Nucleus -mag | |
|---|---|---|---|---|---|
| 14 Jan 2010 | NOT 2.56 m | 2.013 | 1.039 | 5.53 | 23.30.4 |
| 17 Jan 2010 | GTC 10.4 m | 2.014 | 1.047 | 7.20 | 23.50.3 |
| 21 Jan 2010 | WHT 4.2 m | 2.016 | 1.061 | 9.32 | 23.20.3 |
| 23 Jan 2010 | NOT 2.56 m | 2.016 | 1.065 | 9.87 | – |