The dependence of AGN activity on stellar and halo mass in Semi-Analytic Models.
Abstract
AGN feedback is believed to play an important role in shaping a variety of observed galaxy properties, as well as the evolution of their stellar masses and star formation rates. In particular, in the current theoretical paradigm of galaxy formation, AGN feedback is believed to play a crucial role in regulating star formation activity in galaxies residing in relatively massive haloes, at low redshift. Only in recent years, however, has detailed statistical information on the dependence of galaxy activity on stellar mass , parent halo mass and hierarchy (i.e. centrals or satellites) become available. In this paper, we compare the fractions of galaxies belonging to different activity classes (star-forming, AGN and radio active) with predictions from four different and independently developed semi-analytical models. We adopt empirical relations to convert physical properties into observables ( emission lines, OIII line strength and radio power). We demonstrate that all models used in this study reproduce the observed distributions of galaxies as a function of stellar mass and halo mass: star forming galaxies and the strongest radio sources are preferentially associated with low-mass and high-mass galaxies/haloes, respectively. However, model predictions differ from observational measurements in many respects. All models used in our study predict that almost every dark matter halo and/or galaxy should host a bright radio source, while only a small (few per cent) fraction of galaxies belong to this class in the data. In addition, radio brightness is expected to depend strongly on the mass of the parent halo mass in the models, while strong and weak radio galaxies are found in similar environments in data. Our results highlight that the distribution of AGN activity as a function of stellar mass provides one of the most promising discriminants between different gas accretion schemes.
keywords:
galaxies: formation - galaxies: evolution - galaxies:active1 Introduction
In the last decade, a consensus has grown that there is a strong correlation between the presence of active galactic nuclei (AGN) powered by gas accretion onto Super Massive Black Holes (SMBHs), and the properties of their host galaxies. From the observational viewpoint, well defined correlations (Kormendy & Richstone, 1995; Magorrian et al., 1998; Ferrarese & Merritt, 2000; Gebhardt et al., 2000; Marconi & Hunt, 2003; Häring & Rix, 2004) between the mass of SMBHs () and the stellar mass, luminosity and velocity dispersion of the spheroidal component of the host galaxy point towards a joint evolution of these two components and a self regulated growth of the system. The details of the relative growth of the two components are, however, still uncertain (for a critical discussion, see e.g. Peng et al. 2006; Zheng et al. 2009).
From the theoretical viewpoint, AGNs have long been thought to represent a transition phase in galaxy evolution, with no significant influence on the evolution of the physical properties of galaxies as a function of cosmic time. Nowadays, this view has changed, and AGNs are viewed as a crucial “ingredient” in galaxy evolution. Very luminous AGNs (i.e. quasars) release tremendous amounts of energy on very short time-scales, eventually triggering powerful galactic winds, that can deplete the cold gas reservoir of the host galaxies, and quench their star formation activity (Di Matteo et al., 2005; Monaco & Fontanot, 2005; Pounds & Page, 2006; Ganguly & Brotherton, 2008). In addition, in order to reproduce the red colour and low levels of star formation of local massive galaxies, a viable physical mechanism is required so as to quench the predicted strong cooling flows in relatively massive haloes at low redshift. Low luminosity radio AGNs provide an elegant solution to this problem (Bower et al., 2006; Croton et al., 2006; Sijacki et al., 2007): radio jets, accelerated by the central engine, can efficiently transport energy from central regions outward, offsetting cooling onto the central regions (Binney & Tabor, 1995; Ruszkowski & Begelman, 2002; Kaiser & Binney, 2003).
In galaxy formation models, high accretion events are usually associated with galaxy mergers, that can destabilise large amounts of cold gas in the colliding galaxies and drive it towards the centre of the merger remnant. Observational data indicate a strong correlation between mergers and enhanced star formation rates in ultra luminous infrared galaxies (Sanders & Mirabel, 1996; Barton et al., 2000; Pasquali et al., 2004; Woods et al., 2006; Lin et al., 2007; Li et al., 2008). At the same time, theoretical studies have pointed out that the rapid inflow of cold gas towards the centre may feed the central SMBH and produce a luminous quasar phase (Negroponte & White, 1983; Barnes & Hernquist, 1996; Monaco et al., 2000; Granato et al., 2001; Cattaneo et al., 2005). The feedback arising from this process is thermal, i.e. originating from the coupling of a fraction of the QSO bolometric luminosity with the interstellar medium. In addition, simulations show that, in the case of a merger between two almost equal-mass galaxies, the remnant morphology is spheroidal (i.e. dominated by random orbits, Barnes 1992, Walker et al. 1996). Therefore, if the bulk of SMBH growth and the formation of the galactic spheroids are both linked to major mergers, this scenario provides an elegant explanation for the strong correlations observed between these two galactic components (Kauffmann & Haehnelt, 2000; Volonteri et al., 2003; Hopkins et al., 2005, 2006).
Another form of feedback, associated with radio activity, is believed to play an important role in quenching cooling flows at the centre of massive clusters. The development of radio jets might be connected with low accretion rates, analogously to what happens for X-ray binaries (see e.g. Jester 2005). In this scenario, the dominant mode for AGN feedback is the injection of mechanical energy into the ICM, associated with the development of X-ray cavities inflated by the relativistic jets (Bîrzan et al., 2004; McNamara & Nulsen, 2007). The physical state of the accretion flow, as well as the spin of the SMBHs are thought to play a role in determining the accretion rate efficiency (see e.g. Fanidakis et al. 2009), but details about the physical mechanisms leading to the loss of angular momentum of the gas, the subsequent accretion of material onto the SMBH, and the conversion of mechanical into thermal energy are still to be understood.
The physical processes mentioned above span from the Mpc scale of galaxy mergers to the sub-pc scale of accretion discs and their dependence on physical properties of galaxies (i.e. gas fractions, gas density, morphological type) are still uncertain. Therefore, a semi-analytic approach that couples a statistical (or numerical) description of the growth of the cosmic structure with simple (yet physically and/or observationally motivated) prescriptions for the various physical processes at play, provides an efficient and valid tool to test specific physical assumptions and to efficiently explore the parameter space defined by each model.
The recent analysis of the SDSS data carried out by Pasquali et al. (2009) has opened new interesting prospects for a detailed comparison with predictions from theoretical models. This analysis has taken advantage of the group catalogue defined by Yang et al. (2007) applying a halo-based group finder (Yang et al., 2005) to the New York University Value-Added Galaxy Catalogue (Blanton et al., 2005), based on SDSS-DR4 (Adelman-McCarthy et al., 2006). The group finder provides an estimate of the parent Dark Matter (DM) halo mass () of each galaxy group/cluster, as well as of the “hierarchy” (i.e. the central or satellite nature) for all galaxies. Stellar masses estimates () are computed using the observed relation between the stellar mass-to-light ratio and the galaxy colour (Bell et al., 2003). The same group catalogue has been used in a series of paper (Weinmann et al., 2006; van den Bosch et al., 2008; Kimm et al., 2009; Weinmann et al., 2009; Pasquali et al., 2010) to investigate the dependence of galaxy properties on stellar mass, environment and hierarchy. In particular, Kimm et al. (2009) have used the same group catalogue to study the empirical dependence of star formation activity on internal galaxy properties and large-scale environment, and have compared observational measurements with results from semi-analytic models. These studies have shown that most models including some prescriptions for AGN feedback reproduce reasonably well the observed dependence of the red/passive fraction as a function of stellar mass and halo mass for central galaxies. The same models, however, produce too large a fraction of red and passive satellite galaxies.
Pasquali et al. (2009, P09 hereafter) have extended this analysis by matching the group catalogue with the catalogue of emission line fluxes by Kauffmann et al. (2003), with the National Radio Astronomy Observatory Very Large Array Sky Survey (NVSS; Condon et al. 1998), and the Faint Images of the Radio Sky at Twenty centimetres (FIRST; Becker et al. 1995). P09 defined four different “activity” classes. Star-forming galaxies (SFGs) were separated from AGN host galaxies using line-flux ratios and (the so-called BPT diagram, Baldwin et al. 1981). Radio sources detected at were split into sources with low (LRA) and high (HRA) radio activity. Using this matched catalogue, P09 studied the environmental dependence of galaxy activity, as well as its dependence on the galaxy stellar mass. They showed, in particular, that SFGs are preferentially low-mass galaxies living in relatively small haloes, optical AGN activity is linked to intermediate mass galaxies and environments, while radio galaxies mainly reside in massive cluster galaxies. Given the strong stellar-halo mass correlation for central galaxies, it is unclear whether the activity levels for these galaxies are more strongly related to their stellar or halo mass. As for satellite galaxies, P09 found that the dependence of their galaxy activity on halo mass is about four times weaker than that on stellar mass, i.e. activity in satellites is suppressed with respect to central galaxies of similar mass.
In this work, we present a detailed comparison between the P09 observational data and predictions of four different semi-analytic models. This paper is organised as follows: in sec. 2 we describe the different semi-analytic models we consider in this study, while in sec. 3 we discuss our strategy for converting model predictions into observational quantities. In sec. 4, we then compare these predictions with the results presented in P09. Finally, we discuss our results and give our conclusions in sec. 5.
2 Models
In this paper, we consider predictions from four independently developed theoretical models for galaxy formation. In particular, we consider the most recent implementations of four different Semi-Analytic Models (SAMs, see e.g. Baugh 2006 for a recent review) for galaxy formation and evolution, in the concordance CDM cosmology: morgana (Monaco et al., 2007), the Kang & van den Bosch (2008) model (KVB08 hereafter), the Somerville et al. (2008) model (SHC08 hereafter), the Wang et al. (2008) model (WDL08 hereafter). In these models, the evolution of the baryonic component is followed by means of an approximate description of the physical processes at play (such as gas cooling, star formation and feedback) and of their interplay with gravitational processes (i.e. dynamical friction, tidal stripping and two body mergers), linked to the assembly of the large scale structure of the Universe. These “recipes” include a number of parameters which are usually fixed by comparing model predictions with a set of low-redshift observations. Despite their simplified approach, SAMs have turned into a flexible and widely used tool to explore a broad range of specific physical assumptions, as well as the interplay between different physical processes.
We refer to the original papers for a detailed description of the modelling adopted for the various physical processes considered (see also Fontanot et al. 2009 for a comparison between the morgana, WDL08 and SHC08 models). In the following, we will focus on the modelling of gas accretion onto SMBHs and different modes of AGN feedback. All models are based on an analytical or numerical description for the redshift evolution of the mass and number density of dark matter haloes (i.e merger trees111The WDL08 and KVB08 models use merger trees extracted from N-body simulations (Wang et al. 2008 and Jing & Suto 2002 respectively); morgana uses the Lagrangian semi-analytic code pinocchio (Monaco et al., 2002), and SHC08 use a method based on the Extended Press-Schechter formalism, described in Somerville & Kolatt (1999).). The cosmological parameters adopted are slightly different (see table 1); we make no attempt to correct the results, since we expect these small differences to have negligible influence on model predictions (Wang et al., 2008). In all cases, the mass resolution is sufficient to resolve galaxies with stellar mass larger than . In the following, we parameterise the Hubble constant as .
| Model | ||||
|---|---|---|---|---|
| Pasquali et al. (2009) (P09) | — | — | ||
| morgana | ||||
| Kang et al. (2005) | ||||
| Somerville et al. (2008) | ||||
| Wang et al. (2008) |
Gas inside DM haloes cools and condenses primarily via atomic cooling and thermal Bremsstrahlung, and forms a rotationally supported disc. Star formation is modelled using simple empirical (Schmidt-Kennicutt-like) recipes; supernovae and stellar winds deposit both thermal and kinetic energy into the cold gas and might re-heat or expel part of this gas; galaxy mergers might trigger “bursts” of star formation and play an important role in triggering AGN activity. The details of the modelling of these processes differ among the four SAMs we consider in this paper.
We recall that the WDL08 and KVB08 models explicitly follow the evolution of DM substructures, until tidal truncation and stripping reduce their mass below the resolution limit of the simulation (for details, see De Lucia & Blaizot 2007 and Kang et al. 2005 respectively). Satellite galaxies are then assigned a residual survival time, which is roughly twice222A fudge factor of accounts for recent findings that the classical formula systematically under-estimates merger times computed from numerical simulations (e.g. Boylan-Kolchin et al., 2008; Jiang et al., 2008) the value computed using the classical dynamical friction formula (Binney & Tremaine, 1987). SHC08 and morgana model the evolution of DM substructures using analytic recipes based on the fitting formulae proposed by Boylan-Kolchin et al. (2008) and Taffoni et al. (2003), respectively. A detailed comparison between these different formulations is given in De Lucia et al. (2010).
All models follow the growth of SMBHs at the centre of model galaxies, and differentiate between the so-called “bright-mode” (or “QSO-mode”) and “radio-mode” associated with the efficient production of radio jets. In the following, we discuss in more detail the modelling adopted for these physical processes.
-
•
Wang et al. (2008). This model represents a generalisation of the De Lucia & Blaizot (2007) model to the WMAP3 cosmology assumed in the Wang et al. (2008) simulations. Predictions from the model presented in De Lucia & Blaizot (2007) applied to the Millennium Simulation are publicly available333see http://www.mpa-garching.mpg.de/millennium/. In this model, the “bright-mode” is triggered by galaxy-galaxy mergers following the approach originally proposed by Kauffmann & Haehnelt (2000), and extended to minor mergers by Croton et al. (2006): during each merger (both minor and major) a fraction of the cold gas in the progenitors is assumed to be accreted on the SMBH at the centre of the merger remnant (the pre-existing SMBHs are assumed to merge instantaneously). The total accreted mass during the merger event is parameterised as:
(1) where represents the baryonic ratio between the progenitor galaxies (defined such as ). According to the above equation, equal mass mergers result in stronger accretion rates than minor mergers between galaxies with similar amounts of cold gas. This is to be expected as numerical simulations show that major mergers are responsible for a stronger dynamical response and a more rapid infall of gas towards the centre. is a free parameter, chosen by requiring the model to fit the local relation between the BH mass and the mass of the hosting spheroid (Häring & Rix, 2004).
“Radio-mode” feedback is implemented as in Croton et al. (2006) and is assumed to result from the accretion onto the central BH of hot gas from a static atmosphere. The accretion is assumed to be continuous and is described by the phenomenological recipe:
(2) where is the fraction of the total halo mass in form of hot gas and . We note that in their original paper, Croton et al. (2006) demonstrate that this formulation is consistent with expectations of theoretical models based on the analytical results of Bertschinger (1989) and on a Bondi-Hoyle model for BH feeding. The amount of energy injected by the AGN into the intra cluster medium (ICM) through this channel is:
(3) where represents the conversion efficiency of rest mass to energy. The efficiency of gas heating by AGN is assumed to be independent of the halo mass.
-
•
Kang & van den Bosch (2008). The “bright-mode” is modelled as in Kauffmann & Haehnelt (2000) and is associated with major and minor mergers:
(4) is a free parameter, again calibrated using the observed relation between the mass of the BH and the mass of hosting spheroid.
The “radio-mode” is modelled assuming that the energy injected from the central SMBH is proportional to its Eddington Luminosity and that the heating efficiency scales as a power law of (Kang et al., 2006):
(5) where is a free parameter, fixed by requiring the model to fit the bright end of the local galaxy luminosity function.
Another important feature of this model is the treatment of hot gas associated to recently accreted satellites. The other models adopted in this study assume that the hot gas reservoir is instantaneously stripped when galaxies are accreted onto larger systems and become satellites. As argued by many authors (see e.g Weinmann et al. 2006), this assumption is probably too strong, and results in red satellite fractions significantly higher than observed. KVB08 show that by assuming a constant stripping rate over a timescale of Gyrs, the model is able to predict a fraction of blue satellites which is in qualitative agreement with observations (see also Wang et al. 2007).
-
•
Somerville et al. (2008). The model used in this study is discussed in detail in SHC08, but uses the updated bulge formation model discussed in Hopkins et al. (2009). Other minor changes include a new calibration of the galaxy formation parameters, appropriate for a WMAP5 cosmology. In this model, the “bright-mode” is associated with merger events, following the prescriptions proposed by Hopkins et al. (2007) and based on a suite of -body simulations of galaxy-galaxy mergers (Robertson et al., 2006; Cox et al., 2006). For each merger event, the mass of the final spheroidal component is computed following Hopkins et al. (2009), and the final mass of the SMBH is estimated using the simulation-calibrated relation (Hopkins et al., 2007):
(6) where represents the “effective” gas fraction (defined as the sum of the cold gas masses in the merging galaxies, divided by their total baryonic masses). The accretion of gas onto the SMBH is modelled through the generalised functional form for QSO light curves proposed by Hopkins et al. (2005): the SMBH grows at the Eddington rate, until it reaches a critical mass . Further accretion is then reduced by the onset of a pressure driven outflow (which eventually halts the accretion) and this regime is described by a power-law decline. The critical mass is defined as:
(7) where is a free parameter. In this scenario, bright QSOs spend most of their lifetime in the power-law decline phase, but most of the BH mass is accreted at the Eddington rate. If the mass of the SMBH is already larger than the critical mass, no accretion is allowed on the central object. This might happen frequently at low redshift, where the most massive spheroidal galaxies have already assembled most of their stellar mass.
The “radio-mode” feedback implementation is based on the assumption that low-accretion events are fuelled by Bondi-Hoyle accretion:
(8) where represents the gas sound speed and is the density of the hot gas at the accretion radius. By combining eq. 8 with the isothermal cooling flow solution (Nulsen & Fabian, 2000), it is possible to rewrite the accretion rate as:
(9) where is the virial temperature of the hot gas, is the Boltzmann constant, and represents the cooling rate. is a free parameter. The energy that is effectively injected into the ICM (the heating rate) is obtained by converting the accreted matter into energy:
(10) In the standard model, and .
-
•
morgana. In this model, the growth of SMBHs is modelled following the prescriptions by Umemura (2001) and Granato et al. (2004) (see Fontanot et al. 2006 for more details on the actual implementations of these prescriptions in morgana). The model follows the evolution of a cold gas reservoir around the SMBH, which is assumed to form through the same physical processes that drive the formation of the bulge. The formation rate of the reservoir is then assumed to be proportional to the star formation rate in the bulge :
(11) where and are free parameters444Note that with this parameter choice, the equation simplifies to: ., fixed by requiring the model to reproduce the evolution of the QSO luminosity function (Fontanot et al., 2006). The cold gas mass in the reservoir can be accreted onto the SMBHs, once it loses its residual angular momentum, through turbulence, magnetic field or radiation drag. The BH accretion rate is assumed to be determined by the viscosity of the accretion disc and is written as (Granato et al., 2004):
(12) where is the velocity dispersion of the bulge, and is chosen following the theoretical arguments by Granato et al. (2001). The accretion rate is limited at the Eddington rate. In this model, it is the rate of accretion that determines the ‘nature’ of the feedback: the “bright-mode” is associated with accretion rates larger than 1 per cent of the Eddington limit, while the “radio-mode” is sustained by lower accretion rates. For the radio-mode, morgana assumes a bolometric luminosity:
(13) The efficiency () at which the emitted energy heats the hot halo component is assumed to scale with the circular velocity of the host halo and, in the standard implementation, is normalised to the value at
(14) For consistency with the other models, in the following we neglect this virial velocity dependence (i.e. we set ). We have verified, however, that its inclusion does not change significantly the results discussed below.
For high accretion rates, the model assumes that only 10 per cent of the bolometric luminosity is available to heat the halo gas (considering that about 10 per cent of quasars are radio loud). We note that, at variance with the other models used in this study, in morgana the gas accreted during the “radio-mode” is cold. In addition, gas accretion is always associated with some star formation, responsible for the final loss of angular momentum of the accreted material. As a result, massive central galaxies in this model are too blue (because they form too many stars) with respect to the observational determinations.
In this paper, we carry out a comparison between predictions from the 4 models introduced above and the observational measurements presented in P09. We stress that none of the models used has been tuned to reproduce the observational data considered. Therefore, model results discussed below should be considered as genuine model predictions.
This section illustrates that the implementations of SMBH growth and AGN feedback adopted in the models considered in this study, differ in a number of details. We note, in particular, that minor mergers do trigger accretion onto BHs in three models used in this study (morgana, SHC08 and WDL08), satellite-satellite merger are considered in KVB08 and WDL08, while only morgana considers also accretion of gas triggered by disk instabilities555We note that disk instabilities represent the main channel for SMBH growth in the Bower et al. (2006) model, which is not considered in this study.. In addition, AGN driven winds are explicitly included only in morgana and SHC08. The SHC08 model includes a more sophisticated treatment for the evolution of the AGN during the “bright” phase, explicitly including a description for the AGN light curve.
The models also share a number of similarities. “Bright-mode” feedback is tightly linked to galaxy-galaxy mergers in WDL08, KVB08 and SHC08. morgana adopts a different scheme, but also for this model the high accretion rates needed in the “bright-mode” regime are often associated with galaxy-galaxy mergers. In addition, three of the four models used in this study (WDL08, KVB08 and SHC08) assume (either directly or indirectly as in the SHC08 model) a strong relation between the mass of the parent DM halo and the strength of the “radio-mode” feedback.
The variety of assumptions made to model these processes reflect the fact that they are still not well understood, and that almost all details of the physical mechanisms acting on sub-pc scale (i.e. the final stages of angular momentum loss, the properties of the inner accretion disc, the AGN light curves, and the collimation of the radio jet) are still largely unconstrained.
3 Converting model predictions into observed quantities
In order to compare model predictions with the P09 results, we need to convert the predicted accretion and star formation rates into ‘observables’. These include, in particular, the luminosity of the and OIII lines, and the radio power at 1.4 GHz used for the estimate of the star formation, AGN and radio activity, respectively. All model predictions presented below are constructed by considering a cosmological box centred at , and converting predicted intrinsic luminosities into apparent fluxes.
3.1 OIII line luminosity
Predicted accretion rates onto SMBHs are converted into an estimate for the luminosity of the OIII line () as illustrated below. For each model galaxy, we compute the expected bolometric luminosity associated with each accretion event in the “bright-mode” as:
| (15) |
where we assume . We then estimate using an empirical approach based on the results obtained by Heckman et al. (2005) from a sample of type I and II AGNs. These authors estimate the mean luminosity ratio between the hard X-ray luminosity () and for a sample of X-ray selected local AGNs, and find that:
| (16) |
To make use of this result, we first convert bolometric luminosities into by means of the bolometric correction proposed by Marconi et al. (2004). We also test an alternative conversion based on the bolometric correction proposed by Wu (2009) for a sample of type I AGNs:
| (17) |
and we find that the two approaches provide similar results. We note that the Heckman et al. (2005) sample includes both Type I and type II AGNs, while the Wu (2009) sample includes only Type I AGNs. Since type I AGNs were explicitly excluded in the P09 analysis, we will show only results based on the Heckman et al. (2005) conversion in the following. In addition, following Simpson (2005), we estimate the Type I fraction as a function of and we use it as a statistical correction to account for the removal of Type Is in P09. We have verified that this correction does not affect our conclusions.
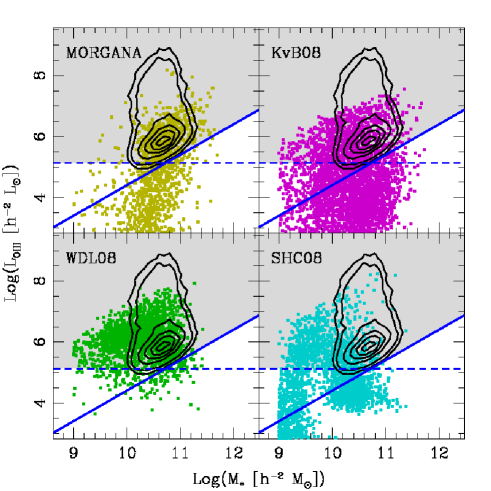
In order to compare model predictions with the P09 results, we also need to apply similar ‘selection criteria’. The main requirement for a galaxy to belong to the AGN class in the P09 analysis is the detection of the OIII emission line in the SDSS spectra, above a well defined signal-to-noise level . This implies that, if the OIII flux is relatively weak compared to the continuum, and the galaxy is at a relatively large distance (so that its total flux is low), the continuum will be noisy and the emission line will not be detected at sufficient . In fig. 1, we plot the distribution of model galaxies (coloured symbols) in the -stellar mass plane, and compare it with the distribution measured from the SDSS: black contours show the , , , , , and per cent number density levels from the observed data. This figure illustrates the consequences of assuming a limit: OIII lines of comparable luminosity are more easily detected in less massive galaxies, due to the lower continuum level. Using the distributions shown in fig. 1, we define a composite selection criterion for our model galaxies. We first convert the observed flux limit (, de-reddened as described in Kauffmann et al. 2003) into an intrinsic luminosity limit at . This limit is marked with a blue dashed line in fig. 1. We then define a cut in specific luminosity, , which mimics the selection (blue solid line) and is chosen to approximately follow the per cent number density level of the observed distribution. The shaded area in fig. 1 highlights the region occupied by selected model galaxies.
We note that predictions from the four models used in this study populate different regions of the -stellar mass diagram. This suggests that, in principle, we could use these distributions to discriminate between competing models. Unfortunately, however, observational data do not cover a region of this space that is wide enough to provide conclusive evidence in favour of or against a given model. As an example, WDL08 and KVB08 show similar results in the high luminosity region: this is expected, since these two models use very similar prescriptions for gas accretion during merger events. In morgana, the distribution of AGNs shows a strong dependence on , similar to that obtained for radio galaxies (see sec. 3.3). We remind that in this model gas accretion is treated in the same way in both regimes, the only difference being the amount of accreted gas. The correlation between and originates from the strong dependence of gas accretion on and .
3.2 Star formation rate and line strength
Predicted star formation rates are converted into line luminosities () using the observationally calibrated relation proposed by Kennicutt (1998):
| (18) |
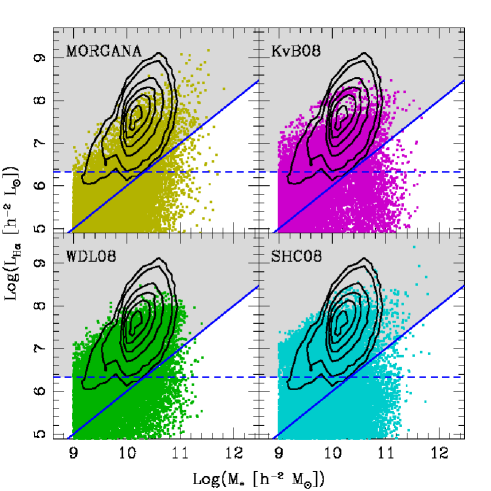
Since the luminosity provides, on average, an estimate of only half the total SFR, assuming an average escape fraction of ionising photons (Kennicutt, 1998), we reduce the estimated using the above equation by a factor of two. In fig. 2, we show the distributions of predicted luminosities, and compare them with the observed distribution. In order to compare model predictions with the data presented in P09, we adopt a strategy similar to that illustrated in sec. 3.1. We first convert the apparent flux limit ( de-reddened as described in Kauffmann et al. 2003), into an intrinsic luminosity at (blue dashed line). We then define a cut in specific luminosity (blue solid line), that is chosen to approximately follow the per cent density level and mimics the cut adopted in the observational analysis. As in fig. 1, the shaded region highlights the selected area. We do not attempt to take into account other possible biases due to fibre size (see e.g. Brinchmann et al. 2004 for a discussion): we remind the reader that the observational estimates are based on fibre spectra, while SAMs provide total integrated SFRs for model galaxies. Predictions from the four models used in this study populate very similar regions of the - diagram.
3.3 Radio
In order to estimate the radio emission associated with the “radio-mode”, we assume that an energy corresponding to is converted into mechanical work that radio AGNs exert on the surrounding medium. We then use the relation calibrated by Willott et al. (1999) to determine the luminosity at (, in units of ):
| (19) |
In eq. 19, is a correction factor that takes into account the systematics in the observational measurements, and we assume the average value (Hardcastle et al. 2007, see also Shankar et al. 2008). We then compute the Ghz luminosity () assuming a fixed spectral shape , and apply the same detection limits of P09 (). The full conversion between and can be thus expressed by the following expression:
| (20) | |||||
We have also tested an alternative method based on the empirical conversion calibrated on the results by Best et al. (2006):
| (21) |
and verified that this does not affect our conclusions.
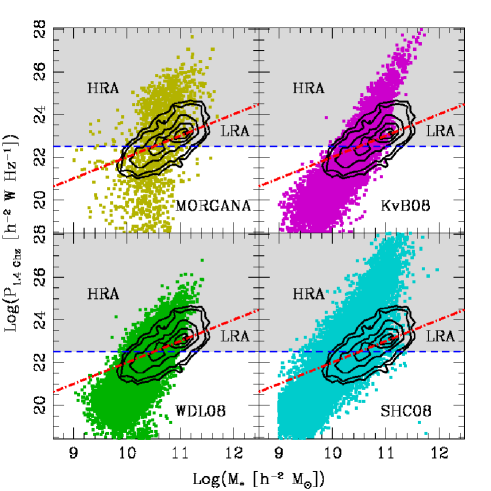
As in P09, we split radio galaxies into two samples with low and high radio activity (LRA and HRA respectively) using a specific luminosity threshold of . We stress that in the following we do not consider radio emission associated with high accretion rates in the models, i.e. we neglect the radio loud fraction of QSOs (see e.g. Jiang et al. 2007). Our estimates of the fraction of radio galaxies are therefore lower limits: however we want to test the conservative hypothesis that all radio activity is linked to the “radio-mode” feedback. In fig. 3, we compare model predictions with the observed radio power distribution. In order to mimic the observational selection criteria, we apply the same apparent radio flux limit of . In fig. 3, we show the corresponding value for the intrinsic power at , as a blue dashed line, while the red dot-dashed line marks the threshold between the LRA and HRA classes. The selection criteria illustrated above influence our results, particularly for the LRA sources, but do not affect our conclusions. We will come back to this issue later. We note that models predict the correct dependence of on , with more massive galaxies hosting brighter sources, but the correlation between radio power and stellar mass appears to be stronger in the models with respect to the observational results by P09. The strong dependence of on in the WDL08 and KVB08 models results from the strong correlation assumed between the strength of “radio-mode” feedback and the mass of the parent DM halo. Since this mode is active only for central galaxies, and the stellar mass of these is strongly related to the parent halo dark matter mass, this results in a strong correlation between the intensity of radio-power and the galaxy stellar mass. Although SHC08 adopt a different model governing the efficiency of radio mode activity, as already shown in SHC08 their model produces a nearly identical dependence on halo mass as that used in WDL08. Therefore we expect a similar dependence on stellar mass as well. Among the models used in this study, morgana shows the weakest dependence of on . This is due to the fact that in this model, gas accretion onto SMBHs in the “radio-mode” regime is not directly linked to , but is mainly regulated through and (eq. 12).
4 Results
Following P09, we consider 4 different activity classes: SFG, AGN, LRA and HRA (see previous sections), and consider separately central and satellite galaxies. For each class, we define the fraction of model galaxies belonging to the activity class and with a given property (i.e. stellar mass and parent halo mass). We note that in the P09 analysis, SFGs and AGNs are separated using the BPT diagram. In this paper, we simply assume that all model galaxies with a detectable OIII line belong to the AGN class. Therefore, our model predictions for represent an upper limit, since AGNs hosted in SFGs may be misclassified in the observations. However, as we will see in the following, we do not expect this contamination to affect our conclusions. We note that, although the SFG and AGN classes are mutually exclusive (as in the real data), the same objects might be classified as radio sources, both for model predictions and for observations.
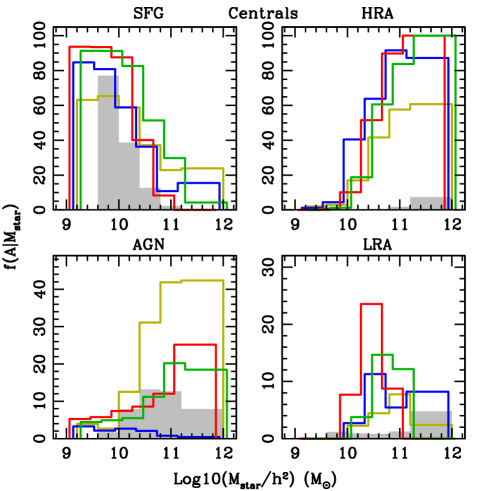
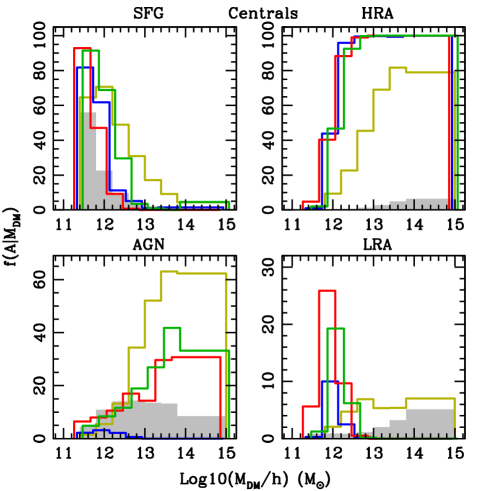
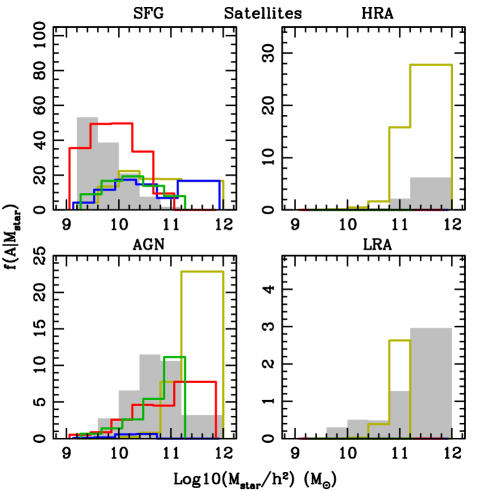
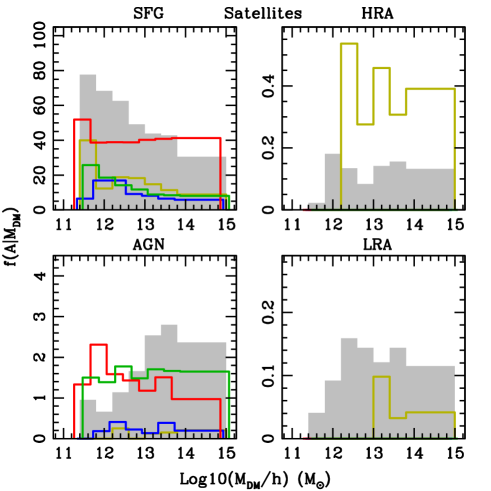
In fig. 4 and 5, we show the and fractions, for central and satellite galaxies respectively. Model predictions are shown using coloured histograms (yellow, red, green, blue for the morgana, KVB08, WDL08, SHC08 models respectively), while shaded histograms show the observational measurements by P09. When constructing the model histograms, we apply additional cuts to our model samples by considering only galaxies with predicted stellar masses between and living in DM haloes of , as in P09. Typical uncertainties in observed fractions are of the order of for the SFG and AGN classes, for HRA/LRA centrals, in for HRA/LRA satellites, and in for HRA/LRA satellites.
We first consider central galaxies (fig. 4): the peak of the mock distributions shift from low-mass haloes for SFGs to high-mass haloes for HRA sources, in agreement with the observational measurements. In addition, we find that the distributions as a function of galaxy stellar mass are quite similar to those computed as a function of halo mass. This is expected because of the strong correlation between halo mass and stellar mass for central galaxies in SAMs (see e.g. Yang et al. 2008).
The figure, however, illustrates several discrepancies between model predictions and observations. The KVB08, SHC08 and WDL08 models reproduce the observed decrease of the fraction of star forming galaxies with increasing stellar and halo mass. morgana predicts higher than observed, especially at intermediate masses. This is due to the inefficient quenching of star formation in massive galaxies, leading to a large fraction of active massive central galaxies (Kimm et al., 2009). Both and are more skewed towards higher masses with respect to the observational measurements. The SHC08 model represents an exception, with a very low predicted fraction of AGNs, and a distribution that peaks at the low-mass end, both as a function of stellar and parent halo mass. This is due to the modelling adopted for QSO activity during mergers: this model considers a critical BH mass, above which no further accretion is allowed onto SMBHs. At low redshift, most massive galaxies already host massive BHs, so that most mergers at low redshift happen between galaxies whose combined BH masses are larger than the critical mass adopted in this model and further accretion onto the remnant BHs is suppressed. In contrast, the other three models used in this study still allow gas accretion onto the SMBH of the remnant galaxy, as long as the progenitors still have some gas left (i.e. if the merger is not “dry”).
The predicted fractions of radio sources as a function of both stellar and halo masses are larger than the observed ones by at least one order of magnitude: all models predict that more than per cent of central galaxies in relatively massive haloes should host a strong radio galaxy. The disagreement with observations is particularly large for : almost all models predict that all haloes are associated with a detectable radio galaxy. Also the shapes of the and distributions predicted from the models used in this study differ from those observed (this holds also for and ): bright and faint sources are associated with larger and smaller haloes respectively, while the observed distributions for these two classes are very similar. The strong correlation between radio activity and halo mass is expected in the KVB08, WDL08 and SHC08 models, given the assumed proportionality between accretion rates in the “radio-mode” and the mass of the parent dark matter halo. It is interesting that the typical halo mass that separates the HRA and LRA classes is similar in these models, despite the different dependence on circular velocity adopted. We anticipate that the precise value of this “transition” mass depends on the details of the conversion of heating rates into radio luminosity (we will come back to this in sec. 5). morgana is the only model that predicts a significant population of low-luminosity radio galaxies for central galaxies in massive haloes, but both the predicted fractions and the distributions differ from those observed. We stress that the shape of the LRA distribution depends on the ‘selection criteria’ adopted for model galaxies (see sec. 3.3). A decrease in the assumed flux limit translates into larger samples of faint radio sources: this affects only the low stellar and halo mass tail of the distributions, leading to larger values. As a consequence, the peak of the model distributions moves towards lower masses, increasing the discrepancy with the observational measurements.
We now consider the and fractions for satellite galaxies. Most models predict distributions that differ from those observed. The distributions are significantly affected by the assumed selection criteria at their low-mass end: when considering all satellite galaxies above the minimum stellar mass observed, morgana, SHC08 and WDL08 models predict an approximately constant fraction of SFGs as a function of . morgana and SHC08 predict large for high-mass satellites, while the lowest fractions of SF satellites are given by the WDL08 model. Only the KVB08 model predicts the correct dependence of the fraction of star forming satellites on stellar mass, although the predicted fractions are larger than observed. It is interesting that the same model predicts an almost flat distribution for , while the other models are able to catch, at least qualitatively, the slight decrease of SFGs with increasing halo mass. These results highlight that the modelling adopted in KVB08, despite being able to provide the correct fraction of satellite as a function of galaxy colours, does not fully reproduce the observed SF activity of satellites as a function of halo mass.
The distribution of is too skewed towards high . The only exception is again the SHC08 model, which shows a small peak of activity at , but does not reproduce the observed total fractions of satellites with AGN activity. is approximately flat in the models, in qualitative agreement with data. We stress that in the morgana, WDL08 and SHC08 models, by construction, no AGN activity is expected in satellites, since none of them allows accretion of new cold gas onto satellites and satellite-satellite mergers at the same time. Therefore, the galaxy-galaxy mergers responsible for the satellite AGNs must occur when the primary component is still the central galaxy of its own DM halo. If the event is immediately followed by a halo merger, and the remnant galaxy becomes a satellite, it is classified as an AGN satellite. Thanks to its implementation of stripping and the modeling of satellite-satellite mergers, a population of ”true” AGN satellites is present in the KVB08 model. However, as shown in fig. 5, the contribution from this channel is quite small, i.e. are similar to those predicted by the other models.
The KVB08, WDL08, SHC08 models do not allow “radio-mode” feedback in satellite galaxies by construction. This does not hold for morgana that provides a population of satellite radio galaxies with roughly the correct distributions. In addition, in this model and have similar shape and the fraction of satellites with AGN activity does not vary significantly as a function of halo mass. This is due to the assumed modelling of the cold gas reservoir around SMBHs: recently accreted satellites, despite being instantaneously stripped of their hot gas, are still able to sustain a short period of accretion, until their cold gas reservoir is completely depleted.
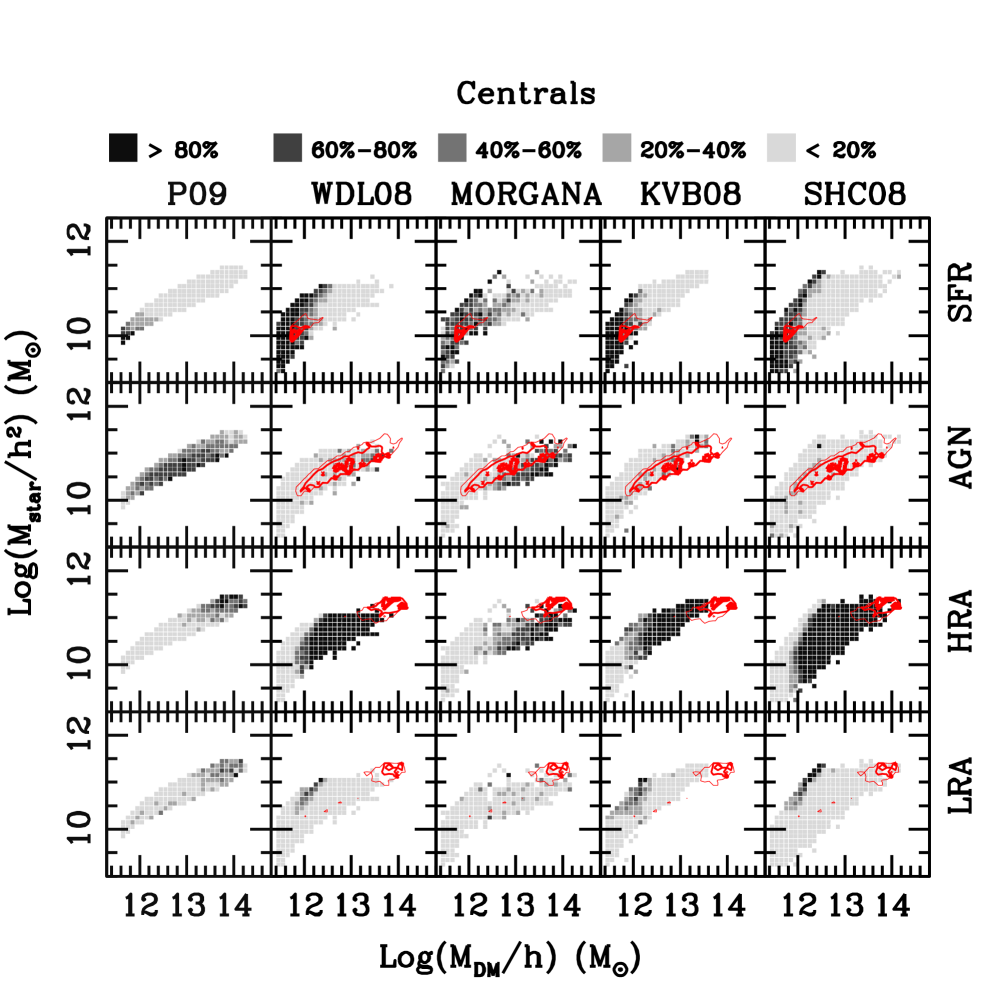
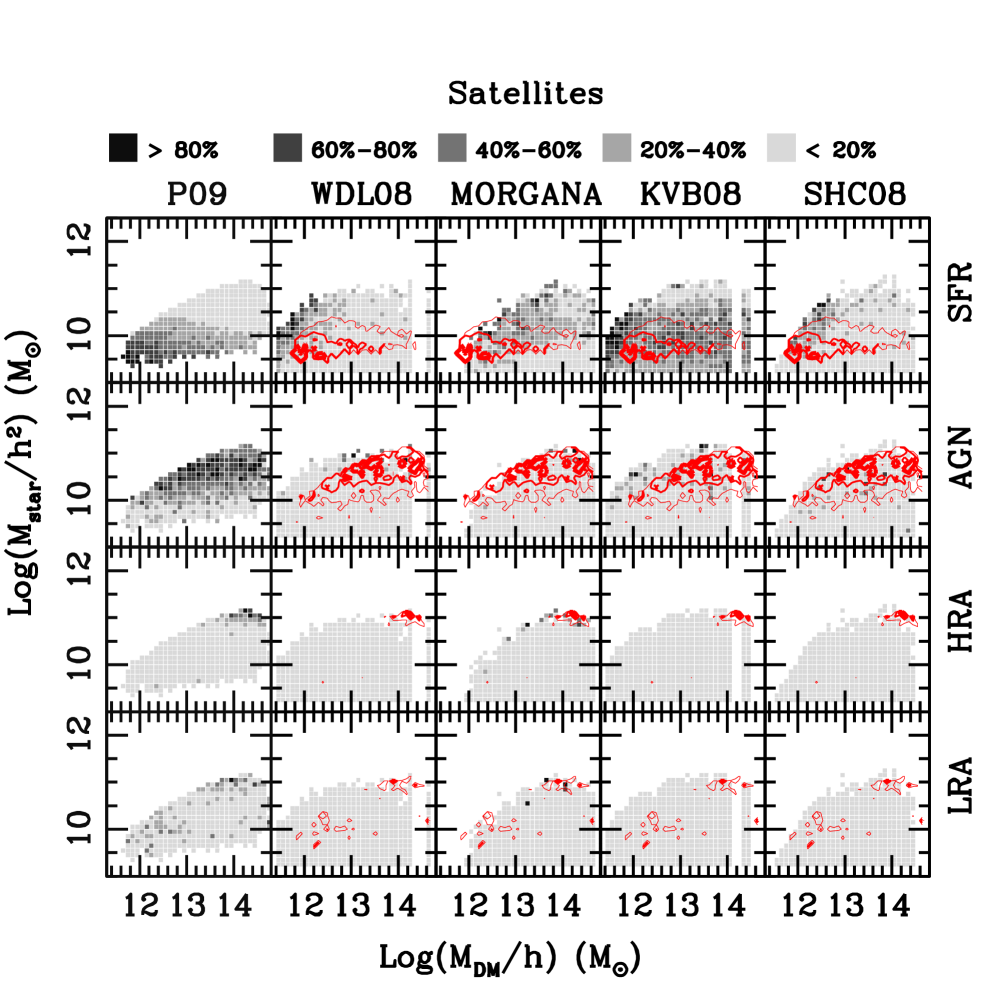
In fig. 6 and 7 we show the bidimensional distributions for central and satellite galaxies respectively. These figures provide a useful summary of the behaviors just discussed. In these figures, darker grey levels correspond to increasing , and are normalized to their highest value in each activity class. In the leftmost column, we show the observed distributions (as in P09, see their fig.6). In each model panel, we show the contours corresponding to the , , number density levels in observed data. The strong correlation between stellar mass and halo mass for central galaxies is clearly visible in fig. 6, and it prevents us from decoupling the role of environment from that of stellar mass, as discussed in P09. Fig. 6 confirms that all models are able to reproduce the different distributions of SF and HRA centrals in the space: the former class is dominated by low-mass centrals, living in small DM haloes, while HRA galaxies are preferentially associated with more massive systems. AGN centrals in KVB08, WDL08 and morgana tend to populate the upper right region of the diagram, while AGN centrals in the SHC08 model are more likely associated with intermediate mass systems. Finally, LRA and HRA centrals populate different regions of this space in the models, in contrast with observational measurements. For all models, the overall agreement with the observed distributions is rather poor.
For satellite galaxies, the activity seems to be more strongly related to stellar mass than halo mass, in qualitative agreement with observational data. In particular, fig. 7 highlights that active satellites are preferentially found in regions of the diagram which are contiguous to those populated by active centrals belonging to the same activity class. This confirms that, in all models, active satellites are recently accreted objects. A different treatment for hot gas stripping in newly accreted satellites, as proposed in KVB08, leads to a better description of the distributions of SF satellites, which in this model populate a wider area in this diagram and show a stronger dependence on than on .
5 Summary and Discussion
In this paper, we compare predictions from four different semi-analytic models for galaxy formation with the observational data discussed in Pasquali et al. (2009). These data allow, for the first time, a careful comparison with theoretical models, also in terms of the galaxy hierarchy (i.e. their nature of centrals or satellites). This is important for a better understanding of the limitations and successes of current models, in which central and satellite galaxies correspond to rather distinct evolutionary paths. The theoretical models considered in this study adopt different assumptions for the various modes of AGN activity: all of them distinguish between a bright phase (usually referred to as “bright-mode” or “QSO-mode”) and a low accretion efficiency phase which is usually associated with the development of radio jets able to offset cooling flows (the so called “radio-mode”). In this paper, we focus on four activity classes, defined by the star formation rate, optical AGN activity, and radio emission associated with the radio-mode. Model accretion rates onto SMBHs are converted into ‘observables’ by means of empirical relations calibrated on local samples. We have attempted to reproduce the observational selections and checked the influence of different selection criteria: the absolute fractions of galaxies in each activity class as a function of both stellar and parent halo mass depend on the details of both the selection criteria and the adopted conversions. The shapes of the predicted distributions, however, are not significantly affected.
We show that the four models used in this study predict in a few cases quite different distributions as a function of stellar and parent halo mass. This is interesting and demonstrates that the observational measurements can discriminate between different physical models. In particular, we have shown that in all models SFGs are typically low-mass galaxies residing in low-mass haloes, while powerful radio galaxies are expected to reside at the center of relatively massive haloes. Although this is in qualitative agreement with observations, we highlight a number of model “failures”:
-
•
almost all massive centrals are predicted to host a detectable radio source, at variance with observations.
-
•
The and distributions differ from those observed for all models. In particular, it is possible to identify a typical halo mass separating a ‘low’ from ‘high’ radio activity (LRA and HRA classes). The precise value of this ‘transition’ halo mass depends on the adopted modelling for AGN feedback. We stress that in the WDL08 and KVB08 models this result is not surprising, since accretion rates onto BHs during radio-mode are explicitly related to the mass of the parent halo (see eq. 2 and 5 respectively).
-
•
The distributions of are generally too skewed towards high stellar and halo masses with respect to the observational measurements. This results in activity levels that are too high for massive central galaxies in clusters. The SHC08 model is an exception as the predicted distribution in this case is skewed towards low-mass galaxies and low-mass haloes. In addition, this models predicts total fractions of galaxies with AGN activity that are significantly lower than those predicted by the other three models used in this study. We ascribe these differences to the inclusion of a critical mass for BH accretion: since at low redshift most massive galaxies have central SMBHs with masses already larger than their critical mass, further accretion onto these objects is suppressed.
-
•
The distribution of star forming centrals in the plane is well reproduced by the WDL08, KVB08 and SHC08 models, while morgana predicts a wider distribution of SF galaxies, extending towards larger stellar and halo masses. This is due to an inefficient quenching of star formation in massive haloes.
-
•
The KVB08 model exhibits the best agreement with the observed distributions of star forming galaxies. In particular, the model predicts the correct dependence of the on (although with a slightly higher normalization), both for centrals and satellites. As the other models used in this study, however, it does not reproduce the observed distribution of SF satellites as a function of parent halo mass.
The disagreement between the predicted and observed fractions of radio sources represents a potentially serious problem for current models of galaxy formation and evolution. The inclusion of ”radio-mode” AGN feedback in theoretical models of galaxy formation was originally motivated by the need for a powerful energy source, that would be able to counteract gas cooling at the centres of massive haloes. Most models assume a strong dependence of radio-mode feedback on the parent halo mass: this is essential in order to reproduce the observed rapid cutoff at the bright/massive end of luminosity/mass function, and the old stellar population ages of massive galaxies. As a consequence of this assumption, these models predict that essentially all massive galaxies should be associated with a bright radio source, while observational data suggest that faint and bright radio sources are found in similar environments in equal numbers. If, as suggested by our analysis, we need to assume a weaker dependence on halo mass, then this physical process might not be capable of offsetting the cooling flows alone. This is hinted at by the fact that the model which predicts the lowest fraction of radio sources (morgana) is, at the same time, the model which provides the worst agreement with the distribution of star forming galaxies.
Details of the adopted modelling for BH growth (e.g. the duty cycle) might also play a role. In particular, the models used here neglect completely one relevant aspect of AGN activity: the presence of well defined duty cycles of radio sources (of the order of for radio-loud galaxies). In SAMs, both the “radio-mode” feedback and the cooling rate are quantities integrated over a well defined time interval. The “quenching of the cooling flow” is therefore assumed to happen on this time-scale. These assumptions are supported by results from Best et al. (2006), who showed that the time-averaged energy output from recurrent radio-sources in elliptical galaxies balances almost perfectly the energy losses from the hot gas in the parent DM halo. If we assume that the radio sources are active only for a fraction of the adopted time-step, the number of sources detected as radio galaxies will be reduced. At , however, the typical time-steps adopted in all SAMs we consider are shorter than or of the same order as the duty cycle of radio loud galaxies, so that the expected correction should be small. Even for models with integration time-scales larger than the typical radio-loud duty cycle, it is not clear if a shorter “radio-mode” feedback activity would be as efficient in quenching cooling flows. In fact, the present approach assumes the heating term to perfectly offset the cooling when the “radio”-mode is “on”, while the thermal evolution of halo gas proceeds as if there had never been a radio source present when the “radio”-mode is “off”. This implies that introducing a duty cycle in these models would probably reduce the efficiency of quenching cooling flows666We note that morgana already implements some of these ideas (although in a very simplified way). This model explicitly follows the build up of a gas reservoir around SMBHs as a result of cold gas infall. Gas is then accreted onto the central object on a time-scale determined by the viscosity of the accretion disc, and originates collimated jets, that heat the halo gas. The time-interval between the onset of the cooling flow and its quenching through jet heating could be considered the equivalent of a ‘duty cycle’. We have shown that this model performs slightly better in terms of the radio active fraction (not all massive galaxies host a bright radio source), but it is not able to quench cooling flows as efficiently as needed to reproduce the observed colours and star formation rates of massive galaxies (see e.g. Fontanot et al. 2007, Kimm et al. 2009).. In addition, we note that even fixing the total fractions of radio galaxies, we would still have the problem that their distributions do not reproduce observational measurements. Therefore, more realistic scenarios have to be considered. These should take into account, for example, that radio jets may add entropy to the gas, and that after a complete radio cycle, the halo gas would be hotter and less dense than before the onset of the “radio”-mode. Cooling will thus proceed at a slower rate. Our models also do not take into account any possible “excess” in the radiated energy (with respect to the energy needed to quench cooling flows), which could unbind the gas from the halo, again suppressing cooling on a longer timescale (see e.g., Bower et al. 2008). Therefore, an accurate modelling of AGN duty cycles requires a deep revision of AGN feedback schemes in SAMs that goes beyond the aims of this paper.
Our results suggest that either 1) more sophisticated modelling of the triggering of radio activity and its impact on the thermodynamics of the surrounding gas is needed or 2) other processes, such as gravitational heating by infalling satellites or gas clumps (Khochfar & Ostriker, 2008; Dekel & Birnboim, 2008), are important in preventing the gas in massive halos from cooling.
In all the models, active satellites represent the tail of the corresponding distributions computed for central galaxies. This is due to our simplified treatment of satellite evolution. In particular, three out of the four models used here assume that the hot halo associated with a galaxy is instantaneously stripped once the galaxy becomes a satellite. The cold gas available is rapidly turned into stars and ejected in the surrounding medium, never being reicorporated onto the same galaxy. The KVB08 model represents an improvement, as it allows satellite galaxies to keep their hot gas reservoir for some fixed time after accretion. We have shown, however, that this model does not reproduce the correct dependence of SF activity as a function of halo mass.
Our work confirms that statistical studies aimed at disentangling the role of stellar mass and parent halo mass (i.e. the “nature” versus “nurture”) are hampered by the pivotal role played by central galaxies in the models. An improved description of the evolution of satellite galaxies is of fundamental importance to understand the relative importance of various physical processes responsible for galaxy activity in different environments.
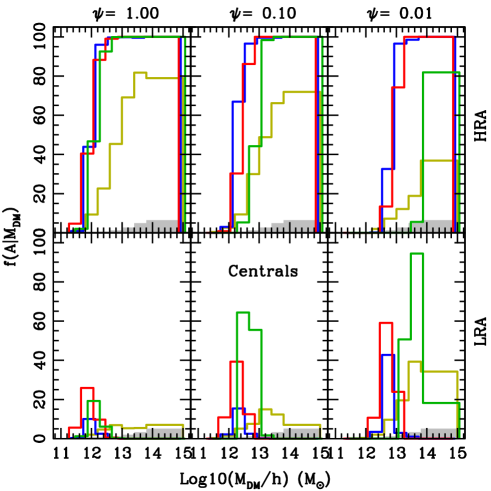
A number of additional caveats should be considered. In order to compare model predictions with observational data, we had to apply a number of corrections and empirical conversions. In particular the adopted conversion from estimated accretion rates into radio luminosities is critical. To test the robustness of our results, we repeated our analysis by assuming that only a fraction of the heating energy is sufficient to originate jets and bubbles (parametrized as ). With respect to the results presented in fig. 3, this implies lower radio luminosities associated with the “radio-mode”, but preserves the shape of the predicted distributions as a function of . We show in fig. 8 the and distributions corresponding to three different values of . This figure shows that the number of sources in each class depends significantly on the value assumed for , but our main conclusions are unchanged: the distributions for LRA and HRA galaxies are different and there are too many HRA model galaxies with respect to observational measurements. It is however interesting that the peak of the LRA distribution tends to shift towards higher masses as decreases, thus slightly reducing the disagreement with the observed distributions.
Our analysis highlights new problems for current models of galaxy formation and evolution, and in particular for currently adopted models of AGN feedback. Although this mechanism helps to solve a number of long-standing issues, it provides a poor match to the observed fractions and distributions of radio galaxies. From an observational point of view, a better and more complete sampling of the activity levels as a function of different physical properties and environment, would be crucial to confirm and strengthen our conclusions. Important additional information will come from relating galaxy activity with other physical properties. For example, recent studies have suggested that the relation between activity and morphological type can provide interesting constraints on the accretion mechanisms (Georgakakis et al., 2009), and on the co-evolution between host galaxies and their central SMBHs (Schawinski et al., 2010).
Acknowledgments
We are grateful to Pierluigi Monaco and Francesco Shankar for useful and stimulating discussions. FF acknowledges the support of an INAF-OATs fellowship granted on ’Basic Research’ funds. GDL acknowledges financial support from the European Research Council under the European Community’s Seventh Framework Programme (FP7/2007-2013)/ERC grant agreement n. 202781.
References
- Adelman-McCarthy et al. (2006) Adelman-McCarthy J. K., Agüeros M. A., Allam S. S., Anderson K. S. J., Anderson S. F., Annis J., Bahcall N. A., Baldry I. K. e. a., 2006, ApJS, 162, 38
- Baldwin et al. (1981) Baldwin J. A., Phillips M. M., Terlevich R., 1981, PASP, 93, 5
- Barnes (1992) Barnes J. E., 1992, ApJ, 393, 484
- Barnes & Hernquist (1996) Barnes J. E., Hernquist L., 1996, ApJ, 471, 115
- Barton et al. (2000) Barton E. J., Geller M. J., Kenyon S. J., 2000, ApJ, 530, 660
- Baugh (2006) Baugh C. M., 2006, Reports of Progress in Physics, 69, 3101
- Becker et al. (1995) Becker R. H., White R. L., Helfand D. J., 1995, ApJ, 450, 559
- Bell et al. (2003) Bell E. F., McIntosh D. H., Katz N., Weinberg M. D., 2003, ApJS, 149, 289
- Bertschinger (1989) Bertschinger E., 1989, ApJ, 340, 666
- Best et al. (2006) Best P. N., Kaiser C. R., Heckman T. M., Kauffmann G., 2006, MNRAS, 368, L67
- Binney & Tabor (1995) Binney J., Tabor G., 1995, MNRAS, 276, 663
- Binney & Tremaine (1987) Binney J., Tremaine S., 1987, Galactic dynamics, Princeton, NJ, Princeton University Press, 747 p.
- Bîrzan et al. (2004) Bîrzan L., Rafferty D. A., McNamara B. R., Wise M. W., Nulsen P. E. J., 2004, ApJ, 607, 800
- Blanton et al. (2005) Blanton M. R., Schlegel D. J., Strauss M. A., Brinkmann J., Finkbeiner D., Fukugita M., Gunn J. E., Hogg D. W., Ivezić Ž., Knapp G. R., Lupton R. H., Munn J. A., Schneider D. P., Tegmark M., Zehavi I., 2005, AJ, 129, 2562
- Bower et al. (2006) Bower R. G., Benson A. J., Malbon R., Helly J. C., Frenk C. S., Baugh C. M., Cole S., Lacey C. G., 2006, MNRAS, 370, 645
- Bower et al. (2008) Bower R. G., McCarthy I. G., Benson A. J., 2008, MNRAS, 390, 1399
- Boylan-Kolchin et al. (2008) Boylan-Kolchin M., Ma C.-P., Quataert E., 2008, MNRAS, 383, 93
- Brinchmann et al. (2004) Brinchmann J., Charlot S., White S. D. M., Tremonti C., Kauffmann G., Heckman T., Brinkmann J., 2004, MNRAS, 351, 1151
- Cattaneo et al. (2005) Cattaneo A., Blaizot J., Devriendt J., Guiderdoni B., 2005, MNRAS, 364, 407
- Condon et al. (1998) Condon J. J., Cotton W. D., Greisen E. W., Yin Q. F., Perley R. A., Taylor G. B., Broderick J. J., 1998, AJ, 115, 1693
- Cox et al. (2006) Cox T. J., Jonsson P., Primack J. R., Somerville R. S., 2006, MNRAS, 373, 1013
- Croton et al. (2006) Croton D. J., Springel V., White S. D. M., De Lucia G., Frenk C. S., Gao L., Jenkins A., Kauffmann G., Navarro J. F., Yoshida N., 2006, MNRAS, 365, 11
- De Lucia & Blaizot (2007) De Lucia G., Blaizot J., 2007, MNRAS, 375, 2
- De Lucia et al. (2010) De Lucia G., Boylan-Kolchin M., Benson A. J., Fontanot F., Monaco P., 2010, MNRAS, 406, 1533
- Dekel & Birnboim (2008) Dekel A., Birnboim Y., 2008, MNRAS, 383, 119
- Di Matteo et al. (2005) Di Matteo T., Springel V., Hernquist L., 2005, Nature, 433, 604
- Fanidakis et al. (2009) Fanidakis N., Baugh C. M., Benson A. J., Bower R. G., Cole S., Done C., Frenk C. S., 2009, ArXiv e-prints
- Ferrarese & Merritt (2000) Ferrarese L., Merritt D., 2000, ApJ, 539, L9
- Fontanot et al. (2009) Fontanot F., De Lucia G., Monaco P., Somerville R. S., Santini P., 2009, MNRAS, 397, 1776
- Fontanot et al. (2006) Fontanot F., Monaco P., Cristiani S., Tozzi P., 2006, MNRAS, 373, 1173
- Fontanot et al. (2007) Fontanot F., Monaco P., Silva L., Grazian A., 2007, MNRAS, 382, 903
- Ganguly & Brotherton (2008) Ganguly R., Brotherton M. S., 2008, ApJ, 672, 102
- Gebhardt et al. (2000) Gebhardt K., Bender R., Bower G., Dressler A., Faber S. M., Filippenko A. V., Green R., Grillmair C., Ho L. C., Kormendy J., Lauer T. R., Magorrian J., Pinkney J., Richstone D., Tremaine S., 2000, ApJ, 539, L13
- Georgakakis et al. (2009) Georgakakis A., Coil A. L., Laird E. S., Griffith R. L., Nandra K., Lotz J. M., Pierce C. M., Cooper M. C., Newman J. A., Koekemoer A. M., 2009, MNRAS, 397, 623
- Granato et al. (2004) Granato G. L., De Zotti G., Silva L., Bressan A., Danese L., 2004, ApJ, 600, 580
- Granato et al. (2001) Granato G. L., Silva L., Monaco P., Panuzzo P., Salucci P., De Zotti G., Danese L., 2001, MNRAS, 324, 757
- Hardcastle et al. (2007) Hardcastle M. J., Evans D. A., Croston J. H., 2007, MNRAS, 376, 1849
- Häring & Rix (2004) Häring N., Rix H., 2004, ApJ, 604, L89
- Heckman et al. (2005) Heckman T. M., Ptak A., Hornschemeier A., Kauffmann G., 2005, ApJ, 634, 161
- Hopkins et al. (2009) Hopkins P. F., Cox T. J., Younger J. D., Hernquist L., 2009, ApJ, 691, 1168
- Hopkins et al. (2007) Hopkins P. F., Hernquist L., Cox T. J., Robertson B., Krause E., 2007, ApJ, 669, 45
- Hopkins et al. (2005) Hopkins P. F., Hernquist L., Martini P., Cox T. J., Robertson B., Di Matteo T., Springel V., 2005, ApJ, 625, L71
- Hopkins et al. (2009) Hopkins P. F., Somerville R. S., Cox T. J., Hernquist L., Jogee S., Kereš D., Ma C., Robertson B., Stewart K., 2009, MNRAS, 397, 802
- Hopkins et al. (2006) Hopkins P. F., Somerville R. S., Hernquist L., Cox T. J., Robertson B., Li Y., 2006, ApJ, 652, 864
- Jester (2005) Jester S., 2005, ApJ, 625, 667
- Jiang et al. (2008) Jiang C. Y., Jing Y. P., Faltenbacher A., Lin W. P., Li C., 2008, ApJ, 675, 1095
- Jiang et al. (2007) Jiang L., Fan X., Ivezić Ž., Richards G. T., Schneider D. P., Strauss M. A., Kelly B. C., 2007, ApJ, 656, 680
- Jing & Suto (2002) Jing Y. P., Suto Y., 2002, ApJ, 574, 538
- Kaiser & Binney (2003) Kaiser C. R., Binney J., 2003, MNRAS, 338, 837
- Kang et al. (2005) Kang X., Jing Y. P., Mo H. J., Börner G., 2005, ApJ, 631, 21
- Kang et al. (2006) Kang X., Jing Y. P., Silk J., 2006, ApJ, 648, 820
- Kang & van den Bosch (2008) Kang X., van den Bosch F. C., 2008, ApJ, 676, L101
- Kauffmann & Haehnelt (2000) Kauffmann G., Haehnelt M., 2000, MNRAS, 311, 576
- Kauffmann et al. (2003) Kauffmann G., Heckman T. M., Tremonti C., Brinchmann J., Charlot S., White S. D. M., Ridgway S. E., Brinkmann J., Fukugita M., Hall P. B., Ivezić Ž., Richards G. T., Schneider D. P., 2003, MNRAS, 346, 1055
- Kauffmann et al. (2003) Kauffmann G., Heckman T. M., White S. D. M., Charlot S., Tremonti C., Peng E. W., Seibert M., Brinkmann J., Nichol R. C., SubbaRao M., York D., 2003, MNRAS, 341, 54
- Kennicutt (1998) Kennicutt Jr. R. C., 1998, ApJ, 498, 541
- Khochfar & Ostriker (2008) Khochfar S., Ostriker J. P., 2008, ApJ, 680, 54
- Kimm et al. (2009) Kimm T., Somerville R. S., Yi S. K., van den Bosch F. C., Salim S., Fontanot F., Monaco P., Mo H., Pasquali A., Rich R. M., Yang X., 2009, MNRAS, 394, 1131
- Kormendy & Richstone (1995) Kormendy J., Richstone D., 1995, ARA&A, 33, 581
- Li et al. (2008) Li C., Kauffmann G., Heckman T. M., Jing Y. P., White S. D. M., 2008, MNRAS, 385, 1903
- Lin et al. (2007) Lin L., Koo D. C., Weiner B. J., Chiueh T., Coil A. L., Lotz J., Conselice C. J., Willner S. P., Smith H. A., Guhathakurta P., Huang J., Le Floc’h E., Noeske K. G., Willmer C. N. A., Cooper M. C., Phillips A. C., 2007, ApJ, 660, L51
- Magorrian et al. (1998) Magorrian J., Tremaine S., Richstone D., Bender R., Bower G., Dressler A., Faber S. M., Gebhardt K., Green R., Grillmair C., Kormendy J., Lauer T., 1998, AJ, 115, 2285
- Marconi & Hunt (2003) Marconi A., Hunt L. K., 2003, ApJ, 589, L21
- Marconi et al. (2004) Marconi A., Risaliti G., Gilli R., Hunt L. K., Maiolino R., Salvati M., 2004, MNRAS, 351, 169
- McNamara & Nulsen (2007) McNamara B. R., Nulsen P. E. J., 2007, ARA&A, 45, 117
- Monaco & Fontanot (2005) Monaco P., Fontanot F., 2005, MNRAS, 359, 283
- Monaco et al. (2007) Monaco P., Fontanot F., Taffoni G., 2007, MNRAS, 375, 1189
- Monaco et al. (2000) Monaco P., Salucci P., Danese L., 2000, MNRAS, 311, 279
- Monaco et al. (2002) Monaco P., Theuns T., Taffoni G., Governato F., Quinn T., Stadel J., 2002, ApJ, 564, 8
- Negroponte & White (1983) Negroponte J., White S. D. M., 1983, MNRAS, 205, 1009
- Nulsen & Fabian (2000) Nulsen P. E. J., Fabian A. C., 2000, MNRAS, 311, 346
- Pasquali et al. (2004) Pasquali A., Gallagher J. S., de Grijs R., 2004, A&A, 415, 103
- Pasquali et al. (2010) Pasquali A., Gallazzi A., Fontanot F., van den Bosch F. C., De Lucia G., Mo H. J., Yang X., 2010, MNRAS, 407, 937
- Pasquali et al. (2009) Pasquali A., van den Bosch F. C., Mo H. J., Yang X., Somerville R., 2009, MNRAS, 394, 38
- Peng et al. (2006) Peng C. Y., Impey C. D., Rix H., Kochanek C. S., Keeton C. R., Falco E. E., Lehár J., McLeod B. A., 2006, ApJ, 649, 616
- Pounds & Page (2006) Pounds K. A., Page K. L., 2006, MNRAS, 372, 1275
- Robertson et al. (2006) Robertson B., Bullock J. S., Cox T. J., Di Matteo T., Hernquist L., Springel V., Yoshida N., 2006, ApJ, 645, 986
- Ruszkowski & Begelman (2002) Ruszkowski M., Begelman M. C., 2002, ApJ, 581, 223
- Sanders & Mirabel (1996) Sanders D. B., Mirabel I. F., 1996, ARA&A, 34, 749
- Schawinski et al. (2010) Schawinski K., Urry C. M., Virani S., Coppi P., Bamford S. P., Treister E., Lintott C. J., Sarzi M. e. a., 2010, ApJ, 711, 284
- Shankar et al. (2008) Shankar F., Cavaliere A., Cirasuolo M., Maraschi L., 2008, ApJ, 676, 131
- Sijacki et al. (2007) Sijacki D., Springel V., Di Matteo T., Hernquist L., 2007, MNRAS, 380, 877
- Simpson (2005) Simpson C., 2005, MNRAS, 360, 565
- Somerville et al. (2008) Somerville R. S., Hopkins P. F., Cox T. J., Robertson B. E., Hernquist L., 2008, MNRAS, 391, 481
- Somerville & Kolatt (1999) Somerville R. S., Kolatt T. S., 1999, MNRAS, 305, 1
- Taffoni et al. (2003) Taffoni G., Mayer L., Colpi M., Governato F., 2003, MNRAS, 341, 434
- Umemura (2001) Umemura M., 2001, ApJ, 560, L29
- van den Bosch et al. (2008) van den Bosch F. C., Aquino D., Yang X., Mo H. J., Pasquali A., McIntosh D. H., Weinmann S. M., Kang X., 2008, MNRAS, 387, 79
- Volonteri et al. (2003) Volonteri M., Haardt F., Madau P., 2003, ApJ, 582, 559
- Walker et al. (1996) Walker I. R., Mihos J. C., Hernquist L., 1996, ApJ, 460, 121
- Wang et al. (2008) Wang J., De Lucia G., Kitzbichler M. G., White S. D. M., 2008, MNRAS, 384, 1301
- Wang et al. (2007) Wang L., Li C., Kauffmann G., De Lucia G., 2007, MNRAS, 377, 1419
- Weinmann et al. (2009) Weinmann S. M., Kauffmann G., van den Bosch F. C., Pasquali A., McIntosh D. H., Mo H., Yang X., Guo Y., 2009, MNRAS, 394, 1213
- Weinmann et al. (2006) Weinmann S. M., van den Bosch F. C., Yang X., Mo H. J., 2006, MNRAS, 366, 2
- Willott et al. (1999) Willott C. J., Rawlings S., Blundell K. M., Lacy M., 1999, MNRAS, 309, 1017
- Woods et al. (2006) Woods D. F., Geller M. J., Barton E. J., 2006, AJ, 132, 197
- Wu (2009) Wu Q., 2009, ApJ, 701, L95
- Yang et al. (2008) Yang X., Mo H. J., van den Bosch F. C., 2008, ApJ, 676, 248
- Yang et al. (2005) Yang X., Mo H. J., van den Bosch F. C., Jing Y. P., 2005, MNRAS, 356, 1293
- Yang et al. (2007) Yang X., Mo H. J., van den Bosch F. C., Pasquali A., Li C., Barden M., 2007, ApJ, 671, 153
- Zheng et al. (2009) Zheng X. Z., Bell E. F., Somerville R. S., Rix H., Jahnke K., Fontanot F., Rieke G. H., Schiminovich D., Meisenheimer K., 2009, ApJ, 707, 1566