Magnetic properties of exchange biased and of unbiased oxide/permalloy thin layers: a ferromagnetic resonance and Brillouin scattering study
Abstract
Microstrip ferromagnetic resonance and Brillouin scattering are used to provide a comparative determination of the magnetic parameters of thin permalloy layers interfaced with a non-magnetic (Al2O3) or with an antiferromagnetic oxide (NiO). It is shown that the perpendicular anisotropy is monitored by an interfacial surface energy term which is practically independent of the nature of the interface. In the investigated interval of thicknesses (5-25 nm) the saturation magnetisation does not significantly differ from the reported one in bulk permalloy. In-plane uniaxial anisotropy and exchange-bias anisotropy are also derived from this study of the dynamic magnetic excitations and compared to our independent evaluations using conventional magnetometry
I Introduction
In magnetically ordered solids, the magnetic properties near a surface or an interface may differ in many respects from the observed one inside the bulk neel ; bruno ; roussigne95 . These differences are attributed to the reduced symmetry, to the lower coordination number and to the availability and role of highly localised surface and interface states inducing modified magnetic structures, sources of interesting magnetic behaviours. These phenomena which are generally localised within a few atomic layers are phenomenologically treated by means of surface anisotropies which provoke spin rearrangements inside thin magnetic films bruno . This paper focuses on metallic permalloy/oxide interfaces, comparing the cases of a nonmagnetic oxide (Al2O3) with the case of an antiferromagnetic one (NiO). In this last situation, various interfacial effects have been put in evidence previously, such as hysteresis loop shifts and increased coercivity meiklejohn , training effects meiklejohn ; nogues and rotatable anisotropy mcmichael . In particular, the so called exchange bias field was discovered nearly 50 years ago meiklejohn and has given rise to a large number of experimental and theoretical publications nogues ; binek ; mcmichael ; nogues2005 ; berkowitz1999 ; stamps2000 . Up to now, most of the experimental studies are based on hysteretic measurements and interpreted in terms of exchange bias () and coercive () fields. In contrast, only few ferromagnetic resonance (FMR) and Brillouin light scattering (BLS) studies, analysing the dynamic magnetic properties of exchange biased bilayers, are available mcmichael ; stamps2000 ; stoecklein ; geshev ; blachowicz ; wee ; rezende1 ; zighem1 . The present paper takes advantage of both techniques (more explicitely; retro-BLS and microstrip(MS)-FMR in view of interpreting this dynamics in interfaced polycrystalline Ni81Fe19 thin films of various thicknesses. In addition, a careful examination of the interfaces was performed through high resolution electronic transmission microscopy (HRTEM) using a JEOL 3010 microscope (300 kV, LaB6, 0.19 nm point resolution).
The paper is organized as follows: in Section 2, we briefly describe the model used for the interpretation of the experimental data. Section 3 presents the two above cited techniques: BLS and MS-FMR. The experimental results are analysed and discussed in Section 4.
II Theoretical background
For an uncoupled permalloy layer, the volume magnetic energy density is written as:
| (1) |
where the first three terms stand for the Zeeman, the dipolar and the exchange contributions, respectively. The last term represents the anisotropy contribution and can be expressed as neel ; bruno ; roussigne95 :
| (2) |
In equation (2), is the magnetisation. The unit vector is normal to the film and consequently, represents a uniaxial perpendicular anisotropy parameter. In addition, is an in-plane unit vector and stands for an in-plane anisotropy parameter. In most cases, consists in an effective uniaxial anisotropy parameter which results from the addition of a bulk (presumably magnetocrystalline) term and of a surface term which depends on the film thickness :
| (3) |
The bulk term value was previously found to lie around 105 erg.cm-3 labrune2004 : as discussed in section 4 it is negligible compared to the experimental determination of . A similar partition (bulk + surface) could be done for the in-plane anisotropy, but, as shown in section IV, does not provide for useful conclusions.
We define, as usual, the uniaxial perpendicular and the uniaxial in-plane anisotropy fields and , respectively, as:
| (4) |
When the permalloy layer is interfaced with an antiferromagnetic layer, the magnetic energy density includes an additional contribution mcmichael :
| (5) |
In equation (5), and the in-plane vector allow for defining the unidirectional anisotropy. It is usual to introduce the exchange bias field :
| (6) |
The last term in equation (5) stands for a rotatable anisotropy mcmichael . It has not to be taken in consideration for determining the orientation of the magnetisation at equilibrium but it induces a so-called rotatable field in the equation of motion monitoring the dynamics:
| (7) |
Generally, is considered as an effective volume density arising from a surface contribution depending of two parameters, and : such an assumption provides and .
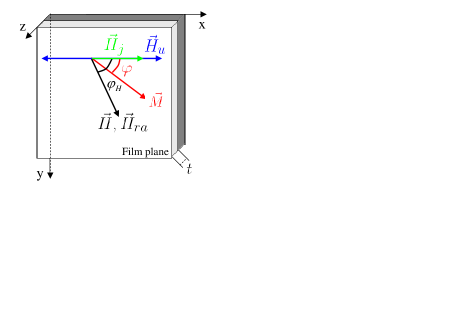
Figure 1 shows the above defined vectors and the used angular notations. In agreement with our experimental results discussed below we have taken parallel to : this provides simplifications which are not always satisfied zighem1 ; hill1 .
In the present work we specially focused on the uniform magnetic mode, the frequency and the linewidth of which were measured by MS-FMR. It results from the Landau-Lifshitz-Gilbert equation of motion that, for this mode, and are given by netzelmann :
| (8) |
In the above expressions and stands for the polar angles of , is the dimensionless Gilbert coefficient and is the effective gyromagnetic factor. For an in-plane applied field (), one obtains:
| (9) |
with
| and | |||
| (10) |
where is the demagnetizing field. The linewidth is given by:
| (11) |
In the case of low applied fields ( ;
is the effective demagnetizing field), the linewidth
expression reduces to:
| (12) |
In addition, the so-called DE mode damon was studied by BLS. Its
frequency depends on the wave vector . It is not given by
an analytic expression but it can be numerically calculated roussigne95 .
However, for the values, small compared to unity, involved
in our Brillouin study, an approximate analytic expression can be
obtained zighem2 ; stamps . It is given by equation (9), with the following
modified values of and :
| (13) |
is the exchange stiffness coefficient. Note that for , we retrieve the expression of the uniform mode.
III Experimental setups and samples
III.1 Experimental setups
The measurements were performed at room temperature using both MS-FMR
and BLS techniques. In MS-FMR the resonance is probed by sweeping
the frequency of a pumping RF field in presence of a fixed
applied magnetic field. More precisely, the amplitude of the applied
magnetic field is subject to a slight modulation at low frequency
( 140 Hz), thus allowing for a synchronous detection system. This
technique gives access to the first derivative of the RF absorption
versus the applied field. This absorption is generally described by
a lorentzian function. The main advantage, compared to conventional
FMR, consists in the availability of resonance studies with various
amplitudes of the applied field and not only with various directions.
Practically, the orders of magnitude of the in-plane anisotropy terms
do not allow for their determination through conventional FMR while
such determinations are easily performed using MS-FMR which is compatible
with the necessarily low values of the applied magnetic fields. However,
with MS-FMR, the rather large lack of spatial homogeneity of the RF
field is a source of distortions of the absorption signal which prevent
for very precise resonance frequency and linewidth evaluations counil ; counil1 .
BLS was investigated in order to study the dispersion of the propagating magnetic mode versus the wave-vector (in the so-called Damon-Eschbach geometry, which designates geometrical arrangements characterized by a wave-vector normal to the magnetisation at equilibrium). The appropriately polarized spectra were studied in retro-scattering conditions using a tandem Fabry-Pérot interferometer illuminated by a single-mode Ar+ ion laser at a wavelength of nm with a power of a few hundreds of mW. The sweeping of was obtained by varying the angle of incidence of the optical beam ( , where is the angle of incidence). In addition, some magnetic measurements were performed using a vibrating sample magnetometer (VSM), mainly in view of deriving coercive and bias fields from the observed magnetisation curves.
III.2 Studied Samples
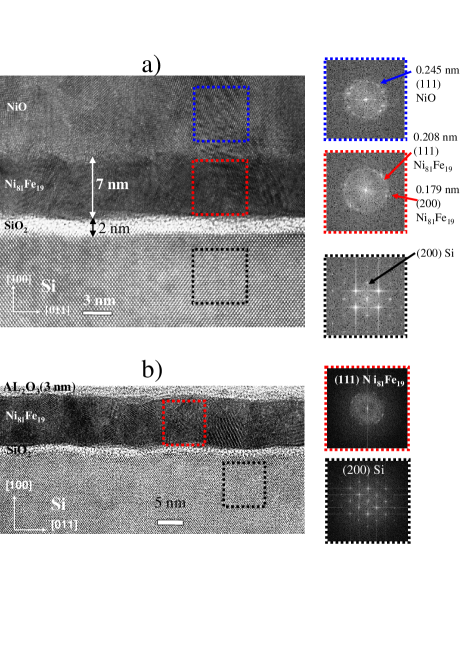
Two series of samples were elaborated using radio frequency sputtering on a silicon substrate covered by a thin (2 nm) SiO2 layer. In the first one, the NiO thickness is fixed to 80 nm and the permalloy thickness varies from 25 to 5 nm (25, 14, 9, 7.5, 6 and 5 nm). In the second one, the nickel oxide layer is replaced by a thin film (3 nm) of alumina (Al2O3) and the set of permalloy layers is unchanged : this second series defines a reference in order to evaluate the interfacial changes related to the antiferromagnetic/ferromagnetic boundary. High resolution transmission electron micrographs (HRTEM) were performed (see Figure 2) in view of getting information on the microstructure of each sub-layer in a given sample. The thicknesses are found in good agreement with the calculated ones from the deposition conditions. The NiO and the Ni81Fe19 films are well crystallized and composed of small crystallites with sizes of a few nm3). The NiO layers present columns around 5 nm in diameter and 30 nm in length. Moreover, no preferential texture is favoured, as attested by our electron diffraction studies (not shown here). This signifies that the NiO interface corresponds to a mixed structure including compensated and uncompensated magnetic moments. Nevertheless, the roughness of the interface does not exceed 0.5 nm (see Figure 2). Note also that the two series were studied in the absence of a preliminary cooling from the Néel temperature under a magnetic field applied in view of increasing the exchange bias. However, during the deposition a small residual in-plane magnetic field of 5 Oe is applied along , as above mentioned: it favours the interfacial exchange coupling.
IV Results and discussion
IV.1 Unbiased Al2O3/permalloy films
For this reference series the contribution , expressed
in equation (5), vanishes. The frequency and the linewidth of the uniform mode are expected
to only depend on the gyromagnetic factor , of the magnetisation
, of the uniaxial perpendicular anisotropy (), of
the uniaxial in-plane anisotropy () and of the damping ()
coefficients (and, indeed, of the sample thickness ). In principle
the study of their variations versus the amplitude and the direction
of an applied magnetic field allows for the evaluation of these magnetic
parameters. However, due to the limitations of the available precision,
the MS-FMR study is mainly efficient to give access to ,
and , assuming a given value of (we took
1.844 s-1.Oe-1 in agreement with the expected
value (2.1) of the effective factor ()).
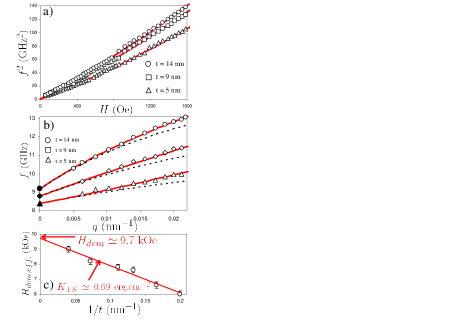
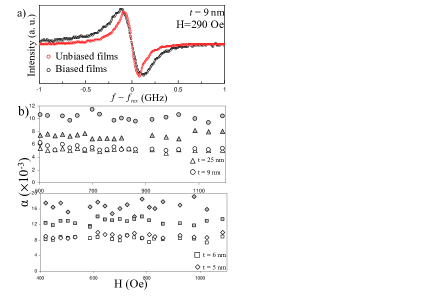
The variations of the frequency versus the amplitude (see Figure 3) and the direction (see Figure 5) of an in-plane applied field were studied. It results from the analysis of the data that the surface coefficient contributing to the perpendicular anisotropy does not depend on the studied sample. From its observed linear variation versus () we deduce a common value of the effective demagnetizing field at large thicknesses, equal to 9700 Oe (see Figure 3c). This value is very close to the reported one in bulk permalloy showing the same composition lykken ; rantschler . As mentioned in section 2, is not expected to exceed a few hundred Oe. With a rather good approximation, one can neglect this bulk anisotropy and conclude that, in the studied interval of thicknesses, all the samples show a saturation magnetisation practically equal to the measured one in the bulk material and are characterized by the same surface energy 0.69 erg.cm-2. Considering now the in-plane anisotropy, it is found very small, thus providing anisotropy fields of a few Gauss, with an easy axis parallel to the direction of the field induced during the elaboration process. In addition, the Gilbert damping model provides a satisfactory agreement of the observed linewidths: as expected from this model the deduced value of (see Figure 4b) does not depend on the applied field. It varies from one to another sample but always lies in the [0.005; 0.009] interval.
The anisotropy and magnetisation values calculated from the MS-FMR data provide a good fit of the Brillouin spectra: as written above, the dependence of the frequency is deduced from its variation versus the angle of incidence of the illuminating beam. When its direction is nearly normal to the film this frequency practically does not differ from the obtained one for the uniform mode, as illustrated on Figure 3b. For large values the contribution of the exchange stiffness constant is significant and has to be taken in account (see equation (13) and Figure 3b). For all the studied samples our measured value of is equal to erg.cm-1. However, this determination is rather approximate: to improve the precision it would be useful to observe the stationary magnetic modes belmegue which, due to limitations in the available amplitude of the applied field, were not accessible in the present study. The complete set of the magnetic parameters deduced for the studied series of unbiased Al2O3/permalloy films is given in Table 1.
| (nm) | (kOe) | (Oe) | |
| 25 | 9 | 5 | 5 |
| 14 | 8.2 | 5 | 6 |
| 9 | 7.8 | 5 | 5 |
| 7.5 | 7.6 | 5 | 7 |
| 6 | 6.6 | 5 | 9 |
| 5 | 6 | 5 | 8 |
| kOe; erg.cm-2; | |||
| erg.cm-1 | |||
| Table I: Unbiased Al2O3/permalloy films | |||
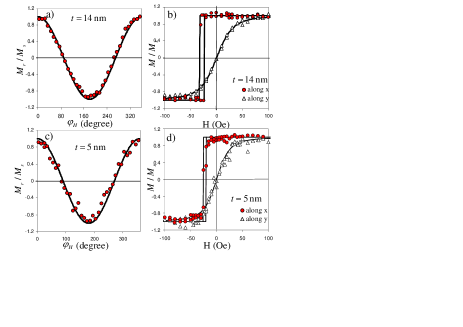
IV.2 Biased NiO/permalloy films
The magnetisation curves, recorded with an in-plane applied magnetic
field, clearly reveal an easy anisotropy axis and a bias field along the above
mentioned residual magnetic field applied in direction during
the deposition. Figure 5 shows examples of hysteresis graphs obtained
along easy and hard directions. It also presents the variation versus
of the remanent magnetisation after suppressing a saturating
magnetic field inclined of from . The results can
be interpreted in terms of a coherent uniform rotation model depending
of an energy density containing both contributions of a coercive field
() and of a bias field (). The obtained values of
() and of () are given in Table II. The MS-FMR measurements
allow for evaluating the parameters enumerated in the previous section
and, in addition, the bias and the rotatable fields appearing in such
biased structures.
The first important result concerns the effective
demagnetizing field: it practically does not differ from the measured
one in the unbiased films described in the previous subsection. We
then conclude to a perpendicular anisotropy coefficient mainly monitored
by a surface term . We derive: 0.65 erg.cm-2,
nearly the same value as in the unbiased samples (0.69 erg.cm-2).
Here again, the saturation magnetisation does not appreciably differ
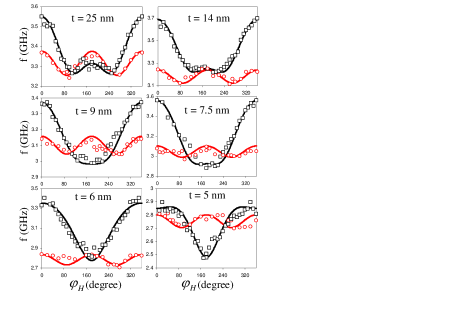
from the reported value in the bulk lykken ; rantschler . The in-plane anisotropy parameters
involved in these structures, , and , are
presented in Table II. Typical angular variations of the frequency
versus the direction of the in-plane applied field, compared to the
observed ones in unbiased samples of the same thickness, are shown
on Figure 6. The uniaxial anisotropy field does not overpass
a few Oe, as it is the case in the unbiased samples. Notice that it
does not significantly differ from the above discussed coercive field,
as expected in the frame of a coherent uniform rotation model. A bias
exchange field is observed in all the films: here again, it does not
much differ from the static bias field deduced from the hysteresis
loops. In both cases there is no clear correlation between the in-plane
anisotropy values and the thickness of the studied film. Table II
also gives the Gilbert damping coefficients derived from the analysis
of the linewidths of the studied resonances: is larger than
in the unbiased layers and increases when the thickness decreases.
This behaviour was pointed out in several publications rezende1 ; mcmichael ; zighem1 .
A theoretical model introduced by Arias et al. mills was adapted
by Rezende et al. rezende2 in order to explain this broadening. In
this model, it results from the lack of homogeneity of the interfacial
exchange coupling between the ferromagnetic and antiferromagnetic
layers and varies as . The magnetic parameters derived
from our MS-FMR measurements are in agreement with the BLS results.
The dependence of the observed frequency is well accounted assuming
an unchanged value of the exchange stiffness (
erg.cm-1). However, due to the rather small in-plane anisotropy
terms and to the limited available instrumental precision, their quantitative
derivation through our BLS study is not very efficient.
| () | |||||||
| (nm) | (kOe) | (Oe) | (Oe) | (Oe) | (Oe) | (Oe) | —– |
| 25 | 9 | 6 | 5 | 10 | 10 | 0 | 7 |
| 14 | 8.4 | 8 | 5 | 20 | 23 | 15 | 9 |
| 9 | 7.6 | 4 | 4 | 18 | 30 | 8 | 10 |
| 7.5 | 7.3 | 3 | 8 | 32 | 41 | 18 | 14 |
| 6 | 7 | 3 | 5 | 27 | 24 | 15 | 12 |
| 5 | 5.1 | 2 | 3 | 21 | 28 | 25 | 16 |
| kOe; erg.cm-2 | |||||||
| erg.cm-1 | |||||||
| Table II: Biased NiO/permalloy films | |||||||
V Conclusion
Our comparative study of two series of permalloy ferromagnetic (F) layers covering a thickness interval extending from 5 to 25 nm, grown by RF sputtering, respectively on a non-magnetic oxide substrate (Al2O3) and on an antiferromagnetic (AF) one (NiO), revealed expected differences originating from the exchange F/AF interfacial interaction but also some surprising similarities. In both cases the interface, observed by HRTEM, shows a very small roughness (below 0.5 nm). The dynamic magnetic properties put in evidence an uniaxial perpendicular anisotropy mainly originating from a contribution of the surface density of energy which is practically independent of the nature of the interface (Al2O3/permalloy or NiO/permalloy). The saturation magnetisation does not vary versus the thickness and is close to the expected one in bulk permalloy showing the same composition. The in-plane anisotropy terms derived from MS-FMR data are in reasonable agreement with the deduced ones from conventional VSM magnetometry. The in-plane anisotropy field does not exceed a few Oe and is close to the coercive field ; its value is not clearly correlated neither to the thickness nor to the nature of the interface. The bias exchange is only observed in presence of a AF/F interface, as usual.
References
- (1) L. Néel, J. Phys. Radium 15, 225 (1954)
- (2) C. Chappert and P. Bruno, J. Appl. Phys 64, 5736 (1988)
- (3) Y. Roussigné, F. Ganot, C. Dugautier and D. Renard, Phys. Rev. B 52, 350 (1995)
- (4) W. H. Meiklejohn and C. P. Bean, Phys. Rev. 102, 1413 (1956)
- (5) J. Nogues, I. K. Schuller, J. Magn. Magn. Mater. 192, 203 (1999)
- (6) C. Binek, Phys. Rev. B 70, 014421 (2004)
- (7) R. D. McMichael, M. D. Stiles, P. J. Chen and W. F. Egelhoff, Phys. Rev. B 58, 8605 (1998)
- (8) J. Nogués, J. Sort, V. Langlais, V. Skumryev, S. Suriñach, J.S. Muñoz, M.D. Baró, Physics Reports 422, 65 (2005).
- (9) A.E. Berkowitz and K. Takano, J. Magn. Magn. Mater. 200, 552 (1999).
- (10) R. L. Stamps, J. Phys. D: Appl. Phys. 33, R247 (2000)
- (11) W. Stoecklein, S. S. P. Parkin and J. C. Scott, Phys. Rev. B 38, 6847 (1988)
- (12) J. Geshev, L. G. Pereira, J. E. Schmidt, L. C. C. M. Nagamine, E. B. Saitovitch and F. Pelegrini, Phys. Rev. B 67, 132401 (1998)
- (13) T. Blachowicz, J. Appl. Phys. 102, 043901 (2007)
- (14) L. Wee, R. L. Stamps, L. Malkinski and Z. Celinski, Phys. Rev. B 69 043901 (2007)
- (15) S. M. Rezende, M. A. Lucena, A. Azevedo, F. M. de Aguiar, J. R. Fermin and S. S. P. Parkin, J. Appl. Phys. 93 7714 (2003)
- (16) F. Zighem, Y. Roussigné, S.-M. Chérif and P. Moch, J. Phys. Cond. Matter, 20, 125201 (2008)
- (17) J. Ben Youssef, N. Vukadinovic, D. Billet and M. Labrune Phys. Rev. B 69, 174402 (2004)
- (18) M. O. Liedke, B. Liedke, A. Keller, B. Hillebrands, A. Mücklich, S. Facsko and J. Fassbender, Phys. Rev. B, 75, 220407 (2007)
- (19) U. Netzelmann, J. Appl. Phys. 68, 1800 (1990)
- (20) W. Damon and J. R. Eshbach J. Phys. Chem. Solids, 19, 308 (1961)
- (21) F. Zighem, Y. Roussigné, S.-M. Chérif and P. Moch, J. Phys. Cond. Matter, 19, 176220 (2007)
- (22) R. L. Stamps Phys. Rev. B, 49, 339 (1994)
- (23) G. Counil, J.-V. Kim, T. Devolder, P. Crozat, C. Chappert, K. Shigeto and Y. Otani J. Appl. Phys. 95, 5646 (2004)
- (24) G. Counil, J.-V. Kim, T. Devolder, C. Chappert and A. Cebollada J. Appl. Phys. 98, 023901 (2005)
- (25) G. I. Lykken, W. L. Harman and E. N. Mitchell, J. Appl. Phys. 37, 3353 (1966)
- (26) J. O. Rantschler, P. J. Chen, A. S. Arrott, R. D. McMichael, W. F. Egelhoff, Jr. and B. B. Maranville, J. Appl. Phys. 97, 10J113 (2005)
- (27) M. Belmeguenai, F. Zighem, Y. Roussigné, S.-M. Chérif, P. Moch, K. Westerholt, G. Woltersdorf and G. Bayreuther, Phys. Rev. B, 79, 024419 (2009)
- (28) R. Arias and D. L. Mills, Phys. Rev. B 60, 7395 (1999)
- (29) S. M. Rezende, A. Azevedo, M. A. Lucena and F. M. de Aguiar , Phys. Rev. B 63, 214418 (2001)