2010 Vol. 0 No. XX, 000–000
22institutetext: Max-Planck-Institut für Sonnensystemforschung, 37191 Katlenburg-Lindau, Germany
Quasi-period outflows observed by the X-Ray Telescope onboard Hinode in the boundary of an active region
Abstract
Persistent outflows have recently been detected at boundaries of some active regions. Although these outflows are suggested to be possible sources of the slow solar wind, the nature of these outflows is poorly understood. Through an analysis of an image sequence obtained by the X-Ray Telescope onboard the Hinode spacecraft, we found that quasi-period outflows are present in the boundary of an active region. The flows are observed to occur intermittently, often with a period of 5-10 minutes. The projected flow speed can reach more than 200 km/s, while its distribution peaks around 50 km/s. This sporadic high-speed outflow may play an important role in the mass loading process of the slow solar wind. Our results may imply that the outflow of the slow solar wind in the boundary of the active region is intermittent and quasi-periodic in nature.
keywords:
Solar wind, UV radiation, Active region1 Introduction
Solar wind origin is among the most important unresolved problems in space and solar physics, although a lot of investigations have been performed in this field. It is commonly believed that coronal holes are the source regions of the fast solar wind (e.g., Krieger et al., 1973; Hassler et al., 1999; Tu et al., 2005; Tian et al., 2010). While there exist several candidates for the source of the slow solar wind, such as helmet streamers and boundaries of polar coronal holes (e.g., Wang et al., 1990; Chen et al., 2004; Antonucci et al., 2006; Kohl et al., 2006), local open-field regions in the quiet Sun (e.g., He et al., 2007; Tian et al., 2008, 2009; He et al., 2009), and boundaries of some active regions (ARs) (e.g., Kojima et al., 1999; Sakao et al., 2007; Marsch et al., 2008; Harra et al., 2008).
Outflows at edges of some ARs were previously observed in both imaging and spectroscopic observations. Winebarger et al. (2001) reported outflows from an AR observed on 1 December 1998. The velocities of the outflows in coronal loops were estimated as between 5 and 20 km/s. The authors postulated that these mass flows are driven by small-scale magnetic reconnection events occurring at the foot points of coronal loops. Using observations made by the X-Ray Telescope (XRT) (Golub et al., 2007) onboard the Hinode spacecraft, Sakao et al. (2007) identified outflows with a speed of 140 km/s from the edge of an AR. With the help of coronal magnetic field extrapolation from the photospheric magnetogram, they found that these outflows are probably associated with open field lines and thus suggested that these outflows might correspond to the slow solar wind. This conclusion was supported by Harra et al. (2008) and Marsch et al. (2008), who found that prominent blue shifts of the coronal emission line Fe xii 195 Å are associated with open field lines in AR boundaries. Del Zanna (2008) further found that the outflows in AR boundaries are temperature dependent and the speed of the outflows increases steadily with increasing temperature.
Quasi-periodic intensity fluctuations have been identified in different parts of the Sun. These intensity oscillations are usually interpreted as disturbances caused by slow magnetoacoustic waves with different periods. In ARs, quasi-periodic oscillations and small-scale propagating brightenings are often found to be associated with coronal loops (e.g., De Moortel et al., 2000, 2002; Robbrecht et al., 2001). The low-frequency oscillations could be the result of the leakage of the slow magnetoacoustic waves to the corona along inclined magnetic filed lines from the lower atmosphere (e.g., De Pontieu et al., 2005), or recurrent magnetic reconnections between large-scale loops and small loops in ARs (e.g., Baker et al., 2009).
In this paper, we apply a wavelet analysis to the outflow events in the boundary of an AR by using high-cadence XRT observations. The outflows, which seem to be associated with open magnetic field lines, are found to be sporadic and reveal a clear characteristic of periodic occurrence.
2 Observation and Data analysis

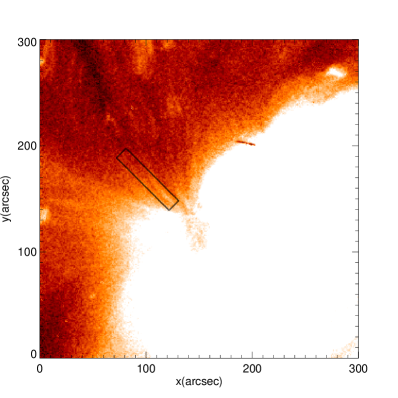

The data set used in this article was obtained by the XRT instrument onboard Hinode in AR NOAA 10942. An XRT Ti-poly image sequence of the AR NOAA 10942 was obtained from 11:33 to 21:27 on February 22, 2007, including 335 images with a cadence of 90 s. The spatial resolution was 2 arcsecs and the exposure time was 16 s. The IDL routine xrt_prep.pro was applied to correct and calibrate the level-0 XRT data to level-1 data. The full Sun image taken with XRT at 18:04 on February 22, 2007 is shown in Figure 1. Right panel of Figure 1 shows the full-disk photospheric magnetogram of GONG (Global Oscillation Network Group) with the projection of the extrapolated coronal magnetic field. The magnetic field lines in the target AR is obtained by using the potential field source surface (PFSS) model (e.g., Schrijver , 2001). It is very clear that the dark coronal-emission region on the eastern side of the AR is associated with open field lines, and thus is possible to be a source region of the solar wind outflow. A level-1 image at 11:59:33 UT is shown in the left panel of Figure 2. The intensity contrast in this image was sharpened and the result is presented in the right panel of Figure 2. From Figure 2 we can identify some plume-like or strand-like enhanced emission structures inside the reduced-emission region.

We selected one strand-like structure, which is marked by the black rectangle in Figure 2, for in-depth analysis. We did not include the root of strand and its far end, in order to avoid interference with other structures near the two ends. First the time sequence of the X-Ray emission in this rectangular region was extracted. We defined the long side of the rectangle to be the X-direction, which is approximately parallel to the orientation of the strand. The short side of the rectangle was defined to be the Y-direction and it is perpendicular to the strand orientation. At each time, we then averaged the intensities over the Y-range at each X position and obtained the average intensity along the strand. We derived the average intensity along the strand and then constructed a time-height diagram revealing the temporal evolution of the intensity along the strand. This time-height diagram is presented in Figure 3.
From Figure 3 we can see that enhanced intensity features (outflows seen in the movie) appear frequently. Some features attenuate quickly when reaching far away from the root of the stand. But some others can still be clearly identified at the far end of the strand. The occurrence of the events of intensity enhancement seems to be sporadic. In order to study the possible recurrent nature of the outflows, we performed wavelet analyses for the time series at some positions along the strand. The wavelet analysis of a time series can reveal both the periods of fluctuations and how the oscillation with a specific period varies in time (Torrence & Compo , 1998), and thus it’s a very useful tool to probe the sporadic behavior of the outflow here. We randomly chose six time series, with each observed at different position of the strand within different time range. The six intervals of the intensity fluctuation are marked by the six white horizontal lines in Figure 3.

Here we also chose the Morlet wavelet function for our analysis. The Morlet wavelet function is defined as a sine wave modulated by a Gaussian window. This wavelet function has been widely used for analyses of oscillations found in different solar features (e.g., Banerjee et al., 2000; Tian & Xia , 2008; Chen et al., 2008). Each time series of the intensity fluctuation, its wavelet power spectrum, as well as the global wavelet spectrum are shown in Figure 4. The colors in the wavelet power spectrum represent the relative intensity of the power spectrum, with the red and blue being the largest and smallest, respectively. A significance test was also performed to check if the periodic signatures revealed in the wavelet power spectrum are real or not. Here we chose confidence level of 90%. As mentioned by Torrence & Compo (1998), wavelet transform has the edge effect at both ends of the time series. The influence range of the edge effect is outlined by the cross-hatched region (cone of influence) in each wavelet power spectrum. The periodic signatures in this cross-hatched region are difficult to be determined as real or not. The global wavelet spectrum can be regarded as an average of the wavelet power spectrum over the time domain. For more information on the wavelet analysis, we refer to a complete description by Torrence & Compo (1998).

We also estimated the velocities of the outflows. From the image sequence we used here, we identified 156 events occurring respectively in 8 strand-like structures. Different strands extend along different directions, perhaps depicting the different stretching directions of local magnetic field lines at the edge of the active region. The projected velocity of each outflow event was estimated from the slope of the corresponding intensity enhancement. The green dot line in Figure 3 marked the trend of the intensity enhancement caused by one outflow event, and is used as an example to calculate the outflow velocity. This method has been frequently adopted to derive the projected velocities of directed flows or propagating disturbances (e.g., Sakao et al., 2007; Tian & Xia , 2008; McIntosh et al., 2010). We use this method to calculate the projected velocities of the 156 outflow events in strand-like structures and present their distribution in Figure 5.
3 Results and Discussion
Outward propagating disturbances or intensity enhancements in ARs were studied by several authors. However, most of these studies found that these quasi-period oscillations are associated with coronal loops in ARs (e.g., De Moortel et al., 2000, 2002; Robbrecht et al., 2001). The low-frequency oscillations found in the corona are suggested to result from the upward leakage of the slow magnetoacoustic waves along inclined magnetic filed lines (e.g., De Pontieu et al., 2005), or recurrent magnetic reconnections between large-scale loops and small cool loops (e.g., Baker et al., 2009).
From Figure 1, we find that the boundary of the AR studied here is more likely to be an open magnetic field region rather than a closed field region. Recent studies using magnetic field extrapolations also demonstrate clearly that such kind of weak-emission regions are associated with open field lines extending outward to the interplanetary space (Sakao et al., 2007; Marsch et al., 2008; Harra et al., 2008; He et al., 2010). So these outflows are probably corresponding to the outflow of the slow solar wind from AR edges. The presence of the significant blue shift of the coronal line Fe xii 195 Å in the same regions provides further support for this conclusion (Marsch et al., 2008; Harra et al., 2008; Del Zanna , 2008).
The strand-like structures are probably the footpoints of the open field lines, and we mainly observed the outward propagating disturbances along open field lines in the boundary of the AR. Although we can not exclude the possibility that these outward propagating disturbances could be the manifestation of upward propagating slow magnetoacoustic waves, the obvious link between the solar wind outflow and the edge of the AR seems to suggest that the propagating intensity enhancement might be the exhibition of the outflow of the slow solar wind along open field lines (He et al., 2010).
Figure 2 reveals that the outflow is not really continuous, but sporadic in time. And it seems in the image that the dynamic events occur from time to time and follow a certain frequency. The wavelet analyses in Figure 3 show clear periods of the intensity fluctuation ranging from 5 to 10 minutes. The periods seem to be different within different time intervals.
These results may have important implications of the nature of the solar wind origin. Almost all of the solar wind model assume that the solar wind flows continuously from the source regions. However, our results reveal clearly that the possible initial outflow of the slow solar wind is intermittent and quasi-period, and thus put more observational constraints on future solar wind models.
The intermittent and periodic nature of the outflow may result from intermittent dynamic processes in the lower solar atmosphere. Our recent study of He et al. (2010) suggested that chromospheric dynamics might play an important role in the formation of the solar wind in AR boundaries. A 5-minute oscillation was found in the underlying chromospheric emission in that paper. Our present study may further suggest a link between the chromospheric quasi-periodic disturbance and the quasi-periodic coronal outflow. Magnetic reconnections between the open magnetic field lines and small-scale cool loops in the boundary of the AR are likely to be the driver of the outflows. Reconnections may occur when the frozen-in condition is locally destroyed, while the reconnection process will switch off when this condition is restored. As a result, the recurrent reconnection processes will drive the outflows quasi-periodically and intermittently. The photospheric quasi-periodic oscillation might also play a role in driving the outflows. As the oscillation propagate into the upper solar atmosphere along the highly inclined magnetic field lines in the AR boundary, acoustic shocks might form to elevate the local materials (De Pontieu et al., 2004), thus could also play an important role in heating and driving the materials into the corona and form the solar wind.
The distribution of the outflow velocities presented in Figure 5 peaks around 50 km/s. We have to mention that these velocities are only the projected components of the real velocities. Many of the magnetic field line in the boundary of the AR are in fact highly inclined and thus making a angle to the plane of the spy. So the real outflow speed could be even larger. Recently, McIntosh et al. (2010) identified high-speed propagating intensity enhancement in polar plumes with a mean velocity of 135 km/s. The authors concluded that these outflows may originate in the upper chromosphere and transition region, and could play an important role in the mass loading process of the fast solar wind. The ubiquitous high-speed outflows along the strand-like structures in AR boundaries might be the phenomena similar to those identified by McIntosh et al. (2010), and could thus be essential in the mass loading process of the slow solar wind.
We are also aware that the magnetic field configuration shown in Figure 1 might not be accurate due to the defects of the potential field model, although the PFSS model is widely used and accepted. If the dark region on the eastern side of the AR is associated with closed field lines, the intermittent outflows we observed could be considered either mass supply to the very large corona loops (Tian et al., 2008, 2009), or being related to the mass heating and injection events originating from the chromosphere (McIntosh & De Pontieu, 2009).
4 Summary
We have performed a wavelet analysis for the coronal outflows in the boundary of an active region. The flows are observed to be intermittent and often exhibit periods ranging from 5 to 10 minutes. Statistic study shows that the distribution of the projected component of the flow speed peaks around 50 km/s. Based on extrapolated local open field lines and previous findings that the dark-emission regions in boundaries of some ARs exhibit significant blue shift of the coronal line Fe xii 195 Å, we suggest that the high-speed outflows may play an essential role in the process of the mass loading of the slow solar wind and that the sporadic quasi-periodic outflows might result from intermittent small-scale magnetic reconnections in the chromosphere and transition region.
Acknowledgements.
XRT is an instrument onboard Hinode, a Japanese mission developed and launched by ISAS/JAXA, with NAOJ as domestic partner and NASA and STFC (UK) as international partners. It is operated by these agencies in co-operation with ESA and NSC (Norway). The authors are supported by the National Natural Science Foundation of China under contracts 40874090 and 40931055.References
- Antonucci et al. (2006) Antonucci, E. 2006, Space Sci. Rev., 124, 35
- Baker et al. (2009) Baker, D., Van Driel-Gesztelyi, L., Mandrini, C. H., et al. 2009, ApJ, 705, 926
- Banerjee et al. (2000) Banerjee, D., O′Shea, E., & Doyle, J. G. 2000, Sol. Phys., 196, 63
- Chen et al. (2004) Chen, Y., Esser, R., Strachan, L., & Hu, Y. 2004, ApJ, 602, 415
- Chen et al. (2008) Chen, P. F., Innes, D. E., & Solanki, S. K. 2008, A&A, 484, 487
- Del Zanna (2008) Del Zanna, G. 2008, A&A, 481, L49
- De Moortel et al. (2000) De Moortel, I., Ireland, J., & Walsh, R. W. 2000, A&A, 355, L23
- De Moortel et al. (2002) De Moortel, I., Ireland, J., Hood, A. W., & Walsh, R. W. 2002, A&A, 387, L13
- De Pontieu et al. (2004) De Pontieu, B., Erdélyi, R., & James, S. P. 2004, Nature, 430, 536
- De Pontieu et al. (2005) De Pontieu, B., Erdélyi, R., & De Moortel, I. 2005, ApJ, 624, L61
- Golub et al. (2007) Golub, L., et al. 2007, Sol. Phys., 243, 63
- Harra et al. (2008) Harra, L. K., et al. 2008, ApJ, 676, L147
- Hassler et al. (1999) Hassler, D. M., Dammasch, I. E., Lemaire, P., Brekke, P., Curdt, W., Mason, H. E., Vial, J.-C., & Wilhelm, K. 1999, Science, 283, 810
- He et al. (2007) He, J.-S., Tu, C.-Y., & Marsch, E. 2007, A&A, 468, 307
- He et al. (2009) He, J.-S., Tu, C.-Y., Tian, H., & Marsch, E. 2009, Adv. Space Res., 45, 303
- He et al. (2010) He, J.-S., Marsch, E., Tu, C.-Y., Guo, L.-J., & Tian, H. 2010, A&A, in press
- Kohl et al. (2006) Kohl, J. L., Noci, G., Cranmer, S. R., & Raymond, J. C. 2006, Astron. Astrophys. Rev., 13, 31
- Kojima et al. (1999) Kojima, M., et al. 1999, J. Geophys. Res., 104, 16993
- Krieger et al. (1973) Krieger, A. S., Timothy, A. F., & Roelof, E. C. 1973, Sol. Phys., 29, 505
- Marsch et al. (2008) Marsch, E., Tian, H., Sun, J., Curdt, W., & Wiegelmann, T. 2008, ApJ, 684, 1262
- McIntosh & De Pontieu (2009) McIntosh, S. W., & De Pontieu, B., 2009, ApJ, 706, L80
- McIntosh et al. (2010) McIntosh, S. W., Innes, D. E., De Pontieu, B., & Leamon, R. J. 2010, A&A, 510, L2
- Robbrecht et al. (2001) Robbrecht,E., et al. 2001, A&A, 144, 469
- Sakao et al. (2007) Sakao, T., et al. 2007, Science, 318, 1585
- Schrijver (2001) Schrijver, C. J. 2001, ApJ, 547, 475
- Tian et al. (2008) Tian, H., Tu, C.-Y.,Marsch, E., He, J.-S., & Zhou, G.-Q. 2008a, A&A, 478, 915
- Tian & Xia (2008) Tian, H., & Xia, L.-D. 2008b, A&A, 488, 331
- Tian et al. (2009) Tian, H., Marsch, E., Curdt, W., & He, J.-S. 2009, ApJ, 704, 883
- Tian et al. (2010) Tian, H., Tu, C.-Y., Marsch, E., He, J.-S., & Kamio, S. 2010, ApJ, 709, L88
- Torrence & Compo (1998) Torrence, C., & Compo, G. P., 1998. Bull. Amer. Meteor. Soc. 79, 61
- Tu et al. (2005) Tu, C.-Y., Zhou, C., Marsch, E., Xia, L.-D., Zhao, L., Wang, J.-X., & Wilhelm, K. 2005, Science, 308, 519
- Wang et al. (1990) Wang, Y.-M., Sheeley, N. R., Jr., & Nash, A. G. 1990, Nature, 347, 439
- Winebarger et al. (2001) Winebarger, A. R., et al. 2001, ApJ, 361, 309