Observational indicators of the transition from fully convective stars to stars with radiative cores.
Abstract
We present a discussion of the similarities and key differences between the transition onto (at the turn-on) and away from (at the turn-off) the main sequence, the latter termed the Hertzsprung gap. Using a set of model isochrones and adopting an initial mass function leads us to predict a dearth of G-type stars for any star forming region. This is caused by the (relatively) constant spectral type at which the transition from a fully convective star to a star with a radiative core begins. We also present analysis of the details of this transition in the ONC. In particular we show that a gap in the photometric and spectral type distributions is centred on, and a change in the fractional X-ray luminosity and rotation rate distribution occurs approximately at, the position of a peak in radiative core size as a function of mass. Whilst photometric signatures of this transition are lost at ages over 20 Myrs, we show that changes in fractional X-ray luminosity and magnetic field configuration persist to older ages. Analysis of literature data show that the mass at which the change in fractional X-ray luminosity is observed decreases with age.
keywords:
stars:evolution – stars:formation – stars: pre-main-sequence – techniques: photometric – catalogues – (stars) Hertzsprung-Russell H-R diagram1 Introduction
The Hertzsprung gap (H gap hereafter) is a region of paucity of stars separating the main-sequence (MS) and the post-MS red giant phase. This gap is observed in colour-magnitude diagrams (CMDs) and HR diagrams of galactic clusters (see for example Hoyle, 1960). The H gap is caused by a region of swift evolution (instantaneous when compared to the MS lifetime of these stars) in effective temperature () and therefore colour. This swift change in temperature is, in turn caused by the cessation of core hydrogen burning and the build up of helium ash leading to a change from a radiative to a convective core. The convective core then contracts, which as it is separated by an active hydrogen burning shell, leads to the envelope expanding, and cooling. The MS edge of this gap is located at the turn-off, and is well predicted by nuclear burning models for MS and post-MS objects. Of course, practically, the transition of stars through the gap is not observed over time but actually as a region of swift evolution as a function of, for instance, mass or spectral type.
A similar gap has been observed for pre-MS stars (Piskunov & Belikov, 1996; Belikov & Piskunov, 1997; Stolte et al., 2004; Piskunov et al., 2004; Mayne et al., 2007; Bono et al., 2010; Cignoni et al., 2010; Rochau et al., 2010). In this case the fully convective stars, contracting onto the MS, eventually form a radiative core with the ‘ignition’ of hydrogen burning. Once the core is formed it expands relative to the total stellar radius (which contracts overall after a brief expansion). The transition, as with the H gap, leads to a swift evolution in (which again, as with the H gap, can be considered instantaneous when compared to the MS lifetime and also the contraction time). The MS edge of this transition is located at the turn-on. Once more this is practically observed as a rapid change in as a function of mass or spectral type.
The H gap and its pre-MS analogue are both caused by rapid evolution in , changes in the dominant energy transfer mechanism within the core (either convective radiative or vice versa) and the cessation or initiation of core hydrogen burning. However several key differences exist between these two transitions meaning they are not simply the same process in reverse. Firstly, the location, within a CMD is clearly different, with the turn-on and turn-off (if both are present) separated in magnitude. Additionally, and most crucially for this work, the stratification of the dominant energy transfer mechanism within the stars differ across the H gap and its pre-MS analogue. For the H gap, simplistically, the stars moves from the MS, with an associated radiative core and convective envelope, to the post-MS, with a convective core, active (radiative) hydrogen burning shell and convective envelope. Essentially, the stars begins the transition with one boundary or shearing layer and ends it with two, with the final configuration complicated by the shell. For the pre-MS transition the stars moves from a fully convective regime to the development of a radiative core and associated, single, shearing or tachocline layer.
The transitions in both cases will be a function of age, as the mass of the star begining the transition decreases with time. This age dependence, for the pre-MS transition, has been highlighted and exploited in several studies. Piskunov & Belikov (1996) constructed theoretical luminosity functions using convolution of pre-MS isochrones with a Saltpeter IMF. This resulted in a dip (the gap) bounded by two peaks, in the luminosity functions. The bounding peaks were attributed to radius inversion in the birthline (on the pre-MS or convective side, termed the R maximum) and stars reaching the MS (termed H maximum). Piskunov et al. (2004) apply the work of Piskunov & Belikov (1996) (and the further work of Belikov & Piskunov, 1997) by using the so–called H feature (named thus as it represents the ‘ignition’ of hydrogen burning) to aid the ageing of several clusters. Cignoni et al. (2010) describe a similar technique for deriving cluster ages but by binning stars in magnitude. This is done over increasing radii from the cluster core and identification of a magnitude at which they find a peak followed by a fall in the number of stars. The choice to bin the stars by magnitude, as opposed to colour, means the method of Cignoni et al. (2010) and Piskunov et al. (2004) will include an inherent degeneracy with distance.
Mayne et al. (2007) identified the manifestation of the pre-MS H gap within the CMDs of several young clusters. In this work the gap, termed the radiative convective (RC) gap, is identified and its causes in terms of the change in dominant core energy transfer mechanism explained. Furthermore, Mayne et al. (2007) suggest that the gap should be measured in colour, as its size is a function of age, meaning it would be free of distance degeneracy problems. The pre-MS H gap has also been used by Bono et al. (2010) and Stolte et al. (2004) to aid isochrone fitting. Bono et al. (2010) define features of the isochrone called the main-sequence turn-off (MSTO) and main-sequence knee (MSK). In contrast, Stolte et al. (2004) use the shape of the so–called MS/pre-MS transition region.
As a cluster ages the photometric signature of the RC or pre-MS H gap is lost. This is as the turn-on becomes less well separated from the pre-MS with age, and the transition occurs for lower mass stars resulting in a less signifcant and slower change. Practically, this means that any photometric signature is lost above an age of around 20 Myrs. However, as the pre-MS stars move from the fully convective regime to one with a radiative core, several secondary characteristics are changed as a consequence. As shown in the work of Endal & Sofia (1981) once a radiative core forms this will decouple from the convective envelope. Therefore, as these stars undergo a rapid transition one might expect a signature in the rotational period distributions across the transition. Additionally, the decoupling of the core will lead to a change in the magnetic field generation within the star, from fully convective to a tachocline driven mechanism, as the decoupling creates a shearing layer. This in turn should lead to signatures in the X-ray and variability signatures of the stars across the transition (see Saunders et al., 2009, for discussion of the latter).
The , magnetic field generation mechanism, angular momentum distribution and X-ray emission are all changed due to the transition from fully convective star to one with a radiative core. Therefore, throughout this work we term the pre-MS H gap analogue the CR transition to highlight the importance of the change in dominant energy transfer mechanism. In this paper we explore the details of the CR transition with particular reference to the growth of the radiative core, using theoretical data and data for stars in the ONC. The models used throughout this paper are those of Siess et al. (2000). In Section 2 we illustrate the photometric signatures of the CR transition and highlight implications for spectral type distributions. In Section 3 we present signatures of the CR transition in data of the ONC and show that these match predictions of the growth of a radiative core. In Section 4 we present a summary of some literature results containing indications of the CR transition in several clusters and in several observables. Finally we conclude in Section 5.
2 Theory of the pre-MS H gap, or CR transition
The key characterisitic of the CR transition is its age dependence, with several authors using the location of the gap (or associated features) to derive ages for clusters (Piskunov et al., 2004; Mayne et al., 2007; Cignoni et al., 2010; Bono et al., 2010) The age dependency of the size is a result of the convective part of the pre-MS isochrones moving closer to the MS with age. Additionally, the mass at which the transition is occuring reduces leading to a slower and less tumultuous transition. Figure 1 is a reproduction of Figure 19 from Mayne et al. (2007). This shows that the separation between the head of the pre-MS and the tail of the MS decreases with age. The isochrones of 1, 3 and 13 Myrs and the early-MS (0.1 Myrs is shown as a pseudo-birth line) from Siess et al. (2000), are shown as well as the mass tracks for 7, 6, 5, 4, 3, 2, 1.2, 1.0, and 0.8 . The early-MS isochrone differs from the zero-age-main sequence (ZAMS) isochrone for higher mass stars as these stars undergo a cycle of CN burning which involves evolution above, in terms of a CMD, the ZAMS until this cycle reaches equilibrium. The early-MS simply shows the position of stars after they have ‘settled’ onto the, relatively, temporally static-MS. The evolution between the 1 and 3 Myr isochrones of a 1 and 3 star is highlighted, in Figure 1, by the solid (red) tracks and circles. By comparing the evolution of the two highlighted masses one can see that in a relatively short period of time (2 Myr) the more massive star has moved a significant distance across the CMD and joined the MS, whilst the lower mass objects has simply dropped slightly in magnitude. Additionally, the size in colour of this transition region is a function of the colours and magnitudes used. For instance the separation between pre-MS and MS is larger in a CMD, meaning Infrared (IR) studies of the CR transition region could yield easier detectability. Indeed, the pre-MS/MS transition region was highlighted in an IR CMD by Stolte et al. (2004) as a visual aid to fitting isochrones to IR photometry of NGC 3603.
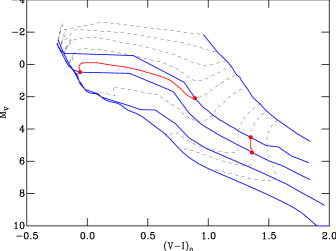
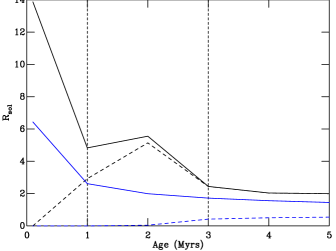
Figure 2 shows the stellar radius and radius to the bottom of the convective envelope as a function of age for the 1 and 3 models of (Siess et al., 2000). The vertical dotted lines in Figure 2 highlight the ages of 1 and 3 Myrs. As the star moves across the CR transition, between 1 and 3 Myrs for the 3 model, the core grows within the star and the total stellar radii undergoes a temporary expansion, but contracts overall. Once the radiative core grows to almost the size of the star the transition is complete and the star joins the MS. Across the same age range the 1 model simply contracts slightly as it follows a Hayashi track. Of course, as discussed, practically we do not observe the transition as a function of time, but rather as a snapshot with the transition apparent as a function of mass or spectral type.
Whilst the CR transition can be observed in a CMD deriving masses, using isochrones, for individual stars across the region is unreliable. As the gap is caused by a rapid evolution in a signature will also be apparent in the spectral types of the stars. Figure 3 shows the spectral types of stars as a function of age for each mass available from the models of Siess et al. (2000). The top and bottom panels simply show different age limits to highlight the changes for different stages of stellar evolution.

The top panel of Figure 3 shows the size of the CR transition region, areas where the tracks tend to horizontal, decreasing as a function of age. Interestingly, the fully convective edge of the transition stays at around late-G, whilst the MS edge moves from A to G. Furthermore, the lower panel shows that even for the much older sequences the tracks are well seperated across the G spectral class. This is not caused by a resolution issue as the mass increments in the models are constant across this range. This essentially means that if we assume a smooth, flat, Initial-Mass-Function (IMF) there should be a detectable paucity of G-type stars within a spectral type histogram of any young cluster or star forming region. Practically, one might expect this paucity may be smoothed out when convolved with a reasonable IMF, however it is still apparent in the ONC, as shown in Section 3 and Figure 5.
3 Gap in the ONC
In this section we explore the connection between the signatures of the CR transition for the ONC and the predicted growth of the radiative core.
3.1 Photometry and Spectral Types
The ONC (2 Myrs, 400 pc Mayne & Naylor, 2008) is one of the clusters where the RC gap was observed (Mayne et al., 2007). Absolute photometry of the ONC is shown in Figure 4, where a distance modulus () of 7.96 has been adopted (Mayne & Naylor, 2008). The optical photometry and spectroscopy of the stars with membership probabilities in excess of 80 from Hillenbrand (1997) have been used to construct an (left Y-axis), CMD, Figure 4. For the optical data each star was individually corrected for extinction (in cases where an individual extinction was not available a mean extinction was applied). The 2 Myr and the static-MS of Siess et al. (2000) (dashed lines) are also shown. Additionally, the radius to the bottom of the convective envelope, or the size of the radiative core, and the predicted radii of the stars are shown (solid lines, right Y-axis), from the models of Siess et al. (2000), for an age of 2 Myrs.
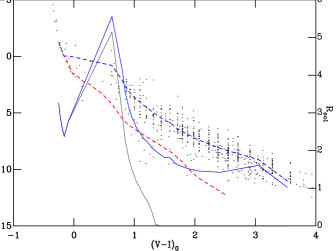
Figure 4 shows a clear sparsity of stars in the region separating the populous, photometrically spread, pre-MS members and the fewer (due to the IMF predicting a reduction in the number of stars as mass increases) less photometrically scattered MS members, spanning a region from around 0.0 to 0.90. The solid black line shows that the stars become more dispersed at the first appearance of the radiative core. In this figure we observe the growth of the core as a function of mass or spectral type, not over time. However, clearly, as the mass increases (towards brighter magnitudes) the core (and the star) size goes through a ‘spike’. Essentially, the radius of the stars, and relative size of their cores, within the gap goes through a region of rapid increase as a function of mass. At higher masses still the core encompasses almost all of the star, and the stars have settled onto the MS, with a small contraction as a function of mass. As the ONC lies in front a dense molecular crowd there is little contamination from background members. Additionally, this sample, it is reasonable to assume, is photometrically complete down to around (i.e. 2 mags above ), which is well below the noted gap. Saturation may cause the loss of some brighter objects but this does not effect our results, in fact the addition of more brighter stars would strengthen our conclusions.
The data of Hillenbrand (1997) also includes spectral types derived from high resolution spectra (not from conversions of photometry). Figure 5 shows the histogram of the number of stars classified as each spectral type by Hillenbrand (1997) (left Y-axis, vertical bars are uncertainties) in the bottom panel (solid line) alongside the predicted spectral type distribution derived from a Kroupa-IMF and the models of Siess et al. (2000) (dashed line). For stars with several or large ranges of determined spectral types a median spectral type was chosen. The top panel of Figure 5 simply shows the spectral type and intrinsic colour of each star (left Y-axis). Additionally, the top and bottom panels show the predicted (Siess et al., 2000) absolute and relative sizes of the radiative core (right Y-axis), respectively (solid black lines), for an age of 2 Myrs. The top panel also shows the predicted radii of the stars (solid blue line, Siess et al., 2000), again at an age of 2 Myrs. Finally, the approximate edges of the paucity of spectral types are also shown (vertical dotted red lines). The predicted spectral type distribution has been derived by interpolating a Kroupa-IMF for spectral type using the 2 Myr isochrone of Siess et al. (2000), and adopting a total visible system mass of around 380 in the range 0.1 7.0 . This is a reasonable total mass estimate given that the catalogue contains around 600 members and the total number of members is around six or seven times this, 4000 giving an estimated total system mass 2500 , consistent with the lower limit of 2000 (Olczak et al., 2006).
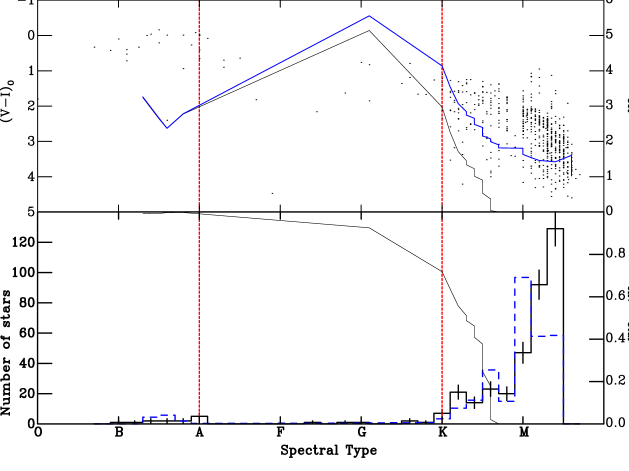
The top and bottom panels of Figure 5 shows a clear sparsity of the observed spectral types between approximately K0 to B8. We have applied the Hartigan dip test to the histogram data from the lower panel of Figure 5 (Hartigan & Hartigan, 1985). This results, after extrapolation from the results tables of Hartigan & Hartigan (1985), in a probability of less than % 111This value is taken from the table for 200 datapoints, whereas we have 625, increasing the number of datapoints results in a lower percentage for a given KS statistic value. Therefore in reality the result is even stronger. that the distribution was drawn from a uni-modal underlying distribution. This effectively shows that a dip is present. Additionally, we have tested the the statistical significance of the observed (solid histogram) and simulated (dashed blue histogram) spectral type distributions, in their cumulative forms, being drawn from different populations. A simple test 222A 2–sided KS test is unsuited to these data as spectral types are discrete and the KS test models continuous distributions results in the rejection of the null hypothesis that the two, cumulative, distributions where not drawn from the same underlying population at around 80%.
More importantly, the growth of the radiative core within the star in both relative, (bottom) and absolute (top) size, appears to coincide with the beginning of the dip or gap. The initial appearance of the core (K6–7) coincides with a reduction in the density of the stars, as shown in the top panel of Figure 5 (and apparent in Figure 4). Furthermore, the bottom panel shows that as the core grows past around 70% of the total stellar radii the number of stars at those, and earlier, spectral types (K0) decreases dramatically, illustrated by the rightmost vertical (red) dotted line. Additionally, a spike or peak in the size of the core (in part caused by expansion of the star itself as a function of spectral type) just precedes the region of lowest density of stars (G).
In summary, the first appearance (in mass or spectral type) of a radiative core creates a fall in the density of stars in both an example CMD (Figure 4) and spectral type distributions (Figure 5). As one moves towards larger masses (or earlier spectral types) the gap becomes much clearer, and the density drop more significant, once the core composes around 70% of the entire star. Additionally, as the radiative (and total stellar radius) goes through a peak in its size (as a function of mass or spectral type), the density of stars appears to be at its, approximate, lowest. Finally, once the core encompases almost all of the stellar interior the density of stars increases slightly as they settle onto the MS.
3.2 X-ray Luminosity and Angular Momentum
Clearly, the growth of the radiative core coincides with significant changes in the surface temperature and therefore spectral type of the star. The reverse process, in the post-MS H gap, has as similar effect. Crucially, however the structure within the stars across these transitions in markedly different. The transition from MS star to post-MS giant includes the generation of, effectively, an extra shearing or tachocline layer as the convective core is seperated from the envelope by an active shell. For the CR transition the star moves from a completely convective regime to the generation of a boundary or shearing layer. Therefore, in the pre-MS case one would expect more significant changes in stars magnetic field, and therefore X-ray emission.
Figure 6 shows the relative (to the bolometric luminosity) X-ray luminosity (left Y-axis) against stellar mass for stars in the ONC from the data of Feigelson et al. (2002). The top and bottom panels also show the absolute and relative sizes of the radiative core (right Y-axis), respectively, from Siess et al. (2000), at an age of 2 Myrs. Additionally, the top panel shows the predicted radii of the stars (Siess et al., 2000), again at an age of 2 Myrs (solid blue line). Finally, (from left to right) the (log) masses at which the core first appears and encompasses around 70% of the star are indicated (vertical red dotted lines).
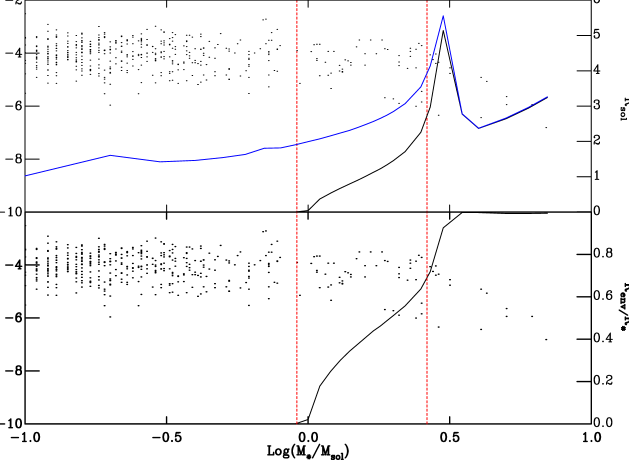
Figure 6 shows that as the mass of the stars in the ONC increases the relative X-ray luminosity remains approximately constant, even when a core first appears at (leftmost vertical, red, dotted line), until around solar mass. Once the core encompasses around 70% of the star, illustrated by the rightmost vertical red dotted line, at a mass of (K0–K1), there is a sharp deline in the fractional X-ray luminosity. This occurs at masses just preceding the ‘spike’ in core (and star) radial size. This suggests that the X-ray emission, and therefore magnetic field topology is changing within the star as the core develops. This is expected as the development of a core creates a shearing or tachocline layer, leading to a transition from a fully convective to a Sun–like dynamo. Indeed, Feigelson et al. (2002) discuss the data shown in Figure 6 in terms of the relative strengths of radiative and fully convective dynamos. As X-ray activity is used a selection tool for pre-MS populations this result is unsurprising. This leads us to predict that Zeeman Doppler imaging across the CR transition will lead to a marked change in the surface magnetic field structure. Interestingly, the switch in magnetic dynamo does not appear to occur until the radiative core comprises most of the stellar interior.
As core–envelope decoupling is a natural consequence of the generation of a radiative core one would also expect a change in angular momentum distribution with the onset of radiative core development. Evidence for a change in the rotation velocities across this CR transition is shown and discussed in McNamara (1990). McNamara (1990) (albeit with a limited sample) discovers a change in the distributions for stars classified as fully convective or radiative with 1.5 or 1.5 . The distribution of rotation velocity was shown to change across the CR transition with stars having radiative cores rotating, overall, faster than their fully convective counter parts. Figure 4 of McNamara (1990), shows distributions with modal values of 25 kms-1 and no stars rotating faster than 85 kms-1 for the fully convective stars and a flatter much broader distribution out to 150 kms-1 for the higher mass stars with radiative cores. In addition McNamara (1990) also shows, with a larger sample of stars a similar effect for Orion Ic. Again, this suggests that further studies of the rotation rate distributions either side of the CR transition will yield clear differences between the populations.
4 Other clusters
A clear RC gap has also been found in the CMDs of several other clusters such as NGC 2264, h and Persei and NGC 3603 (Mayne et al., 2007; Stolte et al., 2004; Rochau et al., 2010).
A further probe of the CR transition through analysis of variability is presented in Saunders et al. (2009). Saunders et al. (2009) show that the fraction of stars with significant photometric variability reduces as one crosses the RC gap in h Persei. Photometric variability in pre-MS stars is generally caused by long lived surface cool spots (Herbst et al., 2007). As these surface spots require large scale and long lived surface magnetic fields their dissapearance is indicative of a change in magnetic field topology. Essentially, the transition in magnetic dynamo leads to a change from large scale ordered fields to smaller scale fields (see discussion and references in Saunders et al., 2009). Again, this is unsurpising given that significant photometric variability is often used as a pre-MS selection tool.
As we have shown in Section 3 a decline in the relative X-ray luminosity coincides with the growth of a radiative core, for the ONC. Evidence for a similar decline can be found in the literature for several other clusters. Moreover, if one compares the mass at which the transition occurs there is tantalising evidence of the age dependence of the CR transition. Figure 11 of Dahm et al. (2007) shows a clear change in the relationship, of stars in NGC2264 (3 Myrs, Mayne et al., 2007), at around a mass of 2 to 2.5 or spectral type of K2–G7. Currie et al. (2009) find a clear transition in the ratio of soft X-ray luminosity to the stellar bolometric luminosity () distribution at of around 0.8, for stars in h and Per (Mayne et al., 2007; Currie et al., 2009, 14 Myrs). As is shown in Figure 5 of Currie et al. (2009), this is around a spectral type of K0 or mass of 1.3 (Siess et al., 2000). A similar change in gradient is evident in the fractional X-ray luminosity curve of NGC2537 at 40 Myrs (Oliveira et al., 2003). The lower panel of Figure 7 of Jeffries et al. (2006) shows that this change occurs at 0.75, for an age of 40 Myrs with minimal extinction (Mayne & Naylor, 2008, 0.04) this equates to a spectral type of K0 and mass of 1 (Siess et al., 2000). The transition is also observable in the Pleiades Figure 14 from Stauffer et al. (2003) shows a clear change in gradient of the fractional X-ray luminosity against colour (or spectral type) within this cluster. The fractional X-ray luminosity rises steeply from a 0.5 to a peak at around 0.9, which given the small reddening to the Pleiades (0.04 Stauffer et al., 2003), equates to a similar . The places the CR transition at a spectral type of around K2 or 0.9 . Finally, NGC2516 at 140 Myrs shows a softer transition in fractional X-ray luminosity. Figure 8 of Pillitteri et al. (2006) shows the change at a 1.00, at an age of 140 Myrs this is around a spectral type of K4 and mass of 0.8 (Siess et al., 2000). Therefore, we can see that the mass at which the transition occurs decreases with age, as expected from the models. The transition occurs at approximately (), , , , and for the ONC ( Myrs), NGC2264 ( Myrs), h and Per ( Myrs), NGC2537 ( Myrs), the Pleiades ( Myrs) and NGC2516 ( Myrs), respectively. These masses, in all cases, are well matched by the masses at which the growth of the radiative core undergoes the peak as shown for the ONC in Figure 6.
4.1 Magnetic Field Measurements
The fully convective dynamo, although poorly understood, produces magnetic fields with different characteristics to the relatively well understood solar-type dynamo which is based on a shearing layer between radiative core and convective envelope. Recent studies using Zeeman Doppler imaging have revealed a striking transition in the stellar surface magnetic field across the CR transition for a population of field stars (Donati et al., 2008; Morin et al., 2008). This effectively means that indicators for the CR transition can be detected even for the field stars which are many Gyrs old.
Donati et al. (2008) and Morin et al. (2008) observed Stokes V and I line profiles of stars either side of the CR transition region. They showed that as one moves across the CR transition the stellar surface magnetic field undergoes a sharp transition. For fully convective stars the field is multipolar (not dipolar, Gregory et al., 2009) and retains large–scale structure (Dobler et al., 2006). This enables long–term support of magnetically controlled cool spots covering larger areas of the stellar surface resulting in significant photometric variability (see Saunders et al., 2009, for an extended discussion of these results). For those stars with radiative cores the surface magnetic field is dominated by small scale structures. This transition is observed to occur between masses of around 0.35 to 0.4 , at or just after the lowest mass at which a radiative core is predicted to have begun forming. It is perhaps surprising that the switch in magnetic field is coincident with the first appearance, as one increases in stellar mass, of a radiative core. This suggests that even for a radiative core with a small radial extent, relative to the star, the magnetic field generation is dominated by its interaction with the envelope, and not a convective dynamo within the envelope. This may well be explained by the age of these stars. Essentially, the radiative core of these stars has been present for many Gyrs meaning the dynamo based on the shearing layer can slowly overpower the convective dynamo. The efficiency of the fully convective dynamo mechanism has been shown to be strongly dependent on rotation rate (Dobler et al., 2006). Conversely, solar type dynamos, based on a shearing layer and differential rotation, have been shown to be only weakly dependent on the surface rotation rate (Küker & Rüdiger, 2005). It has been known for some time that pre-MS stars spin up as they approach the MS, with a peak in rotation rate of around 50 Myrs, and then spin down as they evolve onto, and along the MS (Endal & Sofia, 1981). Therefore, for a field population of many Gyrs one would expect the convective component of the magentic dynamo to be minimised and the surface magnetic field generation to be dominated by a solar type dynamo.
5 Conclusions
In this work we have described the similarities and crucial differences between H gap and its pre-MS analogue. We have used the models of Siess et al. (2000) to explain the appearance of a gap in the CMDs of young clusters (previously termed the RC gap Mayne et al., 2007), of age less than around 20 Myrs. Furthermore, we have shown that the models of Siess et al. (2000) convolved with a Kroupa-IMF lead to a prediction of a dearth of G-type stars in star forming regions. This is as the convective side of the transition from a fully convective star to the generation of a radiative core is at a roughly constant spectral type as a function of age.
We have termed the pre-MS analogue of the H gap the CR transition. We have then explored signatures of this transition in data of the ONC and their relation to the growth of a radiative core. This resulted in a clear change in not only in (and therefore colour and spectral type) but also in fractional X-ray luminosities at a location where the core growth is predicted to peak (Siess et al., 2000). We have also highlighted literature evidence of changes in the angular momentum distribution of stars across this CR transition in the ONC, as would be expected from the inevitable core–envelope decoupling. Furthermore, we have collected and repeated evidence in the literature of transitions in the photometry of other clusters and the variability of h and Per, with variability dying out across the gap. Moreover, evidence from the literature of changes in the fractional X-ray luminosity for several clusters reveals an age sequence, with each transition well matched by predictions of the core growth.
The clear extension is to use this exquisitely model dependent piece of stellar evolutionary physics to fine–tune the models and constrain associated predictions. This of course will both require, and help develop a better model of convection in young (and old) stars by providing an excellent boundary condition with respect to thermodynamic and magnetic behaviour. Precise and multi-wavelength observations across this CR transition region for a range of stellar populations will lead to concrete constraints and boundary conditions of great utility to models of convection and magnetic field generation in stars. In addition, Zeeman Doppler imaging across the CR transition for young stars is predicted to show a sharp transition in the structure of the surface magnetic field. Further study of this aspect may prove critical in the development of theories of magnetic field generation in stars. We also predict that across the CR transition region rotational velocity distributions should show a change, with the radiative objects, generally, rotating faster than their fully convective counterparts.
The CR transition region has been shown to be easily observable and is delicately dependent on the stellar model. This transition demarcates the boundary between the relatively well established nuclear burning regime and the poorly understood convective regime. Therefore, extended study of this phenomenon and its subsequent use as a theoretical constraint should yield conclusive results with respect to the thermodynamic, angular momentum, and magnetic field generation evolution in young and old stars.
Finally, as shown in Mohanty & Shu (2008) interaction between a young star and circumstellar disc depends pivotally on the topology of the stellar magnetic field. Accretion and disc interaction appears to be maximised for stars with large scale ordered multi-polar fields (see discussion in Mohanty & Shu, 2008). These types of fields are now beginning to be observed in fully convective pre-MS stars Gregory et al. (2009). Therefore, populations of stars with associated discs should show significant differences in accretion signatures across the CR transition region. Furthermore, as the X-ray emission characteristics change across the CR transition we would expect this to result in a significantly different interaction between star and disc in terms of X-ray evaporation of the outer disc (Ercolano et al., 2009). This may result in detectable differences in mass loss from systems either side of the CR transition.
6 ACKNOWLEDGMENTS
NJM is supported by STFC grant ST/F003277/1. The author would like to thank Eli Bressert, Rob King, Tim Naylor and Tim Harries for valuable suggestions and discussion. Additionally, the author would like to thank the referee for their suggestions resulting in a much improved work.
References
- Belikov & Piskunov (1997) Belikov A. N., Piskunov A. E., 1997, Astronomy Reports, 41, 28
- Bono et al. (2010) Bono G., Stetson P. B., VandenBerg co authors. ., 2010, ApJL, 708, L74
- Cignoni et al. (2010) Cignoni M., Tosi M., Sabbi E., Nota A., Degl’Innocenti S., Prada Moroni P. G., Gallagher J. S., 2010, ArXiv e-prints
- Currie et al. (2009) Currie T., Evans N. R., Spitzbart B. D., Irwin J., Wolk S. J., Hernandez J., Kenyon S. J., Pasachoff J. M., 2009, AJ, 137, 3210
- Dahm et al. (2007) Dahm S. E., Simon T., Proszkow E. M., Patten B. M., 2007, AJ, 134, 999
- Dobler et al. (2006) Dobler W., Stix M., Brandenburg A., 2006, ApJ, 638, 336
- Donati et al. (2008) Donati J.-F., Morin J., Petit P., Delfosse X., Forveille T., Aurière M., Cabanac R., Dintrans B., Fares R., Gastine T., Jardine M. M., Lignières F., Paletou F., Velez J. C. R., Théado S., 2008, MNRAS, 390, 545
- Endal & Sofia (1981) Endal A. S., Sofia S., 1981, ApJ, 243, 625
- Ercolano et al. (2009) Ercolano B., Clarke C. J., Drake J. J., 2009, ApJ, 699, 1639
- Feigelson et al. (2002) Feigelson E. D., Broos P., Gaffney III J. A., Garmire G., Hillenbrand L. A., Pravdo S. H., Townsley L., Tsuboi Y., 2002, ApJ, 574, 258
- Gregory et al. (2009) Gregory S. G., Matt S. P., Donati J., Jardine M., 2009, in E. Stempels ed., American Institute of Physics Conference Series Vol. 1094 of American Institute of Physics Conference Series, The magnetic fields of accreting T Tauri stars. pp 71–76
- Hartigan & Hartigan (1985) Hartigan J. A., Hartigan P. M., 1985, Annals of Statistics, 13, 70
- Herbst et al. (2007) Herbst W., Eislöffel J., Mundt R., Scholz A., 2007, in Reipurth B., Jewitt D., Keil K., eds, Protostars and Planets V The Rotation of Young Low-Mass Stars and Brown Dwarfs. pp 297–311
- Hillenbrand (1997) Hillenbrand L. A., 1997, AJ, 113, 1733
- Hoyle (1960) Hoyle F., 1960, MNRAS, 120, 22
- Jeffries et al. (2006) Jeffries R. D., Evans P. A., Pye J. P., Briggs K. R., 2006, MNRAS, 367, 781
- Küker & Rüdiger (2005) Küker M., Rüdiger G., 2005, Astronomische Nachrichten, 326, 265
- Mayne & Naylor (2008) Mayne N. J., Naylor T., 2008, MNRAS, 386, 261
- Mayne et al. (2007) Mayne N. J., Naylor T., Littlefair S. P., Saunders E. S., Jeffries R. D., 2007, MNRAS, 375, 1220
- McNamara (1990) McNamara B., 1990, ApJ, 350, 348
- Mohanty & Shu (2008) Mohanty S., Shu F. H., 2008, ApJ, 687, 1323
- Morin et al. (2008) Morin J., Donati J.-F., Petit P., Delfosse X., Forveille T., Albert L., Aurière M., Cabanac R., Dintrans B., Fares R., Gastine T., Jardine M. M., Lignières F., Paletou F., Ramirez Velez J. C., Théado S., 2008, MNRAS, 390, 567
- Olczak et al. (2006) Olczak C., Pfalzner S., Spurzem R., 2006, ApJ, 642, 1140
- Oliveira et al. (2003) Oliveira J. M., Jeffries R. D., Devey C. R., Barrado y Navascués D., Naylor T., Stauffer J. R., Totten E. J., 2003, MNRAS, 342, 651
- Pillitteri et al. (2006) Pillitteri I., Micela G., Damiani F., Sciortino S., 2006, A&A, 450, 993
- Piskunov & Belikov (1996) Piskunov A. E., Belikov A. N., 1996, Astronomy Letters, 22, 466
- Piskunov et al. (2004) Piskunov A. E., Belikov A. N., Kharchenko N. V., Sagar R., Subramaniam A., 2004, MNRAS, 349, 1449
- Rochau et al. (2010) Rochau B., Brandner W., Stolte A., Gennaro M., Gouliermis D., Da Rio N., Dzyurkevich N., Henning T., 2010, ApJL, 716, L90
- Saunders et al. (2009) Saunders E. S., Naylor T., Mayne N., Littlefair S. P., 2009, MNRAS, 397, 405
- Siess et al. (2000) Siess L., Dufour E., Forestini M., 2000, A&A, 358, 593
- Stauffer et al. (2003) Stauffer J. R., Jones B. F., Backman D., Hartmann L. W., Barrado y Navascués D., Pinsonneault M. H., Terndrup D. M., Muench A. A., 2003, AJ, 126, 833
- Stolte et al. (2004) Stolte A., Brandner W., Brandl B., Zinnecker H., Grebel E. K., 2004, AJ, 128, 765