LAL 10-32
The Current Status of
Recently, important updates were made for the hadronic contribution to the theoretical prediction of . The isospin-breaking-corrections, needed in the comparison of the two pion spectral functions from decays and annihilations, were improved using new experimental and theoretical input. The recently published BABAR data were included in the global average of spectral functions. These data, as well as the ones from decays, were combined using newly developed software, featuring improved data interpolation and averaging, more accurate error propagation and systematic validation. The discrepancy between the and the -based result is reduced from previously 2.4 to 1.5 . The full Standard Model prediction of , obtained using data, differs from the experimental value by 3.2 standard deviations.
1 Introduction
The Standard Model (SM) prediction for the anomalous moment of the muon can be conviniently separated into a sum,
| (1) |
with the QED, hadronic and weak contributions respectively. This prediction is limited in precision by the lowest-order hadronic vacuum polarization contribution, which together with the hadronic higher order and light-by-light (LBL) contributions provide the total hadronic contribution. Owing to unitarity and to the analyticity of the two point correlator, using the optical theorem, the lowest order hadronic vacuum polarisation contribution to the anomalous magnetic moment of the muon () can be computed through an energy-squared dispersion integral (ranging from the threshold to infinity):
| (2) |
where is a QED kernel function . Actually, the integration kernel strongly emphasises the low-energy part of the spectrum, about 73% of the lowest order hadronic contribution being provided by the final state aaa Throughout this note, final state photon radiation is implied for hadronic final states. . More importantly, 62% of its total error stems from the mode, stressing the need for ever more precise experimental data in this channel to confirm or not the observed deviation between SM prediction and experiment.
In this note we concentrate on the computation of . We add the other contributions and compare the total SM prediction with the experimental measurement. The results presented here were first published in Ref. . We also recall some previous results from Ref. .
2 Hadronic data and contributions to
A former lack of precision -annihilation data inspired the search for an alternative. It was found in form of spectral functions , transferred from the charged to the neutral state using isospin symmetry. During the last decade, new measurements of the spectral function in annihilation with percent accuracy became available , superseding or complementing older and less precise data.
Indeed, fix-energy measurements from the CMD2 and SND experiments at the VEPP-2M collider (Novosibirsk, Russia), achieved comparable statistical errors, and energy-dependent systematic uncertainties down to and , respectively. These measurements have been complemented by results from KLOE , where a hard-photon ISR technique was applied for the first time to precisely determine the cross section between and . The analysed data sample provides a relative statistical error on the contribution to . KLOE does not normalise the cross section to so that the ISR radiator function must be taken from Monte Carlo simulation (cf. and references therein). The systematic error assigned to this correction varies between and (closer to the peak). The total assigned systematic error lies between and .
With the increasing precision, which today is on a level with the data in that channel, systematic discrepancies in shape and normalisation of the spectral functions were observed between the two systems . It was found that, when computing the hadronic VP contribution to the muon magnetic anomaly using the instead of the data for the and channels, the observed deviation with the experimental value would reduce to less than . The discrepancy between the and -based predictions decreased after the inclusion of new data from the Belle experiment , published data from CMD2 and KLOE (superseding earlier data ), and a reevaluation of isospin-breaking corrections affecting the -based evaluation . bbb The total size of the isospin-breaking correction to has been estimated to , which is dominated by the short-distance contribution of . In terms of , the difference between the and -based evaluations in the dominant channel was found to be (if not otherwise stated, the values are given in units of ), where KLOE exhibits the strongest discrepancy with the data (without the KLOE data the discrepancy reduces from to ).
Not long time ago the BABAR Collaboration reported measurements of the processes using the ISR method at 10.6 centre-of-mass energy. The detection of the hard ISR photon allows BABAR to cover a large energy range from threshold up to for the two processes. The cross section is obtained from the to ratio, so that the ISR radiation function cancels, as well as additional ISR radiative effects. Since FSR photons are also detected, there is no additional uncertainty from radiative corrections at NLO level. Experimental systematic uncertainties are kept to 0.5% in the peak region (0.6–0.9), increasing to 1% outside.
3 Combining cross section data
The requirements for averaging and integrating cross section data are: () properly propagate all the uncertainties in the data to the final integral error, () minimise biases, i.e., reproduce the true integral as closely as possible in average and measure the remaining systematic error, and () optimise the integral error after averaging while respecting the two previous requirements. The first item practically requires the use of pseudo-Monte Carlo (MC) simulation, which needs to be a faithful representation of the measurement ensemble (with all known correlations) and to contain the full data treatment chain (interpolation, averaging, integration). The second item requires a flexible data interpolation method (the trapezoidal rule is not sufficient as shown below) and a realistic truth model used to test the accuracy of the integral computation with pseudo-MC experiments. Finally, the third item requires optimal data averaging taking into account all known correlations to minimise the spread in the integral measured from the pseudo-MC sample. The details of our newly developed combination procedure (HVPTools) are given in Ref. .
HVPTools transforms the bare cross section data and associated statistical and systematic covariance matrices into fine-grained energy bins, taking into account to our best knowledge the correlations within each experiment as well as between the experiments (such as uncertainties in radiative corrections). The covariance matrices are obtained by assuming common systematic error sources to be fully correlated. To these matrices are added statistical covariances, present for example in binned measurements as provided by KLOE, BABAR or the data, which are subject to bin-to-bin migration that has been unfolded by the experiments, thus introducing correlations.
The interpolation between adjacent measurements of a given experiment uses second order polynomials. This is an improvement with respect to the previously applied trapezoidal rule, corresponding to a linear interpolation, which leads to systematic biases in the integral. In the case of binned data, the interpolation function within a bin is renormalised to keep the integral in that bin invariant after the interpolation. The final interpolation function per experiment within its applicable energy domain is discretised into small (1) bins for the purpose of averaging and numerical integration.
The average weights of the interpolated measurements from different experiments contributing to a given energy bin takes into account the precision and the correlations of different measurements and experiments, as well as different measurement densities or bin widths within a given energy interval. This provides an optimal final uncertainty on .
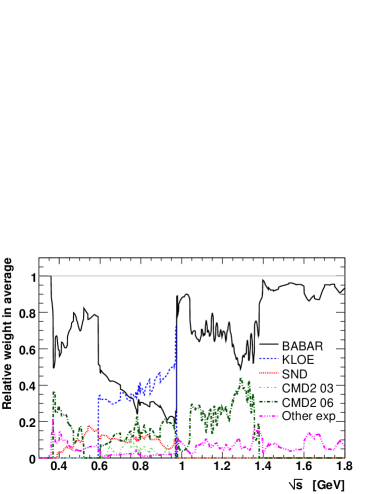
The left hand plot of Fig. 1 shows the weights versus the different experiments carry in the average. BABAR and KLOE dominate over the entire energy range, completely covered by BABAR.
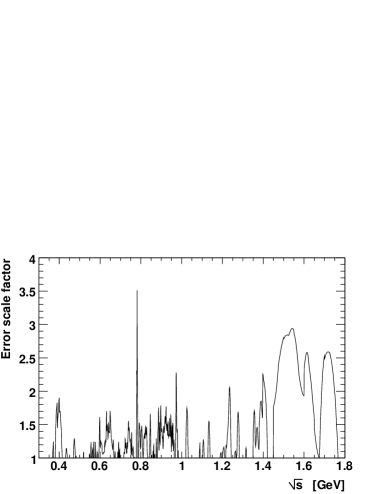
If the value of a bin-wise average exceeds the number of degrees of freedom (), the error in this averaged bin is rescaled by to account for inconsistencies (cf. Fig. 1, Right). Such inconsistencies frequently occur because most experiments are dominated by systematic uncertainties, which are difficult to estimate.
We have tested the fidelity of the full analysis chain (polynomial interpolation, averaging, integration) by using as truth representation a Gounaris-Sakurai vector-meson resonance model faithfully describing the data. The difference between true and estimated values is a measure for the systematic uncertainty due to the data treatment. We find negligible bias below (remember the unit), increasing to 0.5 (1.2 without the high-density BABAR data) when using the trapezoidal rule for interpolation instead of second order polynomials.
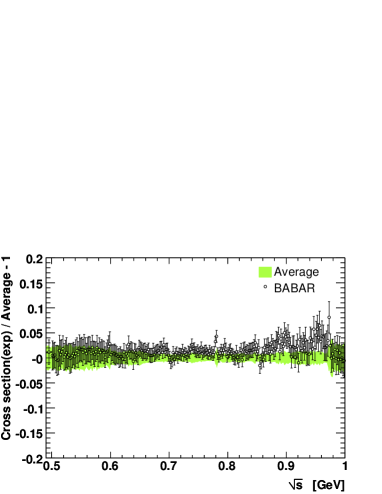
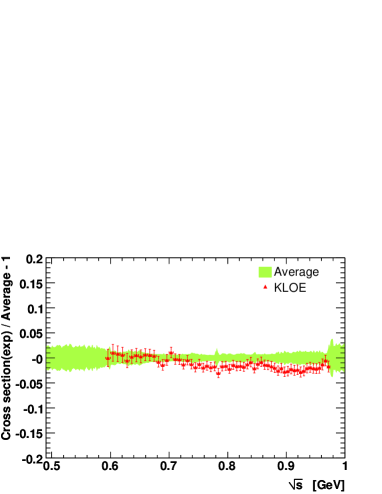
Fig. 2 shows the relative differences between BABAR, KLOE, and the average. Fair agreement is observed, though with a tendency to larger (smaller) cross sections above for BABAR (KLOE). It is interesting to point out that the same type of tendency shows up when comparing the KLOE measurement with the IB-corrected average . These inconsistencies (among others) lead to the error rescaling shown versus in Fig. 1, Right.
| Energy range (GeV) | Experiment | () |
| Combined (fit) | ||
| Combined | () | |
| CMD2 03 | () | |
| CMD2 06 | () | |
| SND 06 | () | |
| KLOE 08 | () | |
| BABAR 09 | () | |
| Combined | () | |
| Combined | () | |
| Total | Combined | |
| Total | Combined |
A compilation of results for for the various sets of experiments and energy regions is given in Table 1. The comparison with our previous result , , shows that the inclusion of the new BABAR data significantly increases the central value of the integral, without however providing a large error reduction. This is due to the incompatibility between mainly BABAR and KLOE, causing an increase of the combined error. In the energy interval between 0.63 and 0.958, the discrepancy between the evaluations from KLOE and BABAR amounts to . Using only the BABAR data to evaluate one finds , which is in very good agreement with the result from the average. Including BABAR in the global average reduced the difference between the and -based predictions to . A difference (slope) in the shape of the two spectral functions subsists however, mainly due to the difference between the average and KLOE measurement.
We also reevaluate the contribution to . The CMD2 data used previously have been superseded by modified or more recent, but yet unpublished data , recovering agreement with the published SND cross sections . Since the new data are unavailable, we discard the obsolete CMD2 data from the average, finding (compared to when including the obsolete CMD2 data).
Adding to the -based and results the remaining exclusive multi-hadron channels as well as perturbative QCD , we find for the complete lowest order hadronic term It is noticeable that the error from the channel now equals the one from all other contributions to . Adding further the contributions from higher order hadronic loops, hadronic light-by-light scattering, as well as QED and electroweak effects, we obtain the SM prediction (still in units)
where the errors have been split into lowest and higher order hadronic, and other contributions, respectively. The value deviates from the experimental average by ().

A compilation of recent SM predictions for compared with the experimental result is given in Fig. 3. The BABAR results are not yet contained in evaluations preceding the present one. The result by HMNT contains older KLOE data , which have been superseded by more recent results , leading to a slightly larger value for .
4 Conclusions
We have presented a reevaluation of the lowest order hadronic contribution to the muon magnetic anomaly in the dominant channel, using new precision data published by the BABAR Collaboration. After combination with the other data a difference with the data remains for the dominant contribution. For the full -based Standard Model prediction, including also a reevaluated contribution, we find a deviation of from experiment (reduced from without BABAR). The deviation reduces to when excluding KLOE data, and further decreases to when using only the BABAR data in the channel. As a reminder, the -based result deviates by from the Standard Model.
The present situation for the evaluation of is improved compared to that of recent years, as more input data from quite different experimental facilities and conditions have become available: energy scan, ISR from low and high energies, decays. Our attitude has been to combine all the data and include in the uncertainty the effects from differences in the spectra. At the moment the ideal accuracy cannot be reached as a consequence of the existing discrepancies due to uncorrected or unaccounted systematic effects in the data. A critical look must be given to the different analyses in order to identify their weak points and to improve on them or to assign larger systematic errors.
Problems also persist in the mode, where the and -based evaluations differ by , but also the data among themselves exhibit discrepancies. Fortunately, new precision data from BABAR should soon help to clarify the situation in that channel.
Acknowledgments
The author would like to thank M. Davier, A. Höcker, G. López Castro, X.H. Mo, G. Toledo Sánchez, P. Wang, C.Z. Yuan and Z. Zhang for their fruitful collaboration.
References
References
- [1] S.J. Brodsky and E. de Rafael, Phys. Rev. 168, 1620 (1968).
- [2] M. Davier, A. Hoecker, B. Malaescu, C. Z. Yuan and Z. Zhang, Eur. Phys. J. C 66, 1 (2010) [arXiv:0908.4300 [hep-ph]].
- [3] M. Davier et al., Eur. Phys. J. C 66, 127 (2010) [arXiv:0906.5443 [hep-ph]].
- [4] R. Alemany, M. Davier and A. Hoecker, Eur. Phys. J. C 2, 123 (1998).
- [5] ALEPH Collaboration (R. Barate et al.), Z. Phys. C76, 15 (1997).
- [6] ALEPH Collaboration (S. Schael et al.), Phys. Rep. 421, 191 (2005).
- [7] CLEO Collaboration (S. Anderson et al.), Phys. Rev. D 61, 112002 (2000).
- [8] OPAL Collaboration (K. Ackerstaff et al.), Eur. Phys. J. C 7, 571 (1999).
- [9] CMD2 Collaboration (R.R. Akhmetshin et al.), Phys. Lett. B 578, 285 (2004).
- [10] CMD2 Collaboration (V. M. Aulchenko et al.), JETP Lett. 82, 743 (2005); CMD2 Collaboration (R. R. Akhmetshin et al.), JETP Lett. 84, 413 (2006); CMD2 Collaboration (R.R. Akhmetshin et al.), Phys. Lett. B 648, 28 (2007).
- [11] SND Collaboration (M. N. Achasov et al.), JETP Lett. 103, 380 (2006).
- [12] KLOE Collaboration (F. Ambrosino et al.), Phys. Lett. B 670 285 (2009).
- [13] H. Czy, A. Grzeliska, J.H. Kühn, Phys. Rev. D 75, 074026 (2007).
- [14] M. Davier, S. Eidelman, A. Hoecker and Z. Zhang, Eur. Phys. J. C 27, 497 (2003).
- [15] M. Davier, S. Eidelman, A. Hoecker and Z. Zhang, Eur. Phys. J. C 31, 503 (2003).
- [16] G.W. Bennett et al., Phys. Rev. Lett. 89, 101804 (2002).
- [17] M. Davier, Nucl. Phys. B (Proc. Suppl.) 169, 288 (2007).
- [18] Belle Collaboration (M. Fujikawa et al.), Phys. Rev. D 78, 072006 (2008).
- [19] KLOE Collaboration (F. Aloisio et al.), Phys. Lett. B 606, 12 (2005).
- [20] B. Aubert et al. [BABAR Collaboration], Phys. Rev. Lett. 103, 231801 (2009) [arXiv:0908.3589 [hep-ex]].
- [21] CMD2 Collaboration (R.R. Akhmetshin et al.), Phys. Lett. B 466, 392 (1999).
- [22] I.B. Logashenko, Nucl. Phys. B (Proc. Suppl.) 162, 13 (2006).
- [23] SND Collaboration (M.N. Achasov et al.), Budker INP 2001-34, Novosibirsk (2001).
- [24] K. Hagiwara, A.D. Martin, D. Nomura and T. Teubner Phys. Lett. B 649, 173 (2007).
- [25] Muon Collaboration (G.W. Bennett et al.), Phys. Rev. D 73, 072003 (2006).
- [26] F. Jegerlehner and A. Nyffeler, Phys. Rept. 477, 1 (2009).