22institutetext: Laboratoire d’Astrophysique de Grenoble, UJF/CNRS, BP 53, 38041 Grenoble Cedex 9, France
33institutetext: Laboratoire APC, Université Paris Diderot, 10, rue A. Domon et L. Duquet 75205, Paris Cedex 13, France
Dead zones in protostellar discs: the case of Jet Emitting Discs
Abstract
Context. Planet formation and migration in accretion discs is a very active topic. Among the many aspects related to that question, dead zones are of particular importance as they can influence both the formation and the migration of planetary embryos. The ionisation level in the disc is the key element in determining the existence and the location of the dead zone. This has been studied either within the Standard Accretion Disc (SAD) framework or using parametric discs.
Aims. In this paper, we extend this study to the case of Jet Emitting Discs (JED), the structure of which strongly differ from SADs because of the new energy balance and angular momentum extraction imposed by the jets.
Methods. We make use of the () density distributions provided by self-similar accretion-ejection models, along with the JED thermal structure derived in a previous paper, to create maps of the ionisation structure of JEDs. We compare the ionisation rates we obtain to the critical value required to trigger the magneto-rotational instability.
Results. It is found that JEDs have a much higher ionisation degree than SADs which renders very unlikely the presence of a dead zone in these discs.
Conclusions. As JEDs are believed to occupy the inner regions of accretion discs, the extension of the dead zones published in the literature should be re-considered for systems in which a jet is present. Moreover, since JEDs require large scale magnetic fields close to equipartition, our findings raise again the question of magnetic field advection in circumstellar accretion discs.
Key Words.:
accretion, accretion discs—ISM: jets and outflows—Stars:formation, X-rays1 Introduction
A detailed knowledge of the dynamics and chemistry of protostellar accretion discs is unavoidable if one is to understand the initial conditions of planet formation and the environment in which their migration proceeds. The theory of protostellar accretion discs has been widely developed since the seminal work of Shakura & Sunyaev (1973) and is commonly set in the framework of the standard accretion disc (SAD) in which viscosity is the sole agent to remove angular momentum and allow accretion (e.g. Pringle 1981; D’Alessio et al. 1998; Hueso & Guillot 2005). The current paradigm is that this is done through MHD turbulence, triggered and sustained in the disc by the magneto-rotational instability (hereafter MRI, Balbus & Hawley 1991).
This instability requires a good coupling between the disc material (mostly neutrals) and the magnetic field, therefore requires a minimum degree of ionisation to exist. If the ionisation level is not high enough for the MRI to exist, the viscosity is very low: this results in a very low level of accretion in the corresponding region of the disc, then termed “dead zone” (Gammie 1996). Dead zones may play an important role in the field of planet formation and migration. Rossby vortices can be triggered at the interface between an active and a dead zone, trapping solids within them and leading to a burst of planet formation (Varnière & Tagger 2006; Lyra et al. 2009). They also have been put forward as an agent able to halt planetary migration, a long-standing issue in explaining planetary systems such as our own (Masset et al. 2006; Matsumura et al. 2009). Locating dead zones in an accretion disc is therefore an important task. Several authors have studied this question, generally using either i) a passive disc (Glassgold et al. (1997) uses a power-law disc, Matsumura & Pudritz (2003) the passive disc from Chiang & Goldreich (1997)), or ii) a standard accretion disc (Fromang et al. 2002). These studies show that a dead zone can generally exist in the inner parts of accretion discs, typically extending from 0.1–1 AU up to a few AU.
Another way to indirectly probe the physics of the inner disc regions is to look at the jets from these sources. Bipolar jets are fundamental to star formation and are observed from the earliest (Class 0) to the latest stages (classical TTauri stars, Class 2) of the process. They are believed to originate from the inner disc (up to a few AU), precisely where the aforementioned works predict the existence of a dead zone. Extended MHD disc winds are, to date, the best candidates to explain jet kinematics (Ferreira et al. 2006). Because they change the energy balance of the disc, the jet emitting disc (JED) structure differs from that of the SAD one. This was shown in Combet & Ferreira (2008) (paper I hereafter) and questions the existence dead zones in the inner parts of jet launching discs. This is the issue we address in the present paper which is outlined as follows. We start by a quick recap of disc wind solutions and JED structures in section 2. Section 3 presents the procedure we follow to calculate the ionisation level of a JED while the results are shown in section 4. Finally, discussion and conclusions are drawn in section 5.
2 Jet Emitting Discs: a quick reminder
It is widely accepted that protostellar jets observed in young stellar objects (YSOs) are launched from the surface of accretion discs via the magneto-centrifugal launching mechanism, originally developed by Blandford & Payne (1982). Solutions to the problem have generally been found by treating the disc as a boundary condition (Blandford & Payne 1982; Vlahakis et al. 2000), hence preventing any quantification of the interplay between the disc and the jet. This difficulty has been lifted in the self-similar framework of the Magnetised Accretion-Ejection Structures (MAES) model, where the set of steady-state MHD equations are consistently solved, going from the resistive regime within the disc to the ideal MHD wind/jet (Ferreira & Pelletier 1995; Ferreira 1997; Casse & Ferreira 2000a; Ferreira & Casse 2004). MAES rely on a self-sustained turbulence to provide the required anomalous transport of magnetic field (through an effective magnetic diffusivity), along with magnetic fields smaller than, but close to, equipartition (i.e., the plasma ). This may appear problematic as the magneto-rotational instability, invoked as the source of turbulence, is known to be quenched whenever the field reaches equipartition. This difficulty is lifted when remembering that (1) MAES are close to but always below the marginal stability limit for the MRI (Balbus & Hawley 1991; Gammie & Balbus 1994) (2) the MRI could still persist at equipartition (Blokland et al. 2005). Note also that other sources of MHD turbulence could be at work around equipartition in a medium as complex as a stratified accretion disc (Keppens et al. 2002).
2.1 Self-similar MAES solutions
In the present study we use a disc wind solution undergoing a surface heating described in Casse & Ferreira (2000b). Due to this heating, the vertical plasma pressure is increased which enhances substantially the jet mass load. This additional heating was assumed to be powered by dissipation of MHD disc turbulence and parametrised as a tiny fraction of the disc accretion power ( in the solution chosen here). This new class of solutions, referred to as “warm” in Pesenti et al. (2004), is still “cold” in a dynamical sense as the initial thermal energy remains negligible compared to gravity, and wind acceleration is still mostly magnetic. The disc ejection efficiency is defined by . While isothermal disc wind models provide around 0.01, these warm models can achieve larger values. For the solution used here, we have from a disc of aspect ratio , where is the disc half thickness. If the JED is established between say, AU and AU111The question of the radial extension of the launching region of the disc has been debated at length. If X-wind configurations, where the jet comes from the innermost region of the disc (Shu et al. 2000), could surely contribute to the mass loss, an extended disc-wind component appears indispensable, especially in the younger Class I objects (Ferreira et al. 2006)., this translates into an ejection to accretion mass rates ratio to , in agreement with observations. The asymptotic poloidal jet velocity is a factor larger than the keplerian velocity at the field line footpoint, where is a measure of the magnetic lever arm (Ferreira 1997). With , this model is found to reproduce well several observed properties of atomic T Tauri jets such as the rotation signatures, the ejection to accretion ratio, and the centroid velocities in atomic spectra along the jet axis (e.g. Pesenti et al. 2004; Cabrit 2007).
The resulting () distribution of density is shown in fig. 1 along with some streamlines (black solid lines). Note that the range of launch radii produces an “onion-like” structure with a fast, dense axial beam surrounded by progressively slower and wider streamlines that recollimate on larger scale, producing a high apparent jet collimation. This is however not shown here as this work focuses on the properties of the Jet Emitting Disc only. As can be seen on the figure, only the upper layers of the disc are deviated into the outflow, while most of the material ends up at the inner boundary of the disc, to be accreted by the protostar.
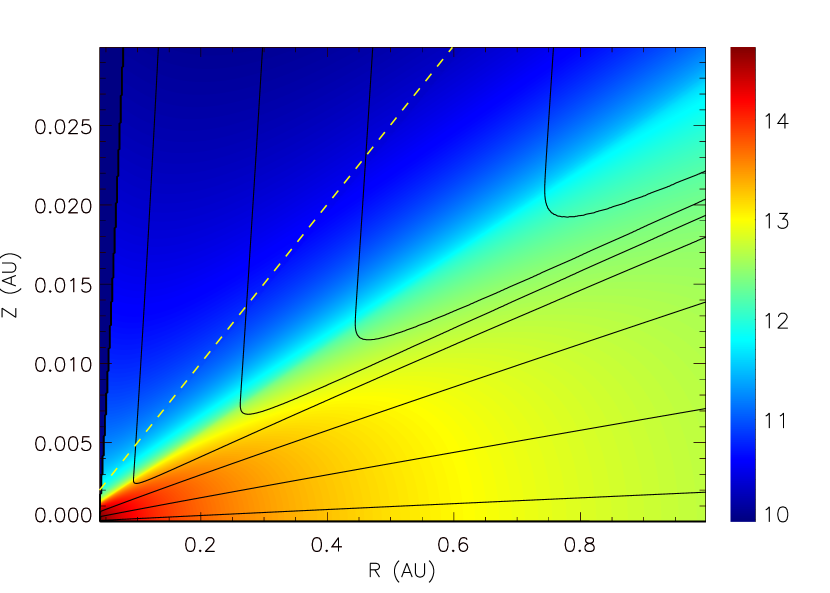
The global picture of a protostellar accretion disc would then be the following (see fig.1 of paper I): i) in the inner parts from ( to ), a jet emitting disc (JED) having MAES properties and ii) a standard accretion disc (SAD) from to . As mentioned above, SADs rely solely on the radial viscous transport of angular momentum for accretion to proceed. Conversely, MAES solutions show that as soon as a powerful jet is present, most of the angular momentum and energy within the disc are evacuated vertically in jets. This suggests that JEDs should have a very different structure than SADs and is developed hereafter.
2.2 The jet emitting disc’s structure
In paper I, we analytically derived the radial properties of JEDs for a given protostellar mass and mass accretion rate in the disc . This was done in a formalism analogous to that of SADs, but using the energetic balance suggested by the MAES solutions. It was found that for a given combination, a JED is cooler, lighter and thinner than its equivalent SAD (we refer the reader to that paper for more details).
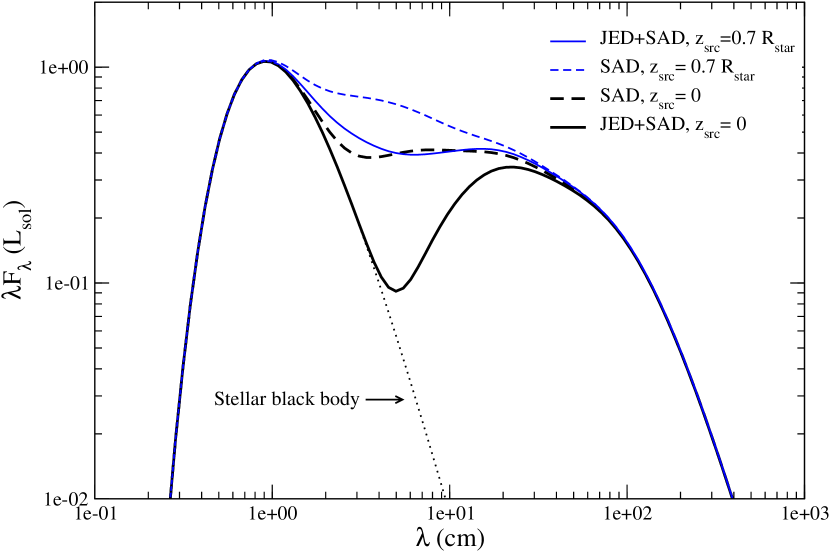
Its lower temperature should allow for the presence of a JED to be tested by the spectral energy distribution (SED) of the disc. This was illustrated using very crude assumptions222In fig. 4 of paper I we calculated the SED assuming a given incident angle for the radiation. This lead to an overestimation of the irradiation flux in the inner parts of the disc making it too bright at small wavelength. This is corrected here by using the calculated JED geometry consistently to estimate the incident angle at each radius. The qualitative conclusions of paper I are unchanged, simply the actual values of the flux. for the disc geometry in paper I. Therefore, we present an updated version of the SED in fig. 2 for illustrative purposes. Both viscous heating and illumination from the central object are included in the SED calculation. Assuming most of the irradiation comes from the hot spot of the accretion column onto the protostar, we calculate the SED for two altitudes of the hot spot, and . We consider both the cases where the SAD extends down to and where it is supplemented by a JED in the inner parts, with AU. As can be seen in fig. 2, for a given spot altitude, there is a clear signature of the presence of the JED. However, it appears very hard to distinguish between a JED+SAD configuration with and a single SAD with . This simple example illustrates that one cannot solely rely on the SED to test for the presence of a JED in a given system. But this indirect method should nevertheless prove useful when used in combination with other diagnostics (e.g. jet kinematics, Ferreira et al. 2006).
3 Calculating the disc ionisation
Several agents can contribute to the ionisation of an accretion disc. In his seminal work on dead zones, Gammie (1996) considered ionisation by the cosmic ray background only, of a power-law disc. Using a passive disc, Matsumura & Pudritz (2003) included in their calculations ionisation from cosmic rays, X-rays and radioactive decays (that remains marginal) in the disc. They concluded that cosmic ray (CRs) ionisation was the leading process while the X-ray contribution could become dominant if the X-ray photon energy was sufficient ( keV). This result certainly holds if CRs can reach the disc. However it has been argued that they may not be able to do so because of the winds associated to star formation, in which case, X-ray ionisation becomes fundamental again (Glassgold et al. 1997; Fromang et al. 2002). This is particularly true for JEDs that are, by definition, the source of a strong wind that eventually recollimates into a jet. Therefore, we only focus in this paper on the X-ray ionisation of the JEDs.
3.1 Ionisation rate from X-rays
A well known result from X-ray ionisation studies is that the ionisation rate is dominated by secondary ionisation, i.e. the ion pairs collisionnaly produced by a fast primary photo-electron (Krolik & Kallman 1983). The X-ray ionisation rate is written as (Matsumura & Pudritz 2003 and references therein)
| (1) |
with
| (2) |
where is the source X-ray luminosity, is the distance from the source, the energy of the photons, is the absorption cross section, eV is the average energy required for ion pair production333The parenthesis should read , as the energy of the primary photo-electron depends on the ionisation potential () of the medium. However, is a few eV whereas keV. and is the attenuation factor. The latter is calculated using and is function of the optical depth, with the column density along the line of sight, and of the cut-off energy . The absorption cross section is energy dependent and expressed as
with cm2 and (Glassgold et al. 1997; Igea & Glassgold 1999; Fromang et al. 2002).
3.2 Recombination processes
Electrons in an accretion disk may recombinate via several channels, by interacting with both the gas and dust grain phases. Dissociative recombinations in the gas phase have been extensively studied both theoretically and experimentally, giving a relatively well-defined picture of recombination with molecular or metallic ions (for a review, see Florescu-Mitchell & Mitchell 2006).
The picture becomes however far more complicated when gas-grain chemistry is considered. Several authors have investigated the importance that recombinations of electrons on the surface of dust grains may play on the ionisation level of accretion discs (Sano et al. 2000; Semenov et al. 2004; Ilgner & Nelson 2006; Wardle 2007; Salmeron & Wardle 2008). It is generally found that including grain chemistry decreases the ionisation level of the disc (with respect to the results of gas-phase calculations only), provided that the grains are small enough () and well-mixed with the gas, on the whole disc thickness (Sano et al. 2000; Ilgner & Nelson 2006). These conditions may not always be fulfilled as theoretical considerations and SEDs of TTauri accretion disks suggest that grains grow and settle onto the disc midplane during the protostellar evolution (Dullemond & Dominik 2004; D’Alessio et al. 2006). Note also that in most of the models in Ilgner & Nelson (2006), the gas-only and gas-grain chemistry converge in the inner disc ( AU), where dust grains may not survived. Finally, the detailed numerical studies investigating the effect of dust grains on the MRI (Salmeron & Wardle 2008; Turner et al. 2010), generally do so at distances of a few AU that are not relevant to the JED.
Given the complexity and uncertainty surrounding the grain chemistry and distribution in the discs, we restrict ourselves to recombination processes in the gas-phase for the remainder of this paper. This choice is motivated by the fact that JED are relevant only to the innermost regions of the discs, where dust grains may not survive and where it is difficult to extrapolate the results of existing studies.
3.3 Ionisation fraction
The ionisation fraction is generically obtained from the solution of the evolution equation of the electronic density . Considering the gaseous phase only, this evolution is described by system of coupled equations (e.g. Fromang et al. 2002)
| (3) | |||||
where and are the density of metals and metal ions respectively, is the density of molecular ions, the ionisation rate is given by eq. (1), is the dissociative recombination rate, is the radiative recombination rate and is the rate of charge transfer between molecular ions and metal atoms.
Steady-state, that is assumed in a majority of the studies published in the subject, is valid if the ionisation and recombination timescales are shorter than the accretion timescale in the disc. This is true for SADs as they are characterised by a slow inward radial velocity, hence long accretion timescales. Also assuming no metals (), eq. (3) leads to
| (4) |
A priori, more caution is necessary in the case of JEDs where the accretion proceeds much faster, namely at sonic velocities. For a JED, the accretion timescale is therefore given by
| (5) |
while the ionisation and recombination timescales obtained from eq. (3) read
| (6) |
and
| (7) |
In steady-state, these two latter timescales are equal, . For our calculations, we first assume that steady-state holds and we check a posteriori (in §4.1) the extent to which this hypothesis is valid.
3.4 Dead zones and critical ionisation rate
The MRI, that arguably provides the disc’s anomalous viscosity and resistivity (Lesur & Longaretti 2009; Guan & Gammie 2009), only sets in if the Alfvénic time scale is shorter than the diffusion time scale due to electron-ions collisions. Given the Alfvén velocity of the medium and the disc scale height , this criterion translates into a magnetic Reynolds number that must be greater than a critical value . The value of the critical Reynolds number is known to depend on various factors, such as the presence of a net magnetic flux through the disc, but is not firmly established yet. Therefore, we adopt the approach widely found in the literature and consider both and . Using the Ohmic resistivity (Blaes & Balbus 1994)
and the fact that a JED requires a magnetic field close to equipartition (Ferreira & Pelletier 1995), this condition becomes444Gammie (1996) gives an equivalent expression of for a SAD using Hayashi (1981)’s resistivity and the central disc temperature instead of the disc aspect ratio .
| (8) |
where is the disc aspect ratio. From eq. (4) and using the disc vertical hydrostatic equilibrium, the definition of the accretion rate and the collisional recombination rate (e.g. Fromang et al. 2002) one gets the ionisation fraction to be
| (9) | |||||
Inverting eq. (8), this leads to a critical ionisation rate
| (10) | |||||
Note that this result is obtained for the typical recombination rate mentioned above.
3.5 X-ray properties of young stellar objects
Young stellar objects of all stages (Class 0 to III) are known to be X-ray emitters. In the 1980’s, the first discoveries were made by the Einstein X-ray observatory in the less embedded objects (Class II and III, e.g. Feigelson & Decampli 1981). The ASCA and ROSAT satellites allowed the detection of X-rays from Class I protostars during the following decade (e.g., Koyama et al. 1996; Grosso et al. 1997). More recently, the Chandra Orion ultra-deep project (COUP) survey, revealed X-ray detection in the youngest Class 0 objects (e.g. Prisinzano et al. 2008).
YSOs typical X-ray luminosities range between erg s-1, with flares reaching erg s-1 and with typical photon temperatures of keV. Quiescence properties may vary slightly from one class of object to another but typical values are erg s-1 and keV (Imanishi et al. 2003; Favata et al. 2005; Wolk et al. 2005).
Using the statistics of the COUP survey, Wolk et al. (2005) determined a rate of one flare per week per star, with flare durations ranging from a few hours up to 3 days. The flare luminosities, spectral properties and variability distributions appear fairly constant through all the stages of protostellar evolution, suggesting single underlying mechanism (Prisinzano et al. 2008). Fiducial flare characteristics are erg s-1 and a spectrum harder than in quiescence, keV.
One might expect these flares to be due to reconnection events in magnetic loops connecting the protostar to its circumstellar disc. However, Getman et al. (2008b) found no differences between accreting and disc-free systems (i.e. Class II and Class III). Thus, these reconnection events must be related to magnetic loops in the stellar magnetosphere alone. The size of these loops, hence the location of the X-ray emitter, can be estimated from the flare properties but remain “flare-model” dependent. From the COUP survey, Getman et al. (2008a) obtains half-lengths of cm.
From the above, we see that the X-ray source alone introduces three parameters in the problem: i) its luminosity , ii) the photon temperature and iii) its location/altitude , linked to the magnetic tube length. These three parameters will be systematically varied within their (reasonable) respective ranges.
3.6 Choosing the appropriate self-similar solution
Using eq. (1), we wish to calculate the ionisation rate of a JED for a given set of . To that end, the appropriate MAES solution needs to be selected. On the one hand, each gives rise to a unique JED aspect ratio profile , as shown in paper I (see also fig. 8). Such a profile is in particular strongly dependent on the dominant opacity regime, which varies along the radius. On the other hand, a self-similar MAES solution is characterised by a specific value of . Therefore, for a given system (), we have to select a self-similar solution whose best matches that of the JED radial structure555There naturally is a degeneracy in , several combinations of which giving rise to approximately the same values of . However, this is not a point we wish to explore in the present paper..
Our system’s canonical physical parameters are inspired from the Class I/II object DG Tau and read and yr-1. For these values the JED radial profile calculation gives an average value over the JED extension of (Paper I). As described in Paper I, this calculation is valid in the optically thick regime which extends, for these particular parameters, up to AU. The MAES solution shown in fig. 1 is characterised by and is the reference solution that will be considered in the following section. We also arbitrarily choose a radial extension of AU only, well inside the validity region of the JED calculation.
4 Results
Before exploring the question of the existence or absence of a dead zone in JEDs (§4.2), we first present the validity range of the steady-state hypothesis we make.
4.1 Timescales and steady-state
To infer the ionisation fraction from the ionisation rate using eq. (4), steady-state is assumed. Once the ionisation rate and fraction are known, we can verify a posteriori whether or not this hypothesis holds (), using eq. (5) and eq. (6). Although this check can only be done once the calculations in §4.2 are performed, it seems more relevant to present these considerations beforehand.
As evoked by fig. 1, the problem should be treated in a full 2D configuration. However, we present several results at the disc midplane. Indeed, it is the hardest part of the disc to ionise because of the amount of material the X-rays have to cross, and is therefore the most constraining location to look at.
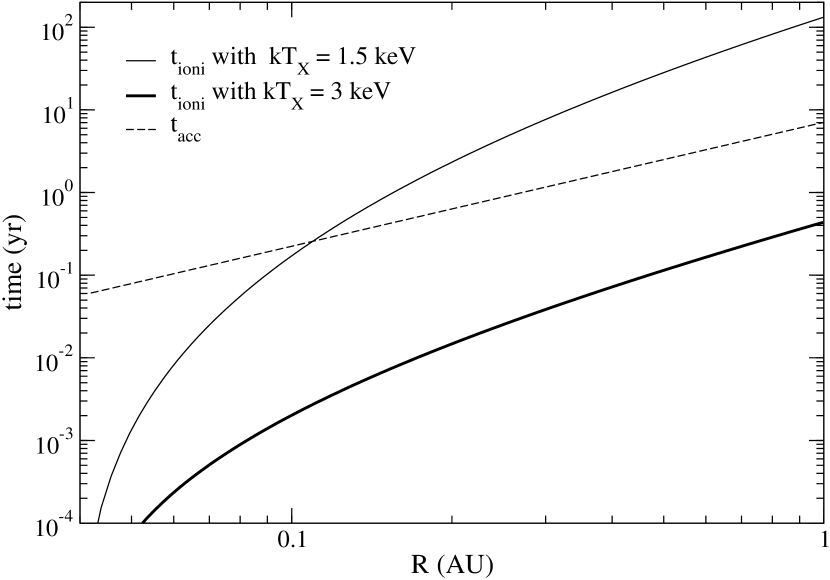
The radial evolution of the accretion and midplane ionisation timescales are plotted in fig. 3. When the system’s physical properties are fixed (, , ), the accretion time (dashed line) simply scales as . The solid lines represent the evolution of the ionisation timescale, for a source located in with erg s-1. For a 3 keV photon (thick solid line), the ionisation time is always shorter than the dynamical one which validates the use of the steady-state for this configuration. This is not the case for the 1.5 keV photon (thin solid line) where the ionisation time is longer than the accretion time when AU. This is just an example illustrating a situation where the full time-dependent treatment should be used.
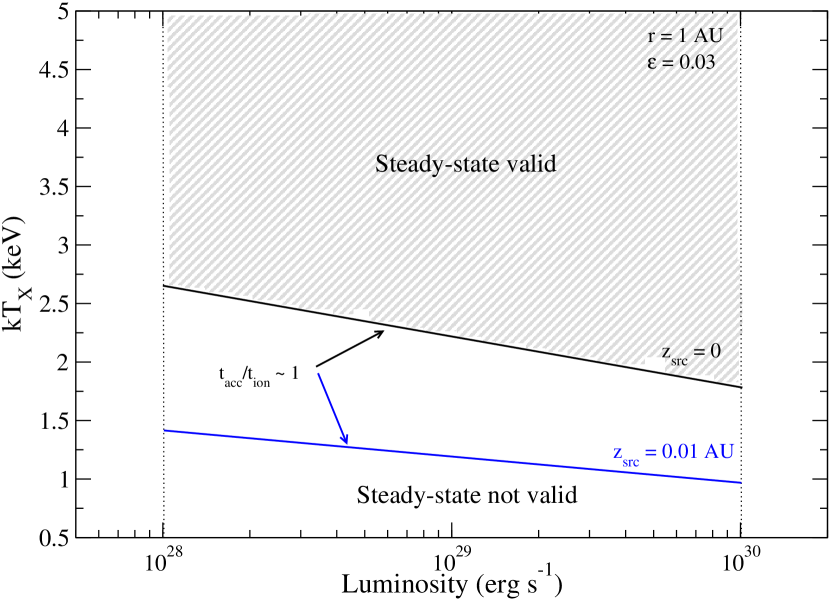
Figure 4 summarises the validity regime of the steady-state hypothesis at AU (again, more constraining than any smaller radii). In the luminosity-photon energy plane, the solid black and blue lines locate where for and respectively. Above the line, steady-state can be assumed whereas it fails below it. The frontier between the two regimes naturally changes with both luminosity and photon energy: a high luminosity compensate for a small photon temperature and vice versa. The source altitude is also a critical parameter: most of the parameter space is covered by the steady-state hypothesis for (blue line), whereas it is not the case for (black line). For the latter, a time dependent approach should be used for the lowest photon temperatures ( keV).
The validity of the steady-state hypothesis depends on the X-ray source parameters (luminosity, energy, location). Overall, this approach holds on most of the parameter space. In the following we restrict ourselves to steady-state calculations, keeping in mind they break down for unfavourable combinations of the parameters.
4.2 Ionisation of JEDs
4.2.1 Ionisation rates
The ionisation rate of the MAES solution presented in fig. 1 is calculated using eq. (1). A MAES box ensures the convergence of the column density numerical integration necessary for the optical depth calculation. The attenuation factor given by eq. (2) is computed from to (Matsumura & Pudritz 2003).
Maps of the log-ionisation rate of our reference MAES structure are given in fig. 5 for a X-ray source located in (left panel) and (right panel).
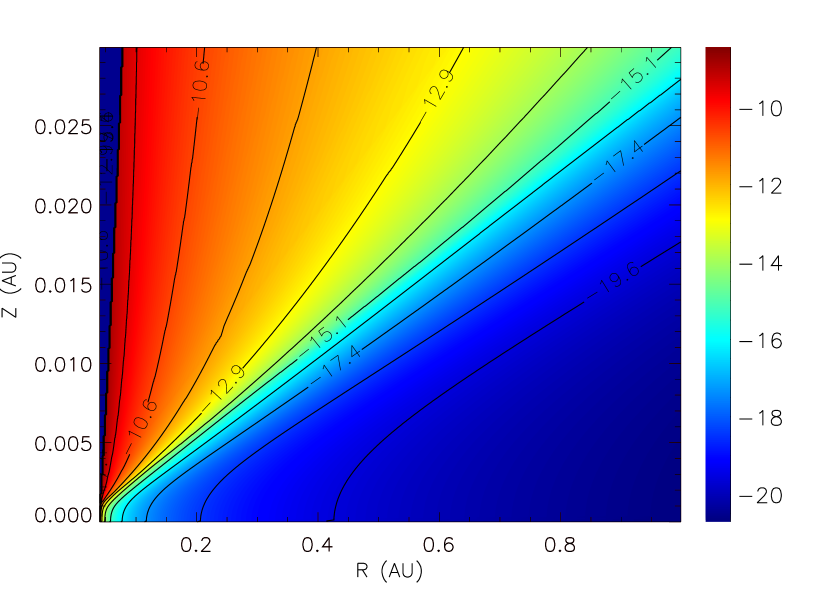
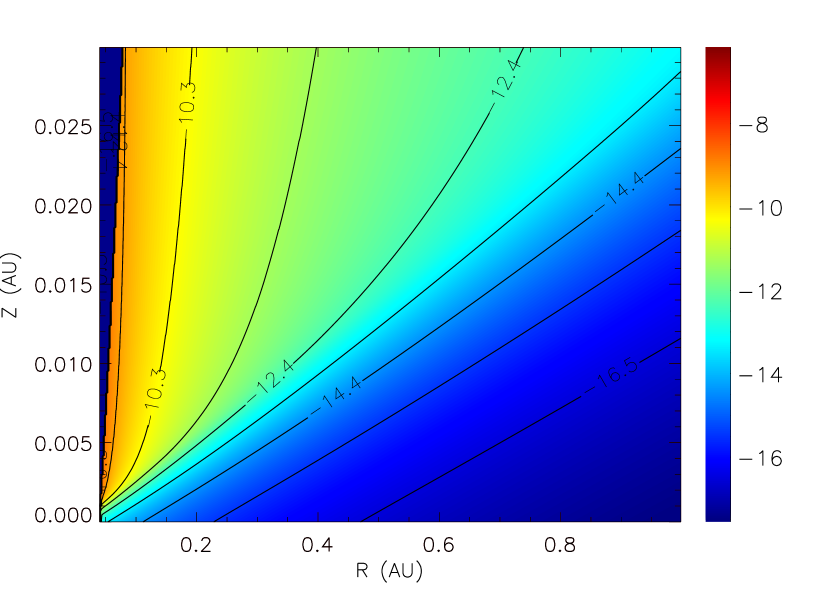
As for the density map, the black area near the vertical axis is the region where the self-similar solution is not defined. The ionisation rate spans over ten orders of magnitude, from s-1 in the wind to s-1 in the disc. The importance of the X-ray source location is visible when comparing the two maps. Moving slightly the source from to is enough to increase the ionisation rate of the disc by two orders of magnitude. As will be seen later, going to higher altitudes (reconnection of magnetic loops) has an even more drastic effect.
4.2.2 Dead zones
In this section, we compare the disc midplane ionisation rate to the critical rate given by eq. (10). Note that our aim in doing so is not to determine with precision the geometry of the dead zone (thickness, extension) but rather to hint at the possibility for a JED to host one. For that reason, all the results we present here are located at the disc midplane, which is the hardest region of the disc to ionise. If , the mid-plane is MRI-active and no dead zone is present anywhere, whereas the opposite case tells us that the disc may harbour a dead zone, without specifying its thickness.
The canonical parameter configuration is erg s-1, keV and . We systematically explore the parameter space and results are presented in fig. 6. Each panel shows the radial variation of and the red horizontal line represents the critical value (corresponding to ). Note that the critical rate does not depend on the X-ray source properties and remains constant (at a given radius) throughout: a change in the ratio translates directly into the same change in .
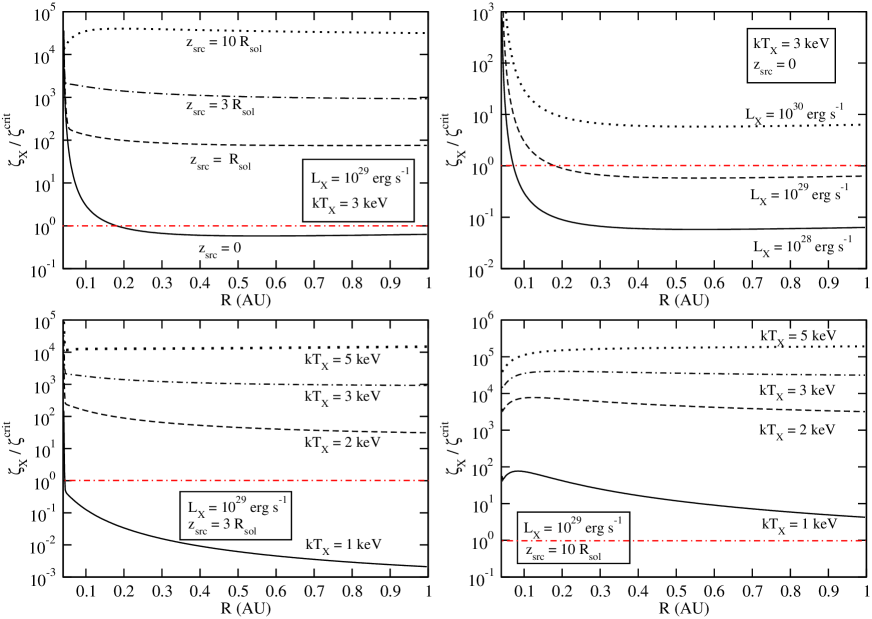
X-ray source location — fig. 6 upper left panel
As already briefly shown in fig. 5, the location of the source w.r.t. the disc midplane is an important parameter. This is made clearer by the upper left panel of fig. 6 where the ionisation rate varies over 4 orders of magnitude when the source moves from to (reconnection in magnetic loop). A change in the radial profile is also noticeable due to the change of geometry with the source acting as a lamp post on the entire disc for the highest altitudes. For all these configurations, the steady-state hypothesis is valid (see fig. 4) and the disc appears slightly sub-critical (i.e. with a possibility of dead zone) only when . But this is inconsistent with the way we believe these X-rays are actually produced.
Luminosity — fig. 6 upper right panel
The ionisation rate is directly proportional to the luminosity of the source and the effect is therefore straightforward. The source is located in and for the lowest luminosity, a significant part of the disc should harbour a dead zone. However, for this low luminosity, the steady-state hypothesis is only marginally valid and a time-dependent approach should be used to confirmed this result. Nevertheless, even for the lowest luminosity used, the dead zone disappears as soon as the source is displaced at a slightly higher altitude (not shown here).
Photon temperature — fig. 6 lower panels
The ionisation rate is also very sensitive to the photon temperature. The two bottom panels in fig. 6 show the evolution of the ratio when is changed between 1 to 5 keV. First of all, with a source in (left), the MRI is active in the entire JED if keV. For lower energies, the disc midplane appears strongly sub-critical, implying the existence of a dead zone. However, for this lowest temperature, the a posteriori verification showed that this was a regime where steady-state could not be assumed () and we cannot conclude in the presence of a dead zone without a full time-dependent study.
This timing issue is solved when the X-ray source comes from some reconnection event (, right panel). In that case, the ionisation rate is always larger than its critical value, whatever the energy of the X-ray photons. No dead zone can be present.
Recombination process
In order to calculate the ionisation fraction , we have assumed that dissociative recombination with molecular ions was the main mechanism, and parametrised it with an effective value (Igea & Glassgold 1999; Fromang et al. 2002; Matsumura & Pudritz 2003). This value actually depends of the composition of the gas, each species having its own recombination rate. Theoretical and experimental studies give a range of individual parametrisations (with often found 0.5, Florescu-Mitchell & Mitchell 2006). Using these values, several authors have treated the full, or a reduced, chemical reaction network in their dead zone calculation (e.g., Sano et al. 2000; Semenov et al. 2004), but this is beyond the scope of the present paper. When metals dominate, radiative rather than collisional recombination occurs, in which case (Fromang et al. 2002; Matsumura & Pudritz 2003).
In order to evaluate the sensitivity of our results to the recombination process, a simple exercise consists in using a parametric expression for the recombination coefficient and changing the normalisation factor from to . This does not provide us with quantification for a realistic process but rather gives a feeling on how the situation changes with this coefficient666Note that when the recombination coefficient changes, so does the critical ionisation rate which is then not given by eq. (10) anymore.. For this reason, we do not present a figure but simply summarise our findings below. For the canonical parameters erg s-1, keV, it is found that:
-
•
For a source in , the steady-state hypothesis is valid on the entire radius range for , but fails below. In this regime, no dead zone is found, whatever .
-
•
If , there is no restriction to the steady-state assumption and the disc midplane is always MRI active.
Of course, these conclusions are dependent on the X-ray luminosity, the photon energy and source location. Nevertheless, even for the lowest energies and luminosities, we do not find any dead zone present in the disc, whatever , if the X-ray source comes from a reconnection event in .
Critical magnetic Reynolds number
In §3.4, it was noted that the value of the critical magnetic Reynolds number is still largely unknown. Figure 6 shows the results obtained for . The critical ionisation rate given by eq. (10) scales with . All other things being equal, fig. 6 can also be used to visualise the results obtained for simply by shifting the red “critical” line from 1 to . This configuration is clearly less favourable to the MRI. With erg s-1, only hard flares with keV and located in will provide sufficient ionisation for the MRI to be present in the entire disc. However, these limits still accommodate most of the X-ray flare properties observed in young stellar objects. We therefore conclude that, even if makes it easier for a JED to host a dead zone, this nevertheless remains unprobable given the observational X-ray properties of YSOs.
4.3 Dependency on the underlying MAES solution
All previous results on the ionisation structure of JEDs have been obtained with our reference solution. Are they strongly dependent on the solution used?
For the set of ”warm” (with additional heat deposition at the disc surface layers Casse & Ferreira 2000a) and ”cold” (e.g. isothermal magnetic surfaces Ferreira 1997) solutions we have available, we calculate the disc midplane ionisation in the way described above. For a fixed stellar mass, accretion rate and X-ray source we find that:
-
•
For a given , all warm solutions give the same disc midplane ionisation degree whatever .
-
•
The same applies to all the cold solutions.
-
•
For given and , warm and cold solutions give similar results.
-
•
For a given but different , the disc ionisation changes strongly.
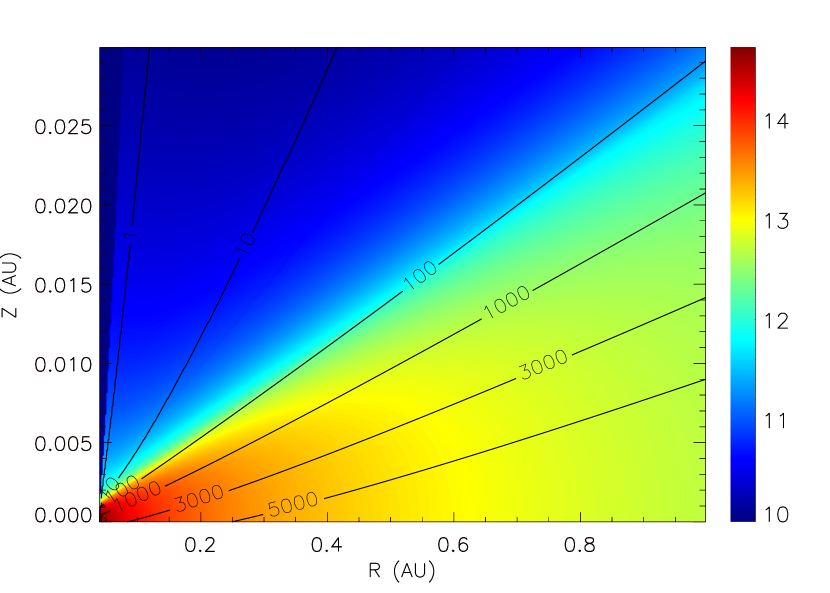
These results show that the wind properties, be it through the extra-heating term of the warm solutions or the value of the ejection index , play a very little role on the ionisation state of the disc. We do not show the corresponding plots as the almost superimposing lines give no more insight that what has already been said. The equivalence between cold and warm solutions w.r.t to the ionisation of the disc is easily understood as the wind is very tenuous, no matter what the configuration, and brings therefore a only a small contribution to the column density between the source and the disc. We illustrate the latter point in fig. 7 where the solid contours represent the optical depth , for an X-ray source located in AU, over-plotted on a density map of our reference solution. The optical depth achieved in the wind is, at best, a few percent of that in the disc and therefore expect the disc ionisation to rely solely on its density distribution, regardless of the properties of its wind.
For a given accretion rate, the local disc density depends on the amplitude of the accretion speed where is the sonic Mach number (measured here at the disc midplane), the sound speed and the Keplerian velocity. The main and major property of a JED is that accretion proceeds roughly at a sonic pace, namely . This is a consequence of having magnetic fields close to equipartition (Ferreira & Pelletier 1995) and explains why cold and warm solutions give similar results.
On the other hand, for a given accretion rate, the disc aspect ratio is a critical parameter. The density in the disc scales as (see Paper I) and the optical depth increases when decreases, resulting in a lower disc midplane ionisation rate. We conclude that the disc thickness in any MAES solution is the key element to the disc ionisation and that warm or cold solutions with the same aspect ratio are readily interchangeable in that respect.
4.4 JED ionisation during protostellar evolution
So far, the paper has dealt with the prototype of a Class I YSO ( M⊙, M⊙ yr-1) for which the JED calculation in paper I gave a disc aspect ratio . A warm MAES solution having both the right value of and appropriate Class I/II jet properties has been used to derive the ionisation degree in the JED of such a source. In order to extend this to the other stages of star formation, namely Class 0 and Class II protostars we change and accordingly and calculate the new values of following the method in paper I. As illustrated in fig. 8:
-
•
For a Class 0 object with M⊙ and M⊙ yr-1, we find an average JED aspect ratio of .
-
•
For a Class II object with M⊙ and M⊙ yr-1, we obtain .
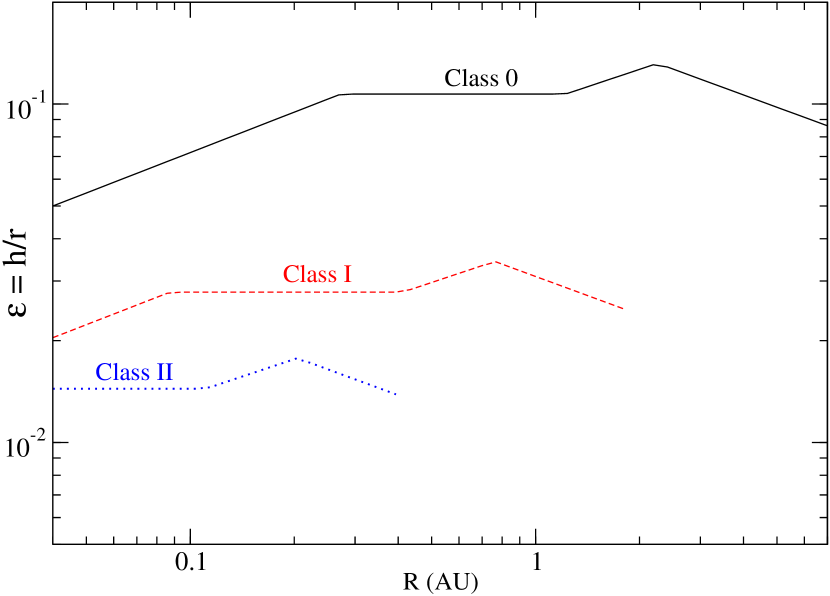
As discussed in §4.3 the disc ionisation state is independent of the jet properties. We therefore use isothermal (cold) MAES solutions with these values of as they involve no extra physical ingredient (such as additional heat input at the disc surface).
Figure 9 shows the disc midplane ionisation rate (left panel) and the ratio of the ionisation rate over its critical value (right panel) for Class 0/I/II YSO prototypes, in solid, dashed and dotted lines respectively. The ionisation rate increases when moving from the youngest to the most evolved protostars (left). This is easily explained as Class 0 discs are both denser and thicker than their more evolved counterparts, resulting in a smaller fraction of X-rays reaching the disc’s midplane.
The ratio is shown on the right panel for both quiescent (black) and flaring (blue) configuration of the X-ray source, calculated for . The red dash-dotted lines correspond to the dead zone existence threshold for or . Typical conservative quiescent X-ray properties ( erg s-1, keV, ) make the entire disc MRI-active if but inactive if , whatever the stage of stellar formation; this is especially true for the Class 0 objects. However and whatever the threshold, all types of protostars are MRI-active up to the disc’s midplane when considering X-ray flaring characteristics ( erg s-1, keV, ).
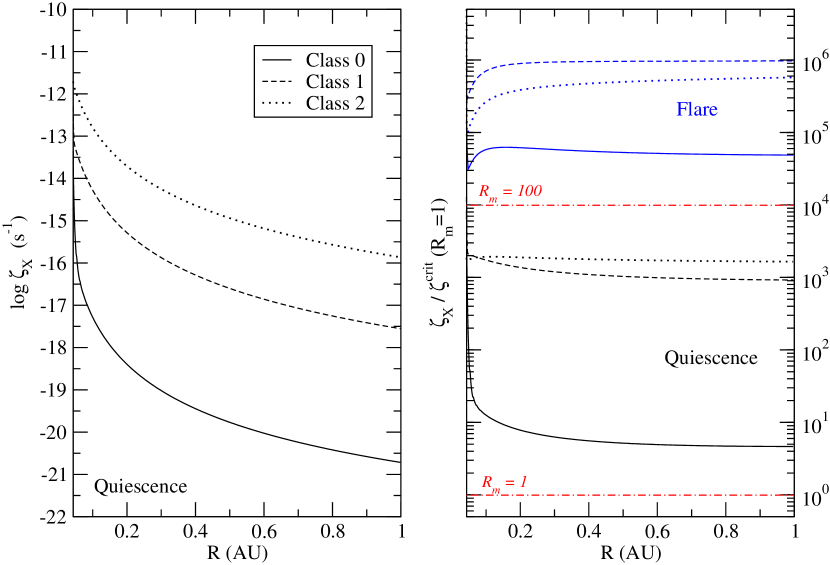
In the light of these results it appears that JEDs are very unlikely locations for dead zones to exist, whatever the evolution of the protostar may be. Class 0 JEDs are more prone to host one than Class I/II but this remains marginal and highly dependent on the quiescence X-ray source location and value of critical magnetic number.
5 Discussion and concluding remarks
We have revisited the question of the dead zones in accretion discs around young stellar objects by considering a new class of accretion solutions, Jet Emitting Discs. A JED is an accretion discs threaded by a large scale magnetic field, giving rise to self-confined jets carrying away a significant fraction of the disc angular momentum and energy. The jet emitting disc model relies on the self-similar MAES solutions, the magnetic fields of which are found smaller than, but close to, equipartition. This is close to the marginal stability criterion of the MRI, but still in the regime that allows it to be sustained.
Only a small fraction of the released accretion energy of JED is converted into heat. For a given accretion rate, a JED is therefore thinner than a standard accretion disc (SAD). Moreover, because the torque due to the jets is dominant, accretion proceeds at a speed close to the speed of sound. This, in turn, leads to discs with a column density much smaller than in SADs. This directly translates into a more penetrating X-ray radiation, resulting in a higher ionisation degree compared to that of SADs.
The ionisation structure of JEDs has been calculated using self-similar solutions along with the knowledge of their thermal structure. The radial extent of a JED is unknown as it depends on the importance of the magnetic flux available in the central regions of the disc. Thus, it certainly varies from one object to another. Moreover, for any given object, this extension will probably also vary in time from Class 0 to Class II. In this paper, the JED extent has been arbitrarily chosen between AU and AU only, as it corresponds to the location where Class I/II jets seem to be launched: AU in the Class I protostar DG Tau and a few 0.1 AU for some Class II YSO (Anderson et al. 2003; Ferreira et al. 2006). With this caveat in mind and given the X-ray properties of young stellar objects, this work has mostly ruled out the existence of dead zones in JEDs.
We did not include grain chemistry in our calculation arguing it may not be relevant to JEDs, as they occupy the innermost regions of the discs. Previous studies have also shown gas-only and gas-grain chemical networks to converge in these innermost regions, comforting our assumption. However, the earliest stages of star formation may have JED extending up to a few AU, a distance at which grains could have a significant effect. Only a model using both gas-phase and gas-grain chemistry, be it a numerical chemical network calculation (e.g. Semenov et al. 2004) or a semi-analytical approach (Okuzumi 2009) could settle this issue and this should be considered in future work.
This result must also be modulated by our ignorance of the critical value of the magnetic Reynolds number above which the disc is MRI-active. Indeed, taking allows the entire JED to be active, even during the – relatively – soft and low-luminosity quiescent state of YSOs. However, if , then the critical ionisation degree is only achieved during X-ray flares. In that case, MRI can be continuously active in the entire JED only if the recombination timescale is longer than the quiescence phase between two flares, which typically lasts a few days. This is easily done for low values of the recombination parameter (such as in the metal dominated case where cm3 s-1), but becomes more problematic for high values (i.e., cm3 s-1). In this case, we cannot exclude the possibility for a dead zone to be intermittently present in JEDs during the X-ray protostellar quiescent phases and this effect should be stronger in the youngest (Class 0) objects. That matter requires a full time-dependent treatment that is beyond the scope of the present paper.
The absence of a dead zone in the innermost regions of circumstellar accretion discs depends on the outer extent of the JED. The direct observation of jet footpoints is not yet within the reach of current instruments. In the near future, ALMA (Atacama Large Millimeter Array) may be able to directly resolve the launching regions of the closest and most powerful YSO jets, but in the meantime only indirect methods can be used. The value of and how it varies in time is an open issue as it depends on the magnetic field transport in discs. Since this transport is also dependent on the ionisation properties of the disc, we are facing here a typical ”chicken or the egg” dilemma until a self-consistent treatment is made. For Class 0/I objects, standard approaches provide an inner dead zone boundary that can be significantly smaller than 1 AU, our typical . A SAD-JED radial transition could then be operated if the vertical magnetic field reaches a value close to equipartition. Within this framework, an outer dead zone would directly connect to an inner MRI-active JED. This requires of course enough field advection in the outermost SAD and through the dead zone. This possibility clearly deserves further investigations (see for instance Rothstein & Lovelace 2008).
The general trend is nevertheless that Jet Emitting Discs have smaller densities than SADs, sonic accretion and are completely MRI-active: this makes them a hostile environment for planet formation. As a consequence, that process must be initiated and largely completed in the outer regions beyond the JED. Remarkably, several authors have pointed out the important role that the dead zone, and especially its innermost boundary, plays in both planet formation and migration processes. Indeed, solid materials may be trapped at its inner edge leading to the formation of planetary cores (Kretke et al. 2009), possibly within Rossby vortices (Varnière & Tagger 2006). This inner edge is systematically associated with a sudden decrease of the disc column density and disc scale height. It thereby provides a very efficient means to stop the inward type I migration of proto-planetary cores and may be a key ingredient to save planetary systems (Masset et al. 2006; Matsumura et al. 2009). Note that these effects would be also at work at a SAD-JED transition. If planet formation starts early on in the protostellar evolution (Class 0/I), when our results suggest that the dead zone should be truncated by a JED, then the conclusions of the above studies, if qualitatively unchanged, should be quantitatively reconsidered.
Acknowledgements.
CC acknowledges a STFC rolling grant. This work was partly supported by the European Community Marie Curie Actions - Human Resource and Mobility within the JETSET (Jet Simulations, Experiments and Theory) network under contract MRTN-CT-2004 005592. The authors also wish to thank Sylvie Cabrit and Paolo Garcia for fruitful discussions.References
- Anderson et al. (2003) Anderson, J. M., Li, Z., Krasnopolsky, R., & Blandford, R. D. 2003, ApJ, 590, L107
- Balbus & Hawley (1991) Balbus, S. A. & Hawley, J. F. 1991, ApJ, 376, 214
- Blaes & Balbus (1994) Blaes, O. M. & Balbus, S. A. 1994, ApJ, 421, 163
- Blandford & Payne (1982) Blandford, R. D. & Payne, D. G. 1982, MNRAS, 199, 883
- Blokland et al. (2005) Blokland, J. W. S., van der Swaluw, E., Keppens, R., & Goedbloed, J. P. 2005, A&A, 444, 337
- Cabrit (2007) Cabrit, S. 2007, in IAU Symposium, Vol. 243, IAU Symposium, ed. J. Bouvier & I. Appenzeller, 203–214
- Casse & Ferreira (2000a) Casse, F. & Ferreira, J. 2000a, A&A, 353, 1115
- Casse & Ferreira (2000b) Casse, F. & Ferreira, J. 2000b, A&A, 361, 1178
- Chiang & Goldreich (1997) Chiang, E. I. & Goldreich, P. 1997, ApJ, 490, 368
- Combet & Ferreira (2008) Combet, C. & Ferreira, J. 2008, A&A, 479, 481 (paper I)
- D’Alessio et al. (2006) D’Alessio, P., Calvet, N., Hartmann, L., Franco-Hernández, R., & Servín, H. 2006, ApJ, 638, 314
- D’Alessio et al. (1998) D’Alessio, P., Canto, J., Calvet, N., & Lizano, S. 1998, ApJ, 500, 411
- Dullemond & Dominik (2004) Dullemond, C. P. & Dominik, C. 2004, A&A, 421, 1075
- Favata et al. (2005) Favata, F., Flaccomio, E., Reale, F., et al. 2005, ApJS, 160, 469
- Feigelson & Decampli (1981) Feigelson, E. D. & Decampli, W. M. 1981, ApJ, 243, L89
- Ferreira (1997) Ferreira, J. 1997, A&A, 319, 340
- Ferreira & Casse (2004) Ferreira, J. & Casse, F. 2004, ApJ, 601, L139
- Ferreira et al. (2006) Ferreira, J., Dougados, C., & Cabrit, S. 2006, A&A, 453, 785
- Ferreira & Pelletier (1995) Ferreira, J. & Pelletier, G. 1995, A&A, 295, 807
- Florescu-Mitchell & Mitchell (2006) Florescu-Mitchell, A. I. & Mitchell, J. B. A. 2006, Phys. Rep, 430, 277
- Fromang et al. (2002) Fromang, S., Terquem, C., & Balbus, S. A. 2002, MNRAS, 329, 18
- Gammie (1996) Gammie, C. F. 1996, ApJ, 457, 355
- Gammie & Balbus (1994) Gammie, C. F. & Balbus, S. A. 1994, MNRAS, 270, 138
- Getman et al. (2008a) Getman, K. V., Feigelson, E. D., Broos, P. S., Micela, G., & Garmire, G. P. 2008a, ApJ, 688, 418
- Getman et al. (2008b) Getman, K. V., Feigelson, E. D., Micela, G., et al. 2008b, ApJ, 688, 437
- Glassgold et al. (1997) Glassgold, A. E., Najita, J., & Igea, J. 1997, ApJ, 480, 344
- Grosso et al. (1997) Grosso, N., Montmerle, T., Feigelson, E. D., et al. 1997, Nature, 387, 56
- Guan & Gammie (2009) Guan, X. & Gammie, C. F. 2009, ApJ, 697, 1901
- Hayashi (1981) Hayashi, C. 1981, Progress of Theoretical Physics Supplement, 70, 35
- Hueso & Guillot (2005) Hueso, R. & Guillot, T. 2005, A&A, 442, 703
- Igea & Glassgold (1999) Igea, J. & Glassgold, A. E. 1999, ApJ, 518, 848
- Ilgner & Nelson (2006) Ilgner, M. & Nelson, R. P. 2006, A&A, 445, 205
- Imanishi et al. (2003) Imanishi, K., Nakajima, H., Tsujimoto, M., Koyama, K., & Tsuboi, Y. 2003, PASJ, 55, 653
- Keppens et al. (2002) Keppens, R., Casse, F., & Goedbloed, J. P. 2002, ApJ, 569, L121
- Koyama et al. (1996) Koyama, K., Hamaguchi, K., Ueno, S., Kobayashi, N., & Feigelson, E. D. 1996, PASJ, 48, L87
- Kretke et al. (2009) Kretke, K. A., Lin, D. N. C., Garaud, P., & Turner, N. J. 2009, ApJ, 690, 407
- Krolik & Kallman (1983) Krolik, J. H. & Kallman, T. R. 1983, ApJ, 267, 610
- Lesur & Longaretti (2009) Lesur, G. & Longaretti, P. 2009, A&A, 504, 309
- Lyra et al. (2009) Lyra, W., Johansen, A., Zsom, A., Klahr, H., & Piskunov, N. 2009, A&A, 497, 869
- Masset et al. (2006) Masset, F. S., Morbidelli, A., Crida, A., & Ferreira, J. 2006, ApJ, 642, 478
- Matsumura & Pudritz (2003) Matsumura, S. & Pudritz, R. E. 2003, ApJ, 598, 645
- Matsumura et al. (2009) Matsumura, S., Pudritz, R. E., & Thommes, E. W. 2009, ApJ, 691, 1764
- Okuzumi (2009) Okuzumi, S. 2009, ApJ, 698, 1122
- Pesenti et al. (2004) Pesenti, N., Dougados, C., Cabrit, S., et al. 2004, A&A, 416, L9
- Pringle (1981) Pringle, J. E. 1981, ARA&A, 19, 137
- Prisinzano et al. (2008) Prisinzano, L., Micela, G., Flaccomio, E., et al. 2008, ApJ, 677, 401
- Rothstein & Lovelace (2008) Rothstein, D. M. & Lovelace, R. V. E. 2008, ApJ, 677, 1221
- Salmeron & Wardle (2008) Salmeron, R. & Wardle, M. 2008, MNRAS, 388, 1223
- Sano et al. (2000) Sano, T., Miyama, S. M., Umebayashi, T., & Nakano, T. 2000, ApJ, 543, 486
- Semenov et al. (2004) Semenov, D., Wiebe, D., & Henning, T. 2004, A&A, 417, 93
- Shakura & Sunyaev (1973) Shakura, N. I. & Sunyaev, R. A. 1973, A&A, 24, 337
- Shu et al. (2000) Shu, F. H., Najita, J. R., Shang, H., & Li, Z.-Y. 2000, Protostars and Planets IV, 789
- Turner et al. (2010) Turner, N. J., Carballido, A., & Sano, T. 2010, ApJ, 708, 188
- Varnière & Tagger (2006) Varnière, P. & Tagger, M. 2006, A&A, 446, L13
- Vlahakis et al. (2000) Vlahakis, N., Tsinganos, K., Sauty, C., & Trussoni, E. 2000, MNRAS, 318, 417
- Wardle (2007) Wardle, M. 2007, Ap&SS, 311, 35
- Wolk et al. (2005) Wolk, S. J., Harnden, Jr., F. R., Flaccomio, E., et al. 2005, ApJS, 160, 423