Galactic Spiral Shocks with Thermal Instability in Vertically Stratified Galactic Disks
Abstract
Galactic spiral shocks are dominant morphological features and believed to be responsible for substructure formation within spiral arms in disk galaxies. They can also contribute a substantial amount of kinetic energy to the interstellar gas by tapping the (differential) rotational motion. We use numerical hydrodynamic simulations to investigate dynamics and structure of spiral shocks with thermal instability in vertically stratified galactic disks, focusing on environmental conditions (of heating and the galactic potential) similar to the Solar neighborhood. We initially consider an isothermal disk in vertical hydrostatic equilibrium and let it evolve subject to interstellar cooling and heating as well as a stellar spiral potential. Due to thermal instability, a disk with surface density rapidly turns to a thin dense slab near the midplane sandwiched between layers of rarefied gas. The imposed spiral potential leads to a vertically curved shock that exhibits strong flapping motions in the plane perpendicular to the arm. The overall flow structure at saturation is comprised of arm, postshock expansion zone, and interarm regions that occupy typically 10%, 20%, and 70% of the arm-to-arm distance, in which the gas resides for 15%, 30%, and 55% of the arm-to-arm crossing time, respectively. The flows are characterized by transitions from rarefied to dense phases at the shock and from dense to rarefied phases in the postshock expansion zone, although gas with too-large postshock-density does not undergo this return phase transition, instead forming dense condensations. If self-gravity is omitted, the shock flapping drives random motions in the gas, but only up to in the in-plane direction and less than in the vertical direction. Time-averaged shock profiles show that the spiral arms in stratified disks are broader and less dense compared to those in unstratified models, and that the vertical density distribution is overall consistent with local effective hydrostatic equilibrium. Inclusion of self-gravity increases the dense gas fraction by a factor and raises the in-plane velocity dispersion to . When the disks are massive enough, with , self-gravity promotes formation of bound clouds that repeatedly collide with each other in the arm and break up in the postshock expansion zone.
Subject headings:
galaxies: ISM — instabilities — ISM: kinematics and dynamics — methods: numerical — stars: formation1. Introduction
Spiral arms in disk galaxies are regions of ongoing active star formation, sharply outlined by bright young star complexes. They usually span the entire optical disks and sometimes extend even to outer gaseous disks (e.g., Dickey et al. 1990; Boomsma et al. 2008; Bertin & Amorisco 2009 and references therein). Such large-scale spiral patterns may be the manifestation of spiral density waves which propagate with a constant pattern speed through stellar disks (Lin & Shu, 1964, 1966), or may be transient features driven, for example, by tidal interactions with companion galaxies (e.g., Toomre & Toomre 1972; Hernquist 1990; Salo & Laurikainen 2000; Oh et al. 2008; Dobbs et al. 2010). Regardless of the origin of spiral features, it is widely accepted that the interstellar medium (ISM) is strongly compressed when it encounters stellar arms, forming narrow dust lanes in optical images (e.g., Elmegreen et al. 2006; Shetty et al. 2007). The densest parts of the shocked layers subsequently undergo gravitational collapse and produce downstream secondary structures, such as OB star complexes and giant H II regions (e.g., Baade 1963; Elmegreen & Elmegreen 1983), filamentary gaseous spurs (also referred to as “feathers;” e.g., Scoville et al. 2001; Kennicutt 2004; Willner et al. 2004; La Vigne et al. 2006; Gordon 2007; Corder et al. 2008), and giant molecular associations or atomic superclouds (e.g., Elmegreen & Elmegreen 1983; Vogel, Kulkarni, & Scoville 1988; Rand & Kulkarni 1990; Koda et al. 2009).
Since shock compression within the arms is the first step towards star formation in grand-design spiral galaxies, understanding structural and dynamical evolution of these gas flows is essential to a host of fundamental problems, such as global star formation rates, the nature of the Hubble sequence, galaxy evolution, etc. Since the pioneering work of Roberts (1969) who obtained one-dimensional stationary shock profiles, there have been numerous studies of the structure of galactic spiral shocks under the simplifying assumption that the gas remains isothermal (e.g., Woodward 1975, 1976; Lubow et al. 1986; Martos & Cox 1998; Kim & Ostriker 2002; Gómez & Cox 2002, 2004; Wada & Koda 2004; Boley & Durisen 2006; Kim & Ostriker 2006; Dobbs & Bonnell 2006). In particular, Woodward (1975) and Kim & Ostriker (2002) showed that the one-dimensional shock profiles found by Roberts (1969) represent stable equilibria when the fluid quantities are allowed to vary only in the direction perpendicular to the arms. The growth of axisymmetric self-gravitating modes is limited by postshock expansion (Lubow et al., 1986).
When the direction parallel to the arm is included in models, on the other hand, isothermal spiral shocks in two dimensions are prone to various kinds of instabilities. Balbus (1988) showed that when self-gravity is included, spiral arms are unstable to transient swing instability. When magnetic fields are included, spiral arms are subject to magneto-Jeans instability, in which embedded parallel magnetic fields that exchange angular momentum limit the stabilizing effect of galaxy rotation, encouraging non-axisymmetric perturbations to grow into giant clouds and other arm substructures (Elmegreen, 1994; Kim & Ostriker, 2002, 2006; Shetty & Ostriker, 2006). Wada & Koda (2004) showed that spiral shocks in two-dimensional thin disk models are unstable to a vorticity-generating wiggle instability and develop arm substructures (see also Dobbs & Bonnell 2006), although these in-plane modes appear to be suppressed by embedded magnetic fields (Shetty & Ostriker, 2006; Dobbs & Price, 2008) or by vertical shear and mixing when all three dimensions are included in models (Kim & Ostriker, 2006).
While steady in-plane shock solutions are subject to instability, shock models that include the vertical degree of freedom do not even have steady solutions. Instead, the shock front in vertically stratified disks moves back and forth relative to the mean position (Kim & Ostriker, 2006). These shock “flapping” motions arise mainly because the vertical oscillation period of the gas is, in general, incommensurate with the arm-to-arm crossing time, so that the gas streamlines are not closed. Kim, Kim, & Ostriker (2006, hereafter Paper I) showed that the shock flapping is able to feed random gas motions on the scale of disk scale height that persist despite dissipation. The induced gas velocity dispersions reach a sonic level, suggesting that spiral shocks may be a considerable source of the ISM turbulence. Motions driven by shock flapping motions destroy any coherent vortical structures that would otherwise grow near the spiral shocks, suppressing the wiggle instability. Since gravity is a long-range force and insensitive to small scale density structure, however, magneto-Jeans instabilities still grow within the arms in three-dimensional disk models, in spite of non-steady motions induced by shock flapping (Kim & Ostriker, 2006).
Phase transitions caused by thermal instability (TI) create a multiphase ISM, with important consequences for galactic star formation. In the classical picture of the ISM, TI changes an otherwise uniform ISM into warm rarefied material and cold dense clouds in a rough pressure balance (e.g., Field 1965; Field et al. 1969; Meerson 1996; Heiles 2001; Wolfire et al. 2003), while there also exists significant mass in the thermally-unstable temperature range (e.g., Heiles & Troland 2003). Supernova blast waves create an additional, hot component that is organized into bubbles or cavities (Cox & Smith, 1974; McKee & Ostriker, 1977), although the total mass contained in the hot phase is much smaller than that in the cold and warm phases (e.g., Cox 2005). Cold atomic clouds transform to molecular clouds if their volume density (to produce molecules fast enough) and column density (to self-shield molecules against photodissociation) are sufficiently high (e.g., Elmegreen 1993; Draine & Bertoldi 1996), as in, for instance, shocks in turbulent flows (Glover & Mac Low, 2007; Glover et al., 2010). That the star-forming molecular clouds strongly correlate with spiral arms (e.g., Stark 1979; Solomon et al. 1985; Kenney 1997; Zimmer et al. 2004; Shetty et al. 2007) suggests that spiral shocks too should trigger phase transitions from warm and diffuse to cold and dense conditions.
Effects of TI on spiral shocks were first studied by Shu et al. (1973), who calculated one-dimensional shock profiles consisting of two stable phases in equilibrium. Although they allowed for phase transitions, they assumed instantaneous thermal equilibrium, which precluded the existence of transitory thermally-unstable gas in their calculations. Using direct time-dependent numerical simulations including ISM heating and cooling, Tubbs (1980) and Marochnik et al. (1983) found that spiral shocks trigger phase transitions if the initial density is large enough. Because of strong numerical diffusion associated with insufficient resolution, however, they were unable to capture TI in the postshock transition zone, which is the thermally unstable regime.
In Kim, Kim, & Ostriker (2008, hereafter Paper II), we used high-resolution one-dimensional simulations to study dynamical and thermodynamical evolution of gas flows across spiral arms with ISM heating, cooling, and thermal conduction. We found that even with TI, a quasi-steady state develops with the following recurring cycle: both warm and cold phases in the interarm region are shocked and immediately transform to denser cold gas in the arm, which subsequently evolves to be TI-unstable due to postshock expansion in a transition zone, and separates back into warm and cold phases. For a model with the initial number density of , the gas stays in the arm, transition, and interarm zones for 14%, 22%, and 64% of the arm-to-arm crossing time, respectively. The gas mass in the TI-unstable temperature range was of the total, and mostly located in the transition zone, suggesting that postshock expanding flows are important for producing intermediate-temperature gas. Paper II also found that TI in association with one-dimensional spiral shocks can drive random gas motions at in the interarm and transition zones; these velocities are times larger than those from pure TI alone (e.g., Kritsuk & Norman 2002; Piontek & Ostriker 2004).
In this paper, we extend the one-dimensional models of Paper II into two dimensions, in order to study the effect of vertical disk stratification on the dynamics and structure of multiphase galactic spiral shocks. The current work also extends the vertically-stratified isothermal models considered in Paper I to include the effects of the ISM heating and cooling. Our key objective is to find how the flapping motions of spiral shocks inherent in stratified disks interact with multi-phase gas produced by TI, to change the shock structure and drive random gas motions in each phase. We also study the internal properties of clouds that form in self-gravitating models. Although Dobbs & Bonnell (2007, 2008) and Dobbs & Price (2008) ran SPH simulations to study shock structure and cloud formation in three dimensions, they used pre-determined cold and warm particles and did not allow the transitions between them. Dobbs et al. (2008) included ISM heating and cooling in the energy equation and thus handled TI self-consistently, focusing on the formation of molecular clouds in spiral shocks. Using grid-based three-dimensional simulations, Wada (2008) studied dynamics of galactic gas flows under the influence of self-gravity, a spiral-arm potential, radiative cooling, star formation, and energy feedback from supernova explosions. Although these three-dimensional global models are of course more realistic, our local models are useful for studying the detailed dynamics of spiral shocks at high spatial resolution, and allow us to isolate each effect of the physical processes involved.
This paper is organized as follows. In §2, we describe the basic equations we solve and specify the model parameters. In §3, we present the results of one-dimensional solutions for vertical disk equilibria including heating and cooling, also providing simple analytic expressions for the mass fractions and scale heights. In §4, we present the overall evolution, structure, and statistical properties of spiral shock flows with TI in stratified disks, based on the results of two-dimensional simulations. The effect of self-gravity is discussed in §5. In §6, we summarize our results and discuss their implications.
2. Numerical Methods
The local formulation used in the present study is similar to that in Papers I and II. In this section, we explain our numerical method and model parameters.
2.1. Basic Equations
We consider a local region centered on a spiral arm that is assumed to be tightly wound with a pitch angle and rotating at a constant pattern speed . We set up a local Cartesian frame, centered at the position , that corotates with the spiral arm. The – and –axes of the local frame are aligned in the midplane parallel and perpendicular to the local arm segment, while –axis points the direction perpendicular to the galactic plane (Roberts 1969; Paper I). Our simulation domain is a two-dimensional rectangular region with size in the – plane (hereafter XZ plane). We assume that all physical variables are independent of (quasi-axisymmetric), while allowing nonzero velocity in the -direction in order to handle epicycle motions associated with galactic rotation self-consistently.
In this local frame, the galactic differential rotation is translated into the background velocity as
| (1) |
where and denotes the local shear rate in the absence of the spiral potential (Kim & Ostriker, 2002, 2006). Under the local approximation (i.e., and ), the equations of hydrodynamics expanded in the local frame are
| (2) |
| (3) |
| (4) |
| (5) |
(e.g., Roberts, 1969; Shu et al., 1973; Kim & Ostriker, 2006), where is the total velocity in the local frame, is the self-gravitational potential of the gas, is the external stellar potential, and is the net cooling function. Other symbols have their usual meanings. We adopt an ideal gas law with .
The external stellar potential varies in both the – and –directions and is separable into two parts as
| (6) |
where is the unperturbed midplane stellar density, is the amplitude of the spiral potential, and is the arm-to-arm separation for an -armed spiral. The first term in equation (6) adopts a constant density for the stellar disk vertically; this is a reasonable assumption given that most of the gas is located within one stellar scale height of the midplane. The second term is a local analog of a logarithmic spiral potential considered in Roberts (1969) and Shu et al. (1973). To parametrize the spiral arm strength, we employ the dimensionless parameter
| (7) |
corresponding to the ratio of the maximum force due to the spiral potential to the the mean radial gravitational force (Roberts, 1969).
The interstellar gas is subject to the net cooling , where is the gas number density with being the mean molecular weight per particle. For the cooling rate of the diffuse ISM, we take the fitting formula suggested by Koyama & Inutsuka (2002),
| (8) | |||||
with temperature in degrees Kelvin.
For the gas heating function, we consider two different cases: (1) a constant heating rate and (2) a density-dependent heating rate
| (9) |
with . The first, uniform heating rate corresponds to the mean heating rate due to the photoelectric effect on small grains and PAHs, photodissociations of hydrogen molecules, and ionizations by cosmic rays and X-rays (e.g., Koyama & Inutsuka 2002). The second, density-modified heating rate that increases stiffly with is to treat the effect of star formation feedback in a very simple way. Without such a feedback, high-density clouds produced inside spiral arms in our self-gravitating models would undergo catastrophic collapse, preventing further computation. In the real ISM, gravitational collapse leads to new-born stars which will in turn disperse the parent clouds by injecting radiative and mechanical energies. Investigating the details of star formation and consequent feedback processes is a very active current research area. Most previous work has adopted simplified feedback prescriptions that depend on gas-consumption rate, star-formation efficiency, type of energy injection, etc., with considerable uncertainties in the parameters (e.g., Springel et al. 2005; Joung & Mac Low 2006; Shetty & Ostriker 2008; Koyama & Ostriker 2009a). More realistic feedback prescriptions will be considered in a subsequent paper.

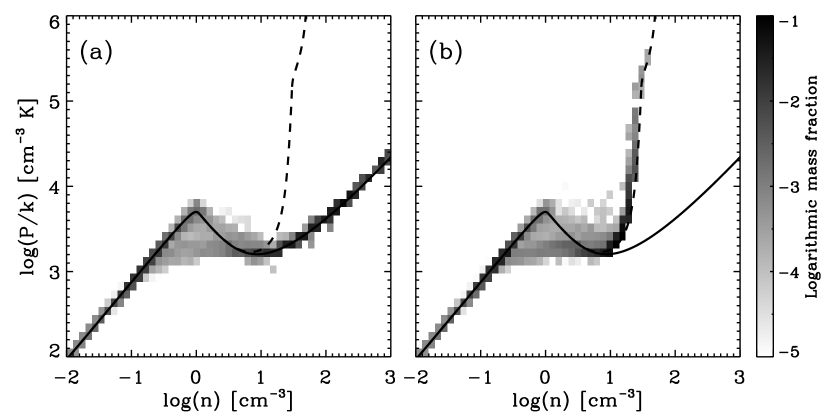
Figure 1 plots the equilibrium cooling curves in the density vs. pressure plane. The solid line corresponds to the uniform heating rate, while the dashed curve is for the modified heating rate. The dotted lines indicate isotherms. The modified heating rate changes the equilibrium curve dramatically only for high-density gas, while making a negligible difference for low-density material. The equilibrium pressure has a local maximum at for both heating rates, while attaining a local minimum at with for the constant heating rate, and at with for the modified heating rate. Under the constant heating rate, the gas temperature along the equilibrium curve is a monotonically decreasing function of density, although it is insensitive to at the low-density end with . This is not the case under the density-modified heating rate where the equilibrium temperature increases with density when in order to model feedback. We thus classify the gas into two components based on its density rather than temperature: rarefied component if and dense component if . Note that thermally-unstable gas with belongs to the dense phase according to our classification.
As equation (4) indicates, we explicitly ignore the effect of thermal conduction in the present work. Paper I found that large translational motions in a finite difference scheme give rise to numerical diffusion that tends to suppress the growth of TI, similarly to thermal conduction. The amount of numerical conductivity in our models is typically for the background velocity , grid spacing , and the perturbation wavelength . Inclusion of physical conductivity larger than would resolve the wavelengths of the most unstable TI. But, this would in turn reduce the timestep greatly, making computation essentially unpractical.111We have run some simulations by including density-dependent thermal conductivity (Koyama & Ostriker, 2009a), and confirmed that this level of thermal conduction does not make a significant difference in the results. We note that by neglecting the thermal conduction term in the energy equation, some of our results may depend on the numerical resolution, although the mass fractions appear to be insensitive to the resolution (Paper I).
2.2. Model Parameters & Numerical Methods
| ModelaaThe prefixes NU refers to the non-self-gravitating models with the uniform heating rate, NM for the non-self-gravitating models with the modified heating rate, and SM for the self-gravitating models with the modified heating rate. | ||||||
|---|---|---|---|---|---|---|
| (1) | (2) | (3) | (4) | (5) | (6) | (7) |
| NU.S02 | 2 | 0 | 100 | 0 | 126 | 126 |
| NU.S05 | 5 | 0 | 100 | 0 | 119 | 119 |
| NU.S10 | 10 | 71 | 29 | 2 | 125 | 67 |
| NU.S20 | 20 | 86 | 14 | 4 | 127 | 48 |
| NM.S02 | 2 | 0 | 100 | 0 | 126 | 126 |
| NM.S05 | 5 | 0 | 100 | 0 | 119 | 119 |
| NM.S10 | 10 | 69 | 31 | 4 | 125 | 70 |
| NM.S20 | 20 | 85 | 15 | 9 | 130 | 50 |
| SM.S02 | 2 | 0 | 100 | 0 | 121 | 121 |
| SM.S05 | 5 | 0 | 100 | 0 | 107 | 107 |
| SM.S10 | 10 | 82 | 18 | 4 | 100 | 43 |
| SM.S20 | 20 | 94 | 6 | 7 | 84 | 21 |
| Model | ||||||
|---|---|---|---|---|---|---|
| (1) | (2) | (3) | (4) | (5) | (6) | (7) |
| NU.S02 | 2 | 11 | 89 | 25 | 129 | 122 |
| NU.S05 | 5 | 62 | 38 | 10 | 130 | 81 |
| NU.S10 | 10 | 81 | 19 | 7 | 130 | 57 |
| NM.S02 | 2 | 12 | 88 | 28 | 130 | 122 |
| NM.S05 | 5 | 60 | 40 | 20 | 132 | 84 |
| NM.S10 | 10 | 81 | 19 | 25 | 135 | 64 |
| SM.S02 | 2 | 26 | 74 | 14 | 124 | 107 |
| SM.S05 | 5 | 91 | 9 | 21 | 121 | 42 |
| SM.S10 | 10 | 95 | 5 | 43 | 123 | 51 |
Note. — Model name prefixes are as in Table 1.
We consider a simulation box located near the Solar neighborhood at galactocentric radius of . We adopt the galactic rotational velocity of with a flat rotation curve (). The corresponding angular velocity is , and orbital period is , which we use as the time unit in our presentation. For spiral arm parameters, we take pattern speed , pitch angle , and azimuthal wavenumber . The corresponding arm-to-arm separation is , which is set equal to the size of the simulation box along the –direction. We fix the spiral arm strength to .
Our initial gaseous disks, in the absence of the spiral-arm perturbations, are taken to be isothermal and in vertical hydrostatic equilibrium under the linear stellar gravity (see eq. [6]). The corresponding density distribution is a Gaussian profile
| (10) |
with a scale height
| (11) | |||||
where is the isothermal sound speed of the initial disks and is the stellar density near the solar neighborhood (Holmberg & Flynn, 2000). We take as the vertical size of the simulation domain (i.e., ).
Tables 1 and 2 summarize the model parameters and some simulation outcomes for models with and without spiral potential perturbations, respectively. Column (1) labels each run. The prefixes NU and NM stand for non-self-gravitating models (“N”) with the uniform heating rate (“U”) and the modified heating rate (“M”), respectively, while the prefix SM indicates self-gravitating models (“S”) with the modified heating rate (“M”). As will be discussed below, column (2) gives the initial gas surface density . Columns (3) and (4) give the mass fractions, (with or ), of dense and rarefied components, respectively. Here, the angle brackets denote a time average over for non-self-gravitating models and over for self-gravitating models. Columns (5) and (6) give the scale heights, , of the dense and rarefied components, respectively. Column (7) gives the average scale height of the whole gas .
We integrate the time-dependent partial differential equations (2)–(5) using a modified version of the Athena code (Gardiner & Stone, 2005, 2008; Stone et al., 2008; Stone & Gardiner, 2009). Athena employs a single-step, directionally unsplit Godunov scheme for magnetohydrodynamics in multispatial dimensions. Among the various schemes contained in Athena, we take a piecewise linear method for spatial reconstruction, HLLE Riemann solver to compute the fluxes (Harten et al., 1983; Einfeldt et al., 1991), and van Leer algorithm for directionally unsplit integration (Stone & Gardiner, 2009). Since our simulations involve strong shocks for the dense medium (with typical Mach numbers ), we adopt the first order flux correction when the net mass flux out of a cell exceeds the initial mass of the cell in order to avoid an occurrence of negative density (see, e.g., Lemaster & Stone 2009). Our models employ a zones over the simulation box, corresponding to the resolution of and .
We adopt the shearing-periodic boundary condition at the –boundaries (Hawley et al., 1995). In the –direction, we use the outflow condition for the velocity and the vacuum condition for the gravitational potential (e.g., Koyama & Ostriker 2009a). For the density and pressure at the –boundaries, we linearly extrapolate the logarithmic density, while keeping temperature fixed, whenever . This produces a balance between the vertical pressure gradient and the gravitational source term at the boundaries, similarly to the “conducting” boundary in Parrish & Stone (2005). When , on the other hand, we switch to the continuous boundary condition for the density and pressure to reduce artificial mass inflow due to the extrapolation. Under our boundary conditions, the gas can freely escape from the vertical boundary; we have checked that the total mass is nonetheless conserved within for all models. Because of the very short cooling time, energy updates from the net cooling functions are made implicitly based on Newton-Raphson iterations (Piontek & Ostriker, 2004). To solve for the gravitational potential in our simulation domain, we adopt a method introduced by Koyama & Ostriker (2009a) which, by using the fast Fourier transform technique, is much more efficient than a hybrid method involving Green’s functions (e.g., Kim et al. 2002)
3. Vertical Equilibria Without Spiral Arms
While our main objective is to investigate the overall dynamics and structure of spiral shocks in vertically stratified disks under the influence of TI, in this section we focus on the quasi-static vertical equilibria with heating and cooling in the absence of the spiral arm potential (i.e., ). This allows us to study the effect of TI on vertical disk structure. We run one-dimensional simulations with physical quantities varying only with . We consider an initially-isothermal disk with 5, 10, or , and evolve it subject to TI.

For disks with large surface density (models with ), TI grows rapidly (), transforming the initially constant-temperature gas into thermally bistable phases. The cold, dense gas falls toward the midplane to form a dense slab, while the warm, rarefied gas rises up buoyantly. The infall is supersonic relative to the dense medium. At early time, the dense slab surrounded by the upper rarefied gas undergoes vertical expansions and contractions a few times. As the kinetic energy dissipates through shocks at the interfaces, the whole configuration evolves toward vertical hydrostatic equilibrium typically within . Figure 2 shows density profiles for S10 models with . Solid and dotted lines are for non-self-gravitating NU and NM models, respectively, while the dashed line is for the self-gravitating SM models. The difference between models NU.S10 and NM.S10 is not significant since the maximum midplane density is not much larger than , below which the heating rate is almost density-independent. For model SM.S10, self-gravity compresses the midplane slab further at the expense of the rarefied medium at . Nevertheless, the phase transition between dense and rarefied components turns out to occur at almost the same density , corresponding to the transition pressure for all models that are unstable to TI. Note that is above the minimum pressure for a cold medium with our adopted cooling and heating functions, .

Once vertical hydrostatic equilibrium is attained, we measure the mass fractions and , and the scale heights and of the dense and rarefied components, respectively; these values are listed in Table 1. Figure 3 plots and as functions of the initial surface density . The results of NU and NM models are denoted by asterisks and diamonds, respectively, while open squares are for SM models. Models with low surface density () do not experience TI and thus establish a single-phase equilibrium consisting only of the rarefied medium. Since the warm gas is nearly isothermal at and self-gravity is weak in these models, the equilibrium density profiles in low models are approximately given by equation (10), with surface density . Since the midplane pressure of the rarefied gas cannot exceed along the thermal equilibrium curve shown in Figure 1, the surface density for a single-phase equilibrium with only a rarefied component is constrained to be less than . Similarly, the condition yields as the minimum surface density for a two-phase equilibrium in which dense and rarefied components coexist. The two vertical dot-dashed lines in Figure 3 mark and . Below , only a rarefied phase is possible, whereas above , both dense and rarefied phases must be present.
For , both single (rarefied) phase and two-phase equilibria can be realized. Which type of equilibrium emerges depends of course on the initial disk conditions. In the case of our models with , the initial midplane density and pressure are and , smaller than than and . Since cooling and heating occur almost isobarically, even the densest gas in these models is unable to overcome to turn into the dense component, for this case.
Figure 3 also shows that for the models that reach a two-phase equilibrium, self-gravity reduces the rarefied-gas fraction in mass as well as its scale height compared to those in non-self-gravitating counterparts. Self-gravity also makes the density profile of the rarefied component deviate significantly from a Gaussian profile. A thin midplane dense slab, containing the majority of the gas mass, exerts a uniform gravity on the rarefied gas lying above it, providing an additional confining force. In the Appendix, we describe a simple way to estimate and as functions of the total gas density, assuming that the rarefied component can be characterized by a fixed sound speed and that its self-gravity is negligible. The resulting theoretical predictions, with , for self-gravitating and non-self-gravitating cases are plotted in Figure 3 as dashed and solid curves, respectively, These are overall in good agreement with the numerical results. Small discrepancies between the theoretical and numerical values of for disks with arise from the fact that the rarefied gas in these models has larger midplane pressure than in any other models.222 For example, the midplane pressure of the rarefied component is and for models NM.S05 and NM.S10, respectively. In view of the thermal equilibrium curve shown in Figure 1, this implies that the rarefied medium in S05 models is coldest, corresponding to , making the scale height smaller than the theoretical estimate based on .
4. Non-self-gravitating Models
Now we turn to our main theme, nonlinear gas flows with TI across spiral arms in a stratified disk. In this section, we study overall evolution, structure, and statistical properties such as density and random velocity distributions of spiral shocks for non-self-gravitating models. Effects of self-gravity will be discussed in the next section.
4.1. Overall Evolution
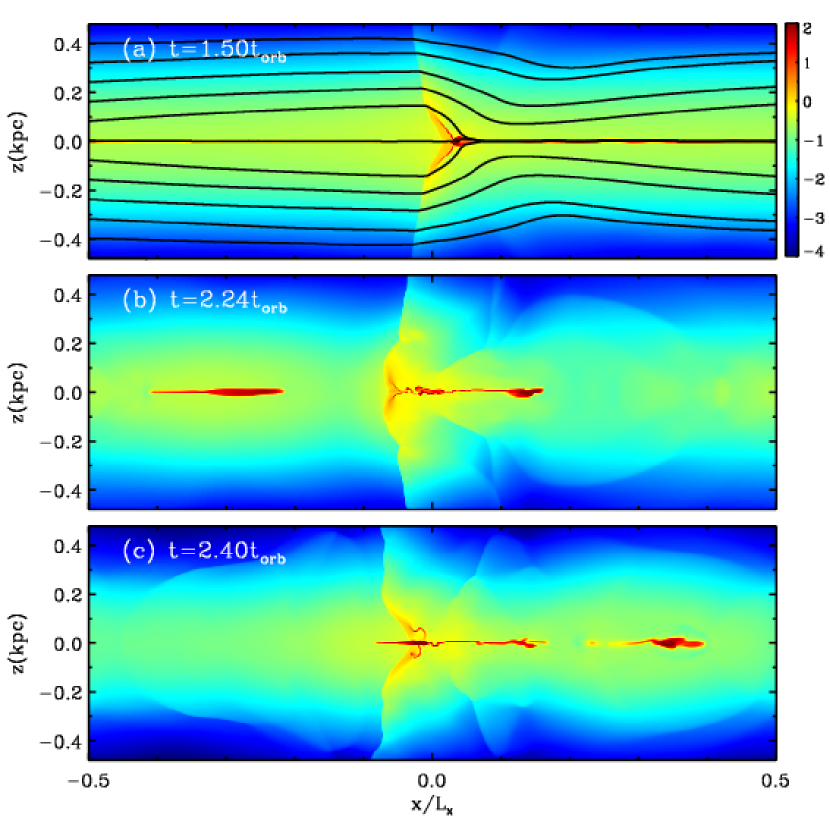
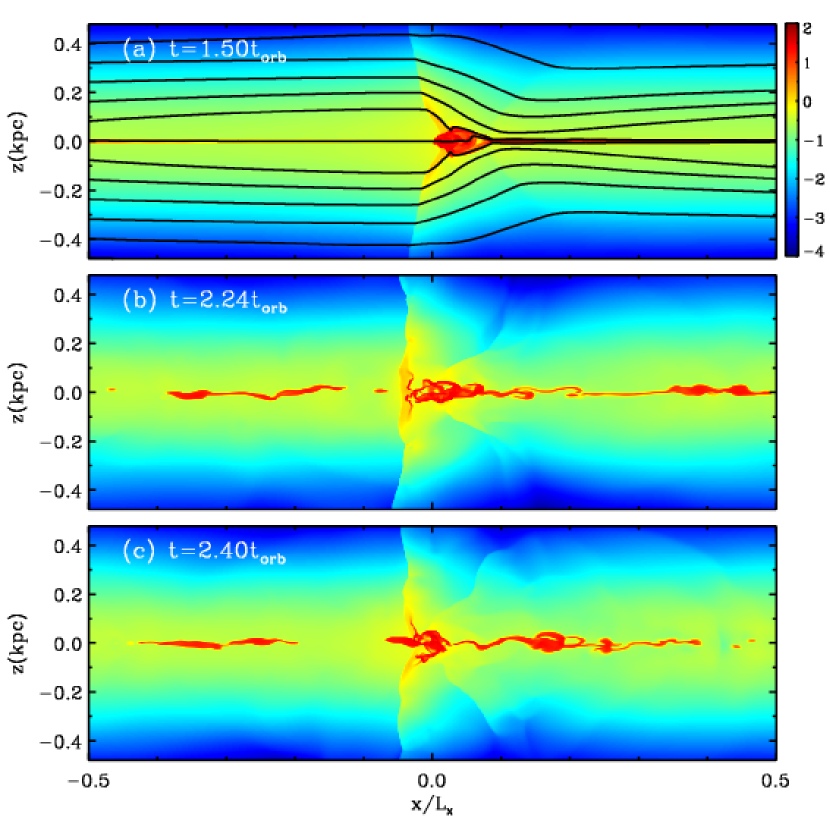
We begin by describing evolution of our fiducial models NU.S10 and NM.S10 with that employ the uniform and density-modified heating rates, respectively. We slowly turn on the spiral potential amplitude such that it attains full strength at . Snapshots of volume density in logarithmic color scale at early epochs , , and are shown in Figures 4 and 5, respectively. Figure 6 plots the gas distribution in the - plane for both models at . Initially, the disk is in hydrostatic equilibrium with a constant sound speed of . Since the initial disk is out of thermal equilibrium, it quickly evolves into a two-phase equilibrium configuration, as explained in §3. As increases, both the dense gas near the midplane and the rarefied gas at high respond to the growing spiral potential and form a shock front near the potential minimum.
Since the gas flows at this time are fairly horizontal without much vertical mixing, as evidenced by the instantaneous streamlines shown in Figures 4a and 5a, the shock profile at each height is very similar to those of the one-dimensional cases studied in Paper II. The shock strength and gas phase in the postshock regions depend on the mean density and temperature at that height. Near the midplane at ( and for models NU.S10 and NM.S10, respectively), the dense slab is so cold that the shock is very strong with a typical Mach number , resulting in a far denser postshock region. In the high- regions (), on the other hand, the gas is warm and has a low mean density () enough to remain warm even after the shock compression. It is the mid-altitude rarefied medium (at ) that is able to achieve a postshock pressure larger than and thus undergoes a phase transition to the dense component after experiencing isobaric cooling (Mufson 1974; Inoue & Inutsuka 2008; Paper II). Since the shock is stronger at lower in a stratified disk and since a stronger shock tends to move downstream (e.g., Kim & Ostriker, 2002), the shock front when it first develops is naturally curved in the XZ plane. Figures 4a and 5a show that the shock front is concave when seen from the upstream direction, with mean slopes of at and at , where is the shock location at .
The dense gas produced at the shock at moderate begins falling toward the midplane under the influence of the external gravity as it moves downstream. The reduction of the velocity in the direction normal to the concave shock front also helps the downward motion of the gas. On the other hand, the dense gas near the midplane has a large pressure and thus slightly expands vertically after the shock. The vertical expansion is more extreme in NM models than in NU models. The falling gas collides with the expanding gas, reducing the rising motion of the latter. The streamlines shown in Figures 4a and 5a illustrate these motions at early time.
The rarefied gas which crosses the shock at high also falls toward the midplane as it follows galaxy rotation. This builds up thermal pressure at low , so the flow rebounds to high-altitude regions. Since the period of vertical oscillation, , is in general not commensurate with the interval between arm crossings, the streamlines of the rarefied gas are not closed. This causes the shock front to sway back and forth around its mean position in the direction perpendicular to the arm (e.g., Kim & Ostriker 2006; Paper I). During the course of the flapping motions, the shock front has a convex shape (seen from upstream) when the postshock regions are maximally compressed (Fig. 4b), while it becomes concave when the gas in the postshock regions is in full vertical expansion (Fig. 4c). These flapping motions of the shock front, alternating between convex and concave shapes, occur quasi-periodically with a period of and have an amplitude of at ( in model NU.S10). The shock flapping motions are able to tap some of the kinetic energy in galaxy rotation to supply random kinetic energy for the gas. We will quantify the amplitudes of random gas motions driven by flapping in §4.3.
One of the special features of galactic spiral shocks is that gas experiences acceleration after the maximum shock compression, forming a postshock expansion zone (e.g., Balbus 1988; Kim & Ostriker 2006; Papers I & II). Any parcel of gas becomes gradually less dense as it moves downstream in the expansion zone. In model NU.S10, the shock compression and subsequent cooling is so strong that the shocked dense gas in the midplane can reach (see also model SC20 in Paper II). With such a large postshock density, this gas can still remain dense, with , even after emerging from the expansion zone located at . This TI-stable dense gas travels almost ballistically in the interarm region, reenters the arm, and combines with other dense gas to produce a few condensations. Figures 4b at time shows three large condensations located at , , and , which are stretched horizontally due to the expanding background velocity. The condensations move nearly horizontally to appear at , 0.14, and 0.35 when (Fig. 4c). In model NU.S10, the dense condensations stay in the arm () for about , in the expansion zone () for about , and in the interarm region for the remainder () of the cycle. The width and residence time of each zone are insensitive to the model parameters.
With the density-modified heating rate, on the other hand, the postshock dense gas in model NM.S10 has a moderate density (), so that the postshock expansion is able to take it to the thermally unstable regime (). Subsequently, the expanding dense gas suffers from TI and separates back into dense and rarefied gas in the interarm region. The large thermal pressure also prevents the formation of dense condensations in this model.

Figure 7 plots the temporal evolution of the mass fractions of dense phase (solid lines) and rarefied phase (dashed lines), respectively, for models NU.S10 (thick lines) and NM.S10 (thin lines). At early time, increases rapidly as the gas cools and collapses toward the midplane to form a dense layer that bounces appreciably at . The mass fractions flatten at when vertical hydrostatic equilibrium is established, well before the effect of the spiral potential becomes substantial. As the spiral potential attains its full strength at , increases slightly due to the phase transition of the rarefied to dense phases occurring at the shock fronts. Although the flows are fully nonlinear with strong unsteady motions and phase transitions, there is no noticeable secular variation in the mass fractions, which remains at after ; the associated temporal fluctuation amplitudes are about relative to the mean values. We thus conclude that in a statistical sense, the spiral shocks in our models have reached a quasi-steady state at . Compared with models without spiral arms discussed in §3, the shock compression and associated phase transitions decrease the rarefied gas fraction by for S10 models. In fact, all of the non-self-gravitating models with spiral arms have comparable total surface density of rarefied gas, , lower than the value that would be predicted using a uniform surface density. Note that both NU and NM models have almost the same dense and rarefied mass fractions since the modified heating rate does not affect the rarefied medium much.
The evolution of S02 and S05 models is qualitatively similar to that of S10 models in that phase transitions occur at the shock and in the postshock expansion zone, although the former with low postshock density do not produce much dense gas even under the uniform heating rate. When the spiral potential is absent, the equilibrium disks of these models consist entirely of the rarefied gas with the midplane pressure for S05 models and for S02 models. But, the shock compression increases the pressure by about a factor of 3, corresponding to a typical Mach number for the rarefied medium,333 For adiabatic shocks, the pressure jump condition is , where the subscripts and denote preshock and postshock values, respectively, and is the density shock jump factor. making the midplane postshock pressure larger than . As a result, the dense medium in S05 models comprises about 60% of the total mass, undergoing TI in the postshock expansion zone. In S02 models, the postshock pressure barely exceeds , so that the shocked dense gas, comprising about 10% of the total, easily disperses to return to the rarefied gas in the interarm region. Flapping motions of spiral shocks are correspondingly weaker in these models, with and for S05 and S02 models, respectively.
4.2. Time-averaged Shock Structure
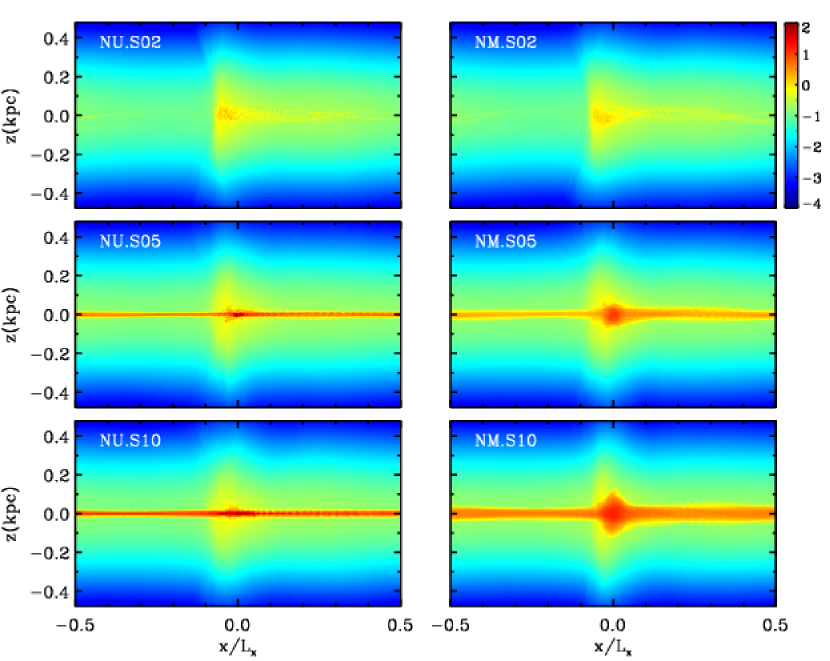
To visualize spiral shock structure in each model, we construct a time-averaged distribution of number density . Here, the angle brackets denote a time average over . Figure 8 displays for all the non-self-gravitating models in logarithmic color scale. It is apparent that S05 and S10 models possess a thin dense layer everywhere near the midplane, while the dense gas is found only inside the arm regions in S02 models. The shock compression factors in the time-averaged density profiles are , which is larger than the adiabatic shock jump due to enhanced radiative cooling in the shocked gas (cf., Mufson, 1974; Inoue & Inutsuka, 2008, Paper II). The shock transition layer in S05 and S10 models is relatively broad because of rather strong flapping motions of the shocks, while S02 models exhibit relatively sharp discontinuities. Compared to NU models, arms in NM models have larger pressure and are more expanded vertically, similar to “hydraulic jumps” that occur when the equation of state is stiffer than isothermal (e.g., Martos & Cox 1998). Table 2 lists the time-averaged values of the mass fractions and scale heights of dense and rarefied components, as well as the overall average scale height.

Figure 9 plots the mass-weighted probability distribution functions (PDFs), averaged over , of gas density and temperature for models NU.S10 and NM.S10. The PDFs are in general bimodal, as is expected for a bistable cooling function. For model NU.S10, the dense and rarefied peaks are centered at and , respectively, mostly distributed near the thermal equilibrium curves. Only a small fraction of the gas is in the thermally-unstable regime. The dense portion of the PDF in model NU.S10 is well fitted by a lognormal distribution (thin solid line) with a standard deviation of , which is one of the characteristics of near-isothermal turbulence (cf., Wada & Norman, 2007; Wada, 2008). With enhanced heating, on the other hand, model NM.S10 shows a sharp density cutoff in the density PDF at and has a dense peak shifted to . Because of the stiff equation of state, the dense gas in model NM.S10 is not as cold as in model NM.S10. This not only thickens the midplane dense slab, but also sets an upper limit on the gas density, which in turn prevents the formation of dense condensations. In model NM.S10, all the postshock dense gas becomes thermally unstable in the expansion zone and separates into dense and rarefied gas in the interarm region.
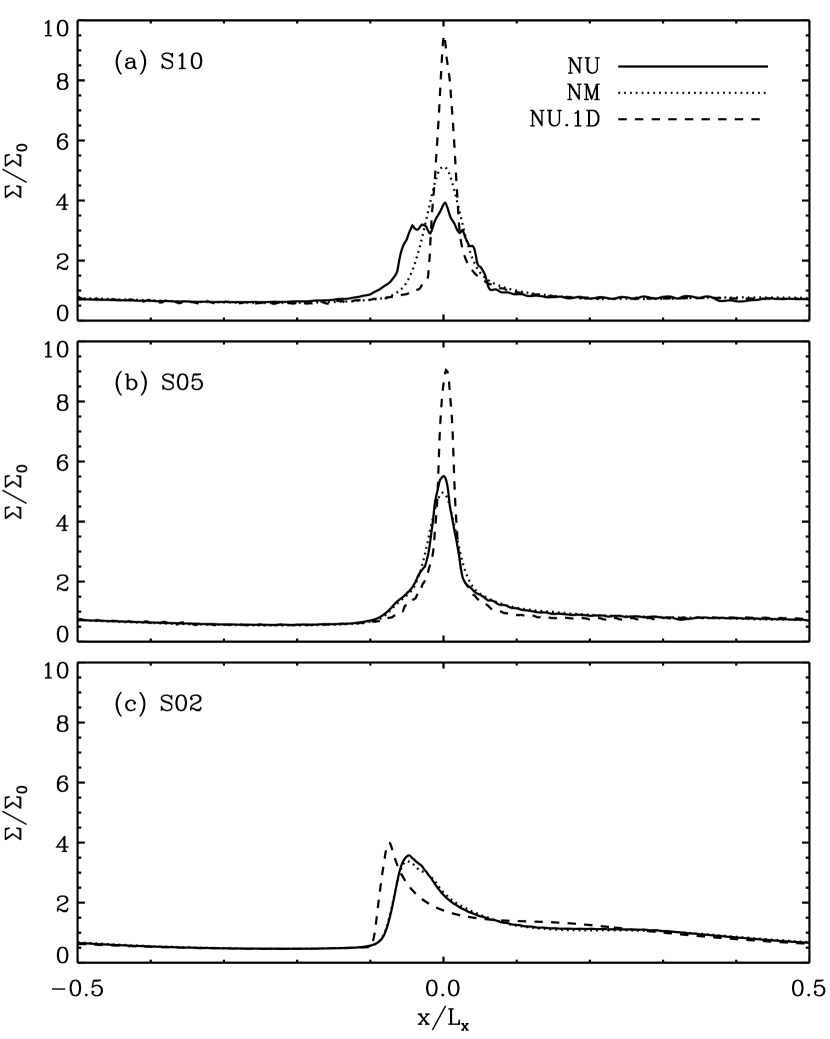
Paper II showed that for one-dimensional models, the density profiles of multiphase spiral shocks are more symmetric and have a wider arms than isothermal counterparts. This is because the strength of spiral shocks in the multiphase models fluctuates depending on whether the incoming gas is warm or cold, resulting in slight oscillations of the shock fronts in the direction perpendicular to the arm. In addition, spiral shocks in the XZ plane undergo flapping motions, which can further widen the arms. To see this, we plot in Figure 10 the time-averaged surface density profiles after taking a boxcar average with window of . The solid and dotted lines are for NU and NM models, respectively. Shown also as dashed lines are the density profiles from one-dimensional simulations (i.e. without vertical stratification) under the uniform heating rate; the initial number density of the one-dimensional counterpart was chosen equal to the density-weighted mean density , with the average disk thickness listed in column (7) of Table 2. For S05 and S10 models for which the shock flapping motions are appreciable, the arms are considerably wider and less centrally peaked than in the one-dimensional models. Due to the flapping motions, dense condensates formed in the NU.S10 model oscillate slightly in the –direction when they pass through the shock, resulting in broader arms than in the NM.S10 model. For S02 models, the one-dimensional shock consists only of the warm rarefied gas, while the two-dimensional shocks contain a small amount () of dense gas due to an additional compression in the -direction; the difference in profiles is therefore slight.
| Dense Component | Rarefied Component | |||||||
|---|---|---|---|---|---|---|---|---|
| Model | ||||||||
| () | (km s-1) | (km s-1) | (km s-1) | (km s-1) | (km s-1) | (km s-1) | ||
| NU.S02 | 2 | |||||||
| NU.S05 | 5 | |||||||
| NU.S10 | 10 | |||||||
| NM.S02 | 2 | |||||||
| NM.S05 | 5 | |||||||
| NM.S10 | 10 | |||||||
| SM.S02 | 2 | |||||||
| SM.S05 | 5 | |||||||
| SM.S10 | 10 | |||||||
Note. — Model name prefixes are as in Table 1.
In studies of galactic disk structure, it has been the customary to assume effective hydrostatic equilibrium in the vertical direction. Using numerical simulations without spiral arms, Koyama & Ostriker (2009b) explicitly demonstrated that turbulent, multiphase disks are in effective hydrostatic equilibrium, provided that the turbulent pressure arising from random gas motions is taken into account. When a spiral potential is present, the gas surface density and velocity dispersions depend upon the distance from the minimum of the spiral potential. It is interesting to study whether “local” effective hydrostatic equilibrium is still established at each .
From the time-averaged density distribution, we measure the density-weighted vertical scale height , sound speed , and vertical velocity dispersion via
| (12) |
In the absence of self-gravity, the “estimated” vertical scale height is given by
| (13) |
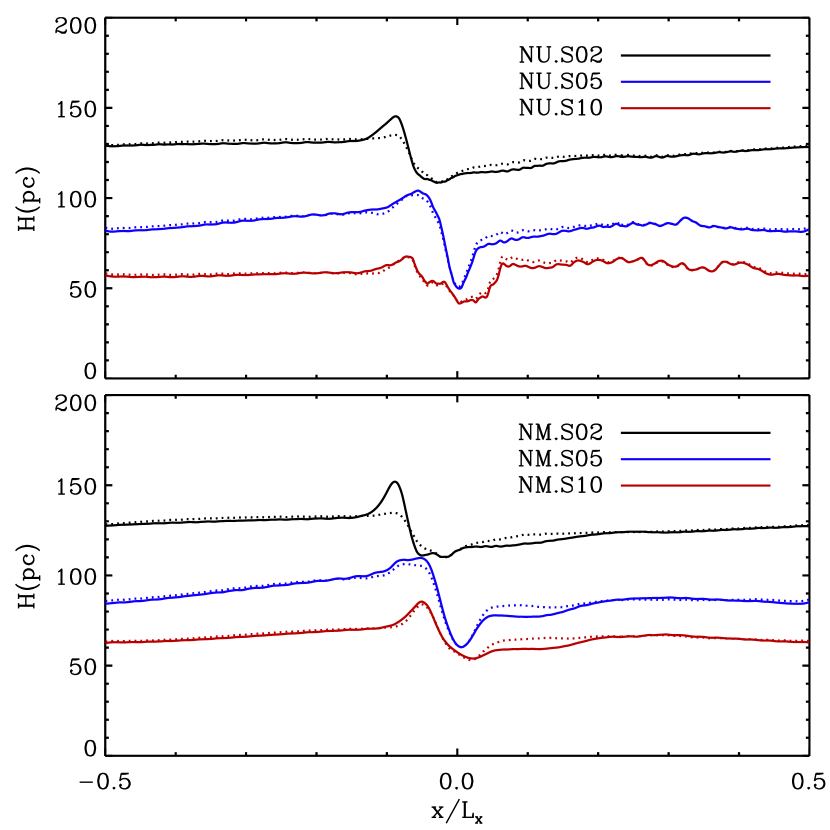
for effective hydrostatic equilibrium (Koyama & Ostriker, 2009b). Figure 11 plots (solid lines) and (dotted lines) for NU and NM models as functions of . The measured vertical scale height is overall in excellent agreement with the estimated value at all horizontal locations. For all models, is about 5-7 times larger than . This implies that the disks with spiral arms, in time-averaged sense, are effectively in vertical hydrostatic equilibrium, with the main support provided by thermal pressure (in these models without stellar feedback). Unsteady motions associated with shock flapping and movements of dense condensations are mostly horizontal, affecting the vertical force balance relatively little. A small mismatch between and near in S02 models arises from the fact that shocks in these models exhibit weak flapping motions and retain sharp discontinuities in the time-averaged configurations. In this case, the term in the momentum equation has a non-negligible contribution to the vertical force balance, which was ignored in the derivation of equation (13).
4.3. Velocity Dispersions
Paper I showed that two-dimensional (isothermal) spiral shocks exhibit strong flapping motions in the XZ plane and are able to generate a sonic level of random gas motions in the arm regions. On the other hand, Paper II showed that in one-dimensional spiral shocks with TI, random gas motions amount to only . In this subsection, we quantify the level of random gas motions driven by shock flapping motions and TI in our two-dimensional models.

The velocity field of gas moving across spiral arms is a combination of several different components including streaming motions, oscillations of the shock fronts themselves, and random motions. Since streaming velocities that are ordered and vary with are much larger than the true random motions of the gas, it is important to subtract the former from the total velocity as cleanly as possible. For this purpose, we first construct time-averaged templates of the velocity field (with , , or ) for the dense and rarefied components separately. We then calculate the density-weighted velocity dispersions using
| (14) |
Figure 12 plots for the dense and rarefied components in models NU.S10 and NM.S10 as solid and dashed curves, respectively, for a time span of . Figure 13 plots the mean values along with their standard deviations for all the non-self-gravitating models; the values of and are listed in Table 3.
Figure 12 shows that the density-weighted velocity dispersions for the dense component exhibit large-amplitude fluctuations, with periods roughly of . The standard deviations of the fluctuations are – for the dense component; deviations are only – for the rarefied phase. These variations of and are caused mostly by oscillations of the shock front relative to the mean position. With large spatial variations of streaming velocities across the arm, the small offset of the shock position as well as the instantaneous locations of dense condensates result in large values of . We thus regard the local minima of , approximately equal to , as the upper limits to the level of random gas motions.

Figure 13 shows that for NU models, and increase with . This is mainly because the shock compression and associated phase transition are stronger with larger , leading to stronger flapping motions. Nevertheless, for both dense and rarefied components, insensitive to . This indicates that the portion of kinetic energy in the shock flapping motions that goes into random gas motions is quite limited. The remaining portion is simply associated with the horizontal shock oscillations near the midplane. Since the shock flapping motions at low are mostly horizontal, the random vertical motions of the dense gas in NU models are forced predominantly by the impact of rarefied gas arriving from high altitudes. The fact that the rarefied gas has , almost independent of , suggests the flapping motions drives more-or-less constant vertical motions at high ; this is because the total mass of rarefied gas is almost the same in all models, equivalent to a surface density of . Since the fraction of the rarefied component decreases with increasing (see Table 2), the ratio of vertical kinetic energy in the rarefied gas to the mass of dense gas decreases with . This causes of the dense medium to decrease with increasing , roughly as in NU models. For NM models, the dense gas in the immediate postshock region is overpressured due to the strong heating and thus expands vertically, enhancing compared to those in NU models.
5. Self-Gravitating Models
We now explore the formation of self-gravitating clumps and their internal properties. For NU models, we find that the inclusion of self-gravity always results in catastrophic collapses of self-gravitating clouds that form in the postshock region, preventing us from continuing simulations further. For this reason, we present the results of self-gravitating models only with the density-modified heating rate (“SM” models). Instead of running self-gravitating models from , we make use of the “saturated-state” data sets of NM models at and restart them by slowly turning on the gaseous self-gravity over a time interval of .
Neglecting the effect of the rarefied medium, the gravitational susceptibility of a midplane dense layer in NM models can be measured by the average Toomre stability parameter
| (15) |
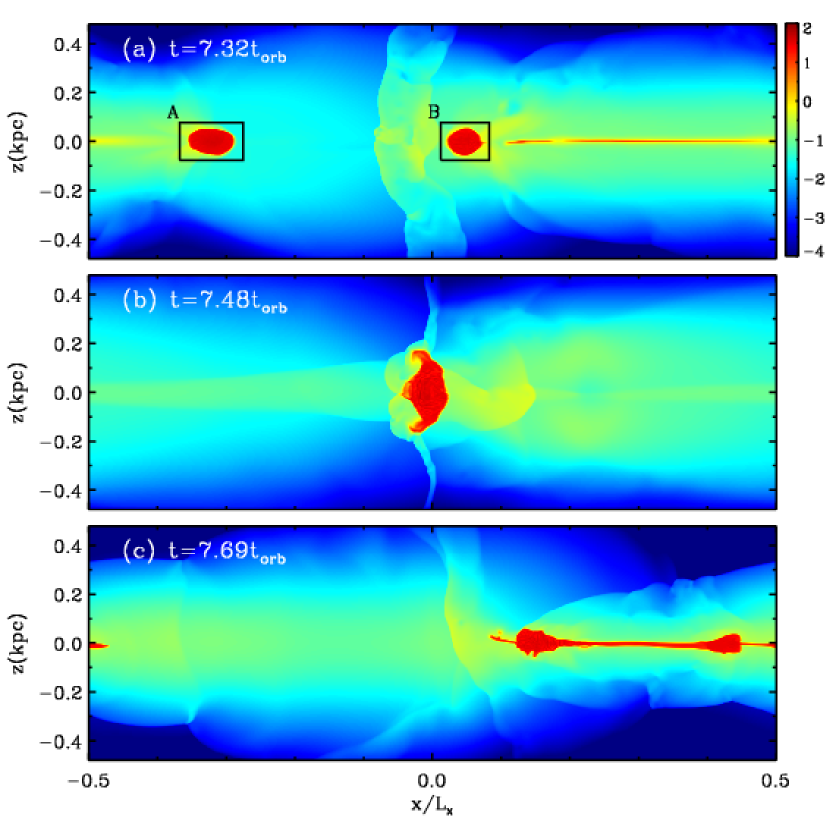
where is the mean sound speed of the dense gas. With the inclusion of self-gravity, the dense layer in model SM.S10 has and thus is quite unstable, initiating the collapse of high-density regions. Due to the stiff equation of state, however, the collapsing clouds soon reach an equilibrium state with only a moderate central density , which is only times larger than the average density of the dense gas in model NM.S10. As these clouds follow galaxy rotation, they merge together in regions of converging streaming velocities, eventually resulting in two big condensations. Figure 14 shows the density snapshots in logarithmic color scale of model SM.S10 at , , and . Two clouds are widely separated from each other during traversal of the interarm region (Fig. 14a). After one cloud enters the spiral shock, it loses most of its -momentum, and the second cloud can then collide with it when it enters the shock at high speed (Fig. 14b). Since the two clouds are on their own epicyclic orbits before the collision, however, they retain quite different even after the collision, preventing them from merging into a single entity. Due to the Coriolis force, the two clouds subsequently have different , so that the merged entity elongates in the expansion zone (Fig. 14c), and separates back into two pieces in the interarm region.
The dense layer in model SM.S05 has and is thus marginally unstable. With the aid of shock compression, the dense gas in the postshock region collapses and eventually forms two self-gravitating clumps. In this model, the collision of these clumps at the shock and subsequent break up in the expansion zone is similar to model SM.S10. With , on the other hand, the dense layer in model SM.S02 is gravitationally stable and does not form dense clumps. Compared with model NM.S02, self-gravity in model SM.S02 increases the fraction of the dense phase by about a factor of 2, which in turn decreases its vertical velocity dispersion by a similar factor.
The presence of self-gravity leads to stronger shock flapping motions than in the NU models, increasing the velocity dispersion. In model SM.S02, the in-plane velocity dispersions of the dense component increases by a factor of compared to model NU.S02; for low surface density, the self-gravity is not sufficiently strong to have a major effect. For the SM.S05 and SM.S10 models, however, the stronger self-gravity make a larger difference to shock flapping, in turn driving larger velocity dispersions. Correcting for streaming, the velocity dispersions of both dense and rarefied phases in model SM.S05 reach , about twice larger than those in model NM.S05. In model SM.S10, the dense gas velocity dispersions are , while the rarefied gas has the velocity dispersions up to . Note that these in-plane velocity dispersions in multi-phase, self-gravitating models are similar to those in the isothermal self-gravitating models with studied in Paper I.

| Model | ||||||
|---|---|---|---|---|---|---|
| (km ) | (km ) | (pc) | (cm-3) | |||
| SM.S05 | ||||||
| SM.S10 |
Since the self-gravitating clumps produced in models SM.S05 and SM.S10 move almost ballistically, the position of the largest surface density at a given time does not always correspond to the minimum of the spiral potential. In fact, the clumps are near the potential minimum () only for , making the definition of the arm regions rather ambiguous. In addition, due to accretion onto the clumps, the rarefied medium in these models amounts to less than 10% of the total mass, much smaller than the observed mass fraction of the warm gas near the solar neighborhood (Heiles, 2001; Heiles & Troland, 2003). For these reasons, these clumps are unlike real self-gravitating clouds in spiral galaxies. Nevertheless, we believe these model clouds may provide clues to the internal properties and virial balance of real interstellar clouds, in that they represent a limiting situation in which internal turbulent feedback from star formation is absent.
Keeping in mind the caveats mentioned above, we proceed as follows to calculate the cloud properties. To define the boundary of the dense clumps, we choose the threshold density , corresponding to in the thermal equilibrium curve. Using a CLUMPFIND algorithm (e.g., Williams et al. 1994), we find the interior of each cloud with . We then measure the mean density , the averaged sound speed and the mean one-dimensional internal velocity dispersion of each cloud, where the overlines denote the mass-weighted average. We then count the total number of pixels on the XZ plane occupied by each cloud, and calculate the cloud size . Assuming a spherical shape, we calculate the total mass and the virial ratio of each cloud via
| (16) |
which is the ratio of the total kinetic energy to the gravitational potential energy for a uniform spherical cloud (e.g., Bertoldi & McKee 1992; McKee & Ostriker 2007); note that central concentration would decrease . Figure 15 gives an example of the shapes and internal velocities of two clumps shown in Figure 14a. Note that the velocity vectors are distributed quite randomly, indicative of (subsonic) turbulent motions within the clouds.
Table 4 summarizes the average properties of the clouds that form in models SM.S05 and SM.S10. The typical size and mass of the clouds are found to be - and , respectively, with the clouds in model SM.S05 somewhat smaller and less massive than in model SM.S10. Overall, for all the clouds, suggesting that they are (marginally) gravitationally bound. The mean sound speed inside the clouds is , times larger than the one-dimensional internal velocity dispersions . This indicates that the major support against self-gravity comes predominantly from the thermal energy, a consequence of the density-modified heating rate we adopt. The relatively low value of the internal turbulent velocity dispersion suggests that the interaction of a dense, gravitationally-bound cloud with its surroundings can drive only a modest level of internal turbulence.
6. Summary & Discussion
While stellar spiral arms in disk galaxies provide smoothly varying low-amplitude gravitational potential perturbations, the response of the interstellar gas to them is quite dramatic. Spiral shocks compress the ISM and the high post-shock densities may trigger growth of arm substructures and star formation. In addition, radiative cooling and heating of the gas makes the ISM inherently inhomogeneous, producing two phases that differ in density and temperature by about two orders of magnitude. Moreover, the vertical stellar gravity tends to produce stratification of the cold and warm gas due to differential buoyancy; this stratification can be modified by vertical turbulence, however. Interactions of these processes may significantly affect the gas flows and shock structures, compared with results from our previous work (and that of other groups), which employed an isothermal approximation (Paper I) or neglected the vertical degree of freedom (Paper II). In this paper, we have conducted nonlinear hydrodynamic simulations in a two-dimensional slice perpendicular to a local segment of a spiral arm that is tightly wound (with a pitch angle ) and rotates rigidly (with a pattern speed ). To handle the Coriolis force arising from the galaxy rotation self-consistently, we allow for gas motions parallel to the arm (i.e. perpendicular to the domain of the simulation). We consider two different forms of gas heating; the usual constant heating rate (for NU models) and the density-modified heating rate (for NM and SM models), which mimics the effect of star-formation feedback in a very simple way, to limit runaway collapse. We start from initially isothermal disks that are in vertical hydrostatic equilibrium but out of thermal equilibrium. We slowly turn on the amplitude of the spiral arm potential such that it attains a full strength at 1.5 orbital times. Magnetic fields are neglected in the present work.
Our main results and their astronomical implications are as follows.
1. Two-phase disk equilibria without spiral arms. — In the absence of spiral-arm potential perturbations (and other sources of turbulence), the vertical structure of equilibrium disks depends on the disk surface density . When (for Solar neighborhood conditions), the disk experiences TI and evolves toward an equilibrium configuration with a thin slab of dense gas () near the midplane sandwiched between layers of rarefied gas (with ). Here, is the maximum pressure allowed for the thermally-stable rarefied gas with our adopted heating and cooling functions, is its density-weighted sound speed, and is the stellar density near the Solar neighborhood. In our models, the transition between the dense and rarefied phases occurs approximately at , insensitive to , as long as the disk is unstable to TI. Without self-gravity, the vertical distribution of the rarefied gas in equilibrium is well fitted by a Gaussian profile whose surface density is fixed to . When self-gravity is included, the gravity from the midplane dense layer compresses the overlying rarefied component further, forcing overpressured rarefied gas to transform to the dense phase. The resulting surface density of the rarefied gas is reduced to , with the reduction factor defined by equation (A5). When , the disk has too low a pressure to produce the dense component; equilibrium consists only of the rarefied gas. When , either a single rarefied disk or a two-phase disk is possible, depending on the initial conditions. Our S02 and S05 models with and , respectively, that start from a warm isothermal configurations all end up with a single-component rarefied disk, in the absence of spiral perturbations.
2. Shock flapping motions in vertically stratified disks. — Spiral-arm potential perturbations lead to spiral shocks in the gas, which are vertically curved and non-stationary, showing strong flapping motions perpendicular to the arms. Similarly to the one-dimensional cases studied in Paper II, the shock compression and postshock expansion in two dimensions allow phase transitions, but only if the gas density at the shock and/or the postshock expansion zone reaches the thermally-unstable range (). In model NU.S10 with and the uniform heating rate, the shocked dense gas has large enough density that the postshock expansion is unable to return it to the thermally unstable regime. As a consequence, there is a large amount of interarm dense gas entering the shock in this model, which collides with other dense gas in the arm, producing dense condensations. In other models with lower surface density or the density-modified heating rate, the shocked gas re-expands and becomes thermally unstable, returning to either the dense or the rarefied phase in the interarm region.
The shock flapping motions in our models arise due to the fact that the arm crossing time of gas is incommensurate with the vertical oscillation period, so that steady flows are not possible. Seen from the upstream side, the shock is convex when the postshock regions are maximally compressed, and concave when the postshock vertical expansion is strongest. These non-steady motions of shock fronts are commonly seen in numerical simulations with sufficient resolution (e.g., Martos & Cox 1998; Gómez & Cox 2002, 2004; Kim & Ostriker 2006; Paper I; Wada 2008), although simulations with low resolution (Tubbs, 1980) or particles (e.g., Dobbs et al. 2008) do not capture the flapping motions clearly.
It is interesting to note that radio continuum images of the 5-kpc arm (or the Scutum arm) toward the galactic longitude in the Milky Way shows a bow shock feature in the warm ionized medium with temperature (Sofue, 1985), similarly to a convex shock front seen in Figure 4b. The radio emission from the bow shock is presumably thermal radiations from ionized gas, with emission measure of cm-6. The curvature of the observed bow shock, as measured by the longitudinal offset of the shock at latitude relative to the shock front at the midplane, is for . This value is about a half of the maximum curvature of the shock front in our S10 models, where denotes the shock position at height . This strongly suggests that the bow shock associated with the 5-kpc arm is most likely a cross section of a galactic spiral shock that is undergoing flapping motions. Velocity information is needed to determine whether the 5-kpc arm regions are currently being compressed or expanding in the course of the flapping motions.
In this paper, for consistency with our local approximation we have considered tightly wound arms with a very small pitch angle , and a pattern speed . Observed spiral arms of external galaxies are often more loosely wound with (e.g., Seigar et al., 2008) and span a wide range of galactocentric radii with differing . For fixed , a larger arm pitch angle would imply a larger streaming velocity perpendicular to the arm (see eq. 1). Spiral shocks would then become correspondingly stronger and shifted farther downstream (e.g., Roberts, 1969; Shu et al., 1973; Kim & Ostriker, 2002), exhibiting larger amplitude flapping motions (Paper I). On the other hand, is increasingly small as approaches . Consequently, the spiral shock as well as associated flapping motions would become weaker as one approaches corotation, where the gas would simply concentrate near the potential minimum, without involving a shock.
3. Time-averaged shock structure. — Within a few orbital times after the development of spiral shocks, gas flows reach a quasi-steady state in the sense that the mass fractions of dense and rarefied gas do not change appreciably with time. For models with , the quasi-steady mass fraction of the rarefied gas is , which can be compared to when the spiral potential is absent. Despite the shock flapping motions, most of the gas is found close to thermal equilibrium, with a small fraction thermally unstable. The density and temperature PDFs are thus bimodal. For model NU.S10, the dense and rarefied peaks are located at and , respectively, and the dense part of the density PDF is described by a lognormal distribution. The time-averaged structure can be well represented by local vertical hydrostatic equilibrium, supported mainly by the thermal pressure rather than gas random motions. This indicates that the vertical hydrostatic balance is a reasonable approximation even in the presence of spiral shocks. The profiles of surface density perpendicular to the arm are more-or-less symmetric with a shock compression factor of , and have broad arm regions whose width correlates with the strength of the shock flapping motions. The fractional widths of the arm, postshock expansion zone, and interarm region are typically 10%, 20%, and 70% of the arm-to-arm distance, where the gas stays for 15%, 30%, and 55% of the arm-to-arm crossing time, respectively. The shock flapping motions in the XZ plane make the arm wider than in one-dimensional spiral shocks where the arm takes up only 1% of the arm-to-arm distance (Paper II).
The dense gas produced from TI and shock compression tends to sink toward the midplane to form a thin slab, while high-altitude regions are dominated by warm rarefied gas. The thickness of the dense slab is , depending on the total gas content, heating rate, and presence/absence of self-gravity, while the scale height of the rarefied gas is insensitive to the parameters. For model NM.S10, the thickness ratio of the dense to rarefied components is about 5, which is not much different from the results of Dobbs et al. (2008) who reported that the warm gas extends vertically up four times more than the cold gas. With high density and pressure, the dense slab would transform to molecular clouds if the appropriate chemical reactions for molecule formation were included (e.g., Dobbs & Bonnell 2007; Dobbs & Price 2008). Thin distributions of the cold dense gas are in fact common in numerical simulations of galactic disks with TI where turbulence is driven by magnetorotational instability (Piontek & Ostriker, 2007), stellar feedback via H II regions (Koyama & Ostriker, 2009a, b), or supernovae explosions (Korpi et al., 1999; de Avillez & Berry, 2001; Joung & Mac Low, 2006; Joung et al., 2009). The observed molecular distribution the Milky Way has a scale height of within the Solar circle, somewhat reduced for the most massive clouds (e.g., Malhotra 1994; Bronfman et al. 2000; Stark & Lee 2005). Galactic H II regions are also within about of the midplane (Lockman, 1977). In the inner Galaxy and near the Solar circle, the scale height of the cold H I layer is about 1.5 times smaller than the warm H I gas (e.g., Falgarone & Lequeux 1973; Crovisier 1978; see also Ferriére 2001), although the cold and warm phases appear to have a similar scale height in the outer Galaxy (e.g., Dickey et al. 2009).
4. Random gas motions driven by shock flapping motions. — The flapping motions of spiral shocks stir the gas and supply random kinetic energy. Allowing for incomplete subtraction of streaming motions in the arm region, the induced density-weighted velocity dispersions are for both dense and rarefied components for the non-self-gravitating models, with larger values corresponding to disks with larger . Compared with the results of Paper II where the vertical coordinate was suppressed, these values are similar to those for the dense gas in the arms and larger by a factor of for the interarm rarefied gas. This implies that it is the rarefied gas that is more efficiently stirred by the shock flapping motions. The self-gravitating models have larger velocity dispersions, in the range for the dense and for the rarefied gas, indicating that self-gravity enhances shock flapping and velocity dispersions, especially for rarefied gas. These in-plane velocity dispersions in the current multiphase models are similar to those in the isothermal models considered in Paper I.
The vertical velocity dispersions of the rarefied gas in NU and NM models are , insensitive to . In NU models, the vertical motions of the dense gas are excited preferentially by vertical motions of the rarefied gas. Since the mass fraction of the rarefied gas decreases with , the vertical velocity dispersions of the dense gas in NU models is a decreasing function of , varying roughly as . In NM models, the postshock gas is overpressured due to enhanced heating and thus expands vertically, increasing compared to NU models.
The level of random gas motions in our models are generally smaller than the observed velocity dispersions for atomic gas in the solar neighborhood (e.g., Heiles & Troland 2003) and for the larger molecular clouds in the Milky Way (e.g., Stark & Brand 1989; Solomon et al. 1987; Heyer et al. 2009). Thus, we conclude that other sources of the interstellar turbulence (e.g., Mac Low & Klessen 2004; Elmegreen & Scalo 2004) must exceed that provided by spiral shocks. One of the dominant mechanisms is of course supernova explosions (e.g., Korpi et al., 1999; de Avillez & Breitschwerdt, 2005; Joung & Mac Low, 2006; Joung et al., 2009). In outer regions of galaxies where star formation activity is low, the magnetorotational instability (e.g., Sellwood & Balbus, 1999; Piontek & Ostriker, 2005, 2007) and/or cosmic infall of gas (e.g., Santillán et al. 2007, 2009; Klessen & Hennebelle 2009) may play an important role in driving the ISM turbulence. H II region expansion and radiation pressure are important in injecting energy into the ISM as GMCs are dispersed (e.g., Matzner 2002; Murray et al. 2010). At large scales, self-gravitating instability with galactic rotation and shear can drive turbulence at near-sonic levels (e.g., Kim & Ostriker, 2002; Wada & Norman, 2002; Kim & Ostriker, 2007; Agertz et al., 2009).
5. Effect of self-gravity and properties of self-gravitating clouds. — When self-gravity is included, dense gas in SM models with suffers from gravitational instability, eventually forming two large clouds in each model. These are separate in the interarm regions, temporarily merge in the arm, and then break up into two pieces in the postshock expansion zone. These clouds have a radii and mass each, and are gravitationally bound with a virial parameter of . In our present models, we have not attempted to include realistic star formation feedback, but instead increase the heating rate at high density to prevent collapse. As a consequence, the main support against self-gravity comes from thermal pressure. The mean thermal sound speed and internal velocity dispersion of the clouds are and , respectively. For models with , self-gravity is insufficient to form bound clouds. Nevertheless, self-gravity increases the dense gas fraction by a factor of compared to the non-self-gravitating counterpart of this model, which in turn decreases the vertical velocity dispersion of the dense gas by a similar factor.
Formation of self-gravitating clouds in our two-dimensional models requires the production of the dense gas due to TI, and then additional shock compression. Although our present models do not capture the cloud destruction process, bound clouds created inside spiral arms may be disrupted before they leave the arms if feedback from star formation is sufficiently strong (Shetty & Ostriker, 2008; Wada, 2008). Nevertheless, the presence of high-density, self-gravitating clouds in the interarm regions opens an interesting possibility that the spiral shocks – where the diffuse gas is strongly compressed – do not necessarily coincide with the regions of highest gas density (in gravitationally-bound clouds). For example, Patrikeev et al. (2006) found strongly-polarized nonthermal radio emission that may trace magnetic arms, detected preferentially upstream of the CO arms in the inner disk of the Whirlpool galaxy M51 (see also e.g., Fletcher et al. 2010). We note, however, that the current unmagnetized models are not yet able to provide clues to the relation between gaseous and magnetic arms. It will be interesting to see how TI, spiral shocks, and realistic star formation feedback conspire with magnetized self-gravitating instabilities to create bound clouds and arm substructures (possibly including separate magnetic arms), and to generate turbulence in the gas.
Appendix A Two-Phase Disks in Hydrostatic Equilibrium
We consider thermally bistable two-phase disks in which a cold, dense layer with surface density with thickness is surrounded by a warm, rarefied medium. Since the scale height of the dense layer is very small compared to that of the rarefied gas, we approximate the former as razor-thin (). We further assume that the mass fraction of the rarefied gas is small, so that its self-gravity is unimportant. Let denote the density distribution of the rarefied gas. In the presence of the external gravity from a stellar disk of uniform density , the condition of vertical hydrostatic equilibrium for the warm gas reads
| (A1) |
where is the isothermal sound speed of the rarefied gas, assumed to be independent of . Integrating equation (A1) over , one obtains
| (A2) |
where is the Gaussian scale height which the rarefied gas would have in the absence of self-gravity. The surface density, , of the rarefied medium is then given by
| (A3) |
where
| (A4) |
is the surface density without gas self-gravity,
| (A5) |
is the reduction factor, and
| (A6) |
measures the strength of gravity due to the dense gaseous slab relative to the external vertical gravity (see, e.g., Kim et al. 2002). Note that the results of §3 suggest that when two-phase equilibria are established, the interface between dense and rarefied media has a constant pressure , so that we may take since the dense medium has a very small scale height (e.g., Piontek & Ostriker 2007), such that
| (A7) |
The scale height of the rarefied medium is given by
| (A8) |
where equation (A2) is used.
The condition of mass conservation requires
| (A9) |
so that
| (A10) |
For self-gravitating cases, we fix and , and solve equations (A7) and (A10) iteratively to find and as functions of . The resulting values of and are plotted in Figure 3 as dashed lines. For non-self-gravitating cases, and corresponding to , plotted as solid lines in Figure 3.
Note that since , if ; for our models with and , . When , , so that and for and .
References
- Agertz et al. (2009) Agertz, O., Lake, G., Teyssier, R., Moore, B., Mayer, L., & Romeo, A. B. 2009, MNRAS, 392, 294
- Baade (1963) Baade, W. 1963, in The Evolution of Stars and Galaxies, ed. C. Payne-Gaposchkin (Cambridge: Harvard Univ. Press), 218
- Balbus (1988) Balbus, S. A. 1988, ApJ, 324, 60
- Bertin & Amorisco (2009) Bertin, G., & Amorisco, N. C. 2009, A&A, submitted; arXiv:0912.3178
- Bertoldi & McKee (1992) Bertoldi, F., & McKee, C. F. 1992, ApJ, 395, 140
- Boley & Durisen (2006) Boley, A. C., & Durisen, R. H. 2006, ApJ, 641, 534
- Boomsma et al. (2008) Boomsma, R., Oosterloo, T. A., Fraternali, F., van der Hulst, J. M., & Sancisi, R. 2008, A&A, 490, 555
- Bronfman et al. (2000) Bronfman, L., Casassus, S., May, J., & Nyman, L.A. 2000, A&A, 358, 521
- Corder et al. (2008) Corder, S., Sheth, K., Scoville, N. Z., Koda, J., Vogel, S. N., & Ostriker, E. C. 2008, ApJ, 689, 148
- Cox (2005) Cox, D. P. 2005, ARA&A, 43, 337
- Cox & Smith (1974) Cox, D. P, & Smith, B. W. 1974. ApJ, 189, L105
- Crovisier (1978) Crovisier, J. 1978, A&A, 70, 43
- de Avillez & Berry (2001) de Avillez, M. A., & Berry, D. L. 2001, MNRAS, 328, 708
- de Avillez & Breitschwerdt (2005) de Avillez, M. A., & Breitschwerdt, D. 2005, A&A, 436, 585
- Dickey et al. (1990) Dickey, J. M., Hanson, M. M., & Helou, G. 1990, ApJ, 352, 522
- Dickey et al. (2009) Dickey, J. M., Strasser, S., Gaensler, B. M., Haverkorn, M., Kavars, D., McClure-Griffiths, N. M., Stil, J., & Taylor, A. R. 2009, ApJ, 693, 1250
- Dobbs & Bonnell (2006) Dobbs, C. L., & Bonnell, I. A. 2006, MNRAS, 367, 873
- Dobbs & Bonnell (2007) Dobbs, C. L., & Bonnell, I. A. 2007, MNRAS, 376, 1747
- Dobbs & Bonnell (2008) Dobbs, C. L., & Bonnell, I. A. 2008, MNRAS, 385, 1893
- Dobbs & Price (2008) Dobbs, C. L., & Price, D. J. 2008, MNRAS, 383, 497
- Dobbs et al. (2008) Dobbs, C. L., Glover, S. C. O., Clark, P. C., & Klessen, R. S. 2008, MNRAS, 389, 1097
- Dobbs et al. (2010) Dobbs, C. L., Theis, C., Pringle, J. E., & Bate, M. R. 2010, MNRAS, 403, 625
- Draine & Bertoldi (1996) Draine, B. T., & Bertoldi, F. 1996, ApJ, 468, 269
- Einfeldt et al. (1991) Einfeldt, B., Munz, C. D., Roe, P. L., & Sj’́ogreen,B. J. 1991, J. Comp. Phys., 92, 273
- Elmegreen (1993) Elmegreen, B. G. 1993, ApJ, 411, 170
- Elmegreen (1994) Elmegreen, B. G. 1994, ApJ, 433, 39
- Elmegreen & Elmegreen (1983) Elmegreen, B. G., & Elmegreen, D. M. 1983, MNRAS, 203, 31
- Elmegreen & Scalo (2004) Elmegreen, B. G., & Scalo, J. 2004, ARA&A, 42, 211
- Elmegreen et al. (2006) Elmegreen, D. M., Elmegreen, B. G., Kaufman, M., Sheth, K., Struck, C., Thomasson, M., & Brinks, E. 2006, ApJ, 642, 158
- Falgarone & Lequeux (1973) Falgarone, E., & Lequeux, J. 1973, A&A, 25, 253
- Ferriére (2001) Ferriére K. M. 2001, Rev. Mod. Phys. 73, 1031
- Field (1965) Field, G. B. 1965, ApJ, 142, 531
- Field et al. (1969) Field, G. B., Goldsmith, D. W., & Habing, H. J. 1969, ApJ, 155, L149
- Fletcher et al. (2010) Fletcher, A., Beck, R., Shukurov, A., Berkhuijsen, E. M., & Horellou, C. 2010, MNRAS, submitted; arXiv:1001.5230
- Gardiner & Stone (2005) Gardiner, T. A., & Stone, J. M. 2005, J. Comp. Phys., 205, 509
- Gardiner & Stone (2008) Gardiner, T. A., & Stone, J. M. 2008, J. Comp. Phys., 227, 4123
- Glover & Mac Low (2007) Glover, S. C. O., & Mac Low, M.-M. 2007, ApJ, 659, 1317
- Glover et al. (2010) Glover, S. C. O., S. Federrath, C., Mac Low, M.-M., & Klessen, R. S. 2010, MNRAS, 404, 2
- Gómez & Cox (2002) Gómez, G. C., & Cox, D. P. 2002, ApJ, 580, 235
- Gómez & Cox (2004) Gómez, G. C., & Cox, D. P. 2004, ApJ, 615, 744
-
Gordon (2007)
Gordon, K. (2007),
Spitzer press release at
http://gallery.spitzer.caltech.edu/Imagegallery/
image.php?image name=sig07-025 - Harten et al. (1983) Harten, A., Lax, P. D., & van Leer, B. 1983, SIAM Rev., 25, 35
- Hawley et al. (1995) Hawley, J. F., Gammie, C. F., & Balbus, S. A. 1995, ApJ, 440, 742
- Heiles (2001) Heiles, C. 2001, ApJ, 551, L105
- Heiles & Troland (2003) Heiles, C., & Troland, T. H. 2003, ApJ, 586, 1067
- Hernquist (1990) Hernquist, L. 1990, Dynamics and Interactions of Galaxies, ed. R. Wielen (Berlin: Springer), 108
- Heyer et al. (2009) Heyer, M., Krawczyk, C., Duval, J., & Jackson, J. M. 2009, ApJ, 699, 1092
- Holmberg & Flynn (2000) Holmberg, J., & Flynn, C. 2000, MNRAS, 313, 209
- Inoue & Inutsuka (2008) Inoue, T., & Inutsuka, S. 2008, ApJ, 687, 303
- Joung & Mac Low (2006) Joung, M. K. R., & Mac Low, M.-M. 2006, ApJ, 653, 1266
- Joung et al. (2009) Joung, M. K. R., Mac Low, M.-M., & Bryan, G. L. 2009, ApJ, 704, 137
- Kenney (1997) Kenney, J. D. P. 1997, in The Interstellar Medium in Galaxies, ed. J. M. van der Hulst (Dordrecht:Kluwer), 33
-
Kennicutt (2004)
Kennicutt, R. C. 2004, Spitzer press release at
http://www.spitzer.caltech.edu/Media/releases/
ssc2004-19/ssc2004-19a.shtml - Kim, Kim, & Ostriker (2006) Kim, C.-G., Kim, W.-T., & Ostriker, E. C. 2006, ApJ, 649, L13 (Paper I)
- Kim, Kim, & Ostriker (2008) Kim, C.-G., Kim, W.-T., & Ostriker, E. C. 2008, ApJ, 681, 1148 (Paper II)
- Kim & Ostriker (2002) Kim, W.-T., & Ostriker, E. C. 2002, ApJ, 570, 132
- Kim & Ostriker (2006) Kim, W.-T., & Ostriker, E. C. 2006, ApJ, 646, 213
- Kim & Ostriker (2007) Kim, W.-T., & Ostriker, E. C. 2007, ApJ, 660, 1232
- Kim et al. (2002) Kim, W.-T., Ostriker, E. C., & Stone, J. M. 2002, ApJ, 581, 1080
- Klessen & Hennebelle (2009) Klessen, R. S., & Hennebelle, P. 2009, A&A, in press; arXiv:0912.0288
- Koda et al. (2009) Koda, J., Scoville, N. et al. 2009, ApJ, 700, L132
- Korpi et al. (1999) Korpi, M. J., Brandenburg, A., Shukurov, A., Tuominen, I., & Nordlund, A. 1999, ApJ, 514, L99
- Koyama & Inutsuka (2002) Koyama, H., & Inutsuka, S. 2002, ApJ, 564, L97
- Koyama & Ostriker (2009a) Koyama, H., & Ostriker, E. C. 2009, ApJ, 693, 1316
- Koyama & Ostriker (2009b) Koyama, H., & Ostriker, E. C. 2009, ApJ, 693, 1346
- Kritsuk & Norman (2002) Kritsuk, A. G., & Norman, M. L. 2002, ApJ, 569, L127
- La Vigne et al. (2006) La Vigne, M. A., Vogel, S. N., & Ostriker, E. C. 2006, ApJ, 650, 818
- Lemaster & Stone (2009) Lemaster, M. N., & Stone, J. M. 2009, ApJ, 691, 1091
- Lin & Shu (1964) Lin, C. C., & Shu, F. H. 1964, ApJ, 140, 646
- Lin & Shu (1966) Lin, C. C., & Shu, F. H. 1966, Proceedings of the National Academy of Science, 55, 229
- Lockman (1977) Lockman, F. J. 1977, AJ, 82, 408
- Lubow et al. (1986) Lubow, S. H., Balbus, S. A., & Cowie, L. L. 1986, ApJ, 309, 496
- Mac Low & Klessen (2004) Mac Low, M.-M., & Klessen, R. S. 2004, Rev. Mod. Phys. 76, 125
- Malhotra (1994) Malhotra, S. 1994, ApJ, 433, 687
- Marochnik et al. (1983) Marochnik, L. S., Berman, B. G., Mishurov, Yu. N., & Suchkov, A. A. 1983, Ap&SS, 89, 171
- Martos & Cox (1998) Martos, M. A., & Cox, D. P. 1998, ApJ, 509, 703
- Matzner (2002) Matzner, C. D. 2002, ApJ, 566, 302
- McKee & Ostriker (1977) McKee, C. F., & Ostriker, J. P. 1977, ApJ, 218, 148
- McKee & Ostriker (2007) McKee, C. F., & Ostriker, E. C. 2007, ARA&A, 45, 565
- Meerson (1996) Meerson, B. 1996, Rev. Mod. Phys. 68, 215
- Meidt et al. (2008) Meidt, S. E., Rand, R. J., Merrifield, M. R., Shetty, R. & Vogel, S N. 2008, ApJ, 688, 224
- Mufson (1974) Mufson, S. L. 1974, ApJ, 193, 561
- Murray et al. (2010) Murray, N., Quataert, E., & Thompson, T. A. 2010, ApJ, 709, 191
- Oh et al. (2008) Oh, S. H., Kim, W.-T., Lee, H. M., & Kim, J. 2008, ApJ, 683, 94
- Parrish & Stone (2005) Parrish, I. J., & Stone, J. M. 2005, ApJ, 633, 334
- Patrikeev et al. (2006) Patrikeev, I., Fletcher, A., Stepanov, R., Beck, R., Berkhuijsen, E. M., Frick, P., & Horellou, C. 2006, A&A, 458, 441
- Piontek & Ostriker (2004) Piontek, R. A., & Ostriker, E. C. 2004, ApJ, 601, 905
- Piontek & Ostriker (2005) Piontek, R. A., & Ostriker, E. C. 2005, ApJ, 629, 849
- Piontek & Ostriker (2007) Piontek, R. A., & Ostriker, E. C. 2007, ApJ, 663, 183
- Rand & Kulkarni (1990) Rand, R. J., & Kulkarni, S. R. 1990, ApJ, 349, L43
- Roberts (1969) Roberts, W. W. 1969, ApJ, 158, 123
- Salo & Laurikainen (2000) Salo, H., & Laurikainen, E. 2000, MNRAS, 319, 377
- Santillán et al. (2007) Santillán, A., Sánchez-Salcedo, F. J., & Franco, J. 2007, ApJ, 662, L19
- Santillán et al. (2009) Santillán, A., Sánchez-Salcedo, F. J., Kim, J., Franco, J., & Hernandez-Cervantes, L. 2009, Proceedings of “The Role of Disk-Halo Interaction in Galaxy Evolution: Outflow vs. Infall?”, ed. M. de Avillez; arXiv:0905.0134
- Scoville et al. (2001) Scoville, N. Z., Polletta, M., Ewald, S., Stolovy, S. R., Thompson, R., & Rieke, M. 2001 AJ, 122, 3017
- Seigar et al. (2008) Seigar, M. S., Kennefick, D., Kennefick, J., & Lacy, C. H. S. 2008, ApJ, 678, L93
- Sellwood & Balbus (1999) Sellwood, J. A., & Balbus, S. A. 1999, ApJ, 511, 660
- Shetty & Ostriker (2006) Shetty, R., & Ostriker, E. C. 2006, ApJ, 647, 997
- Shetty & Ostriker (2008) Shetty, R., & Ostriker, E. C. 2008, ApJ, 684, 978
- Shetty et al. (2007) Shetty, R., Vogel, S. N., & Ostriker, E. C., & Teuben, P. T. 2007, ApJ, 665, 1138
- Shu et al. (1973) Shu, F. H., Milione, V., & Roberts, W. W. 1973, ApJ, 183, 819
- Sofue (1985) Sofue, Y. 1985, PASJ, 37, 507
- Solomon et al. (1985) Solomon, P. M., Sanders, D. B., & Rivolo, A. R. 1985, ApJ, 292, L19
- Solomon et al. (1987) Solomon, P. M., Rivolo, A. R., Barrett, J., & Yahil, A. 1987, ApJ, 319, 730
- Springel et al. (2005) Springel, V., Di Matteo, T., & Hernquist, L. 2005, MNRAS, 361, 776
- Stark (1979) Stark, A. A. 1979, Ph.D. Thesis, Princeton University
- Stark & Brand (1989) Stark, A. A., & Brand, J. 1989, ApJ, 339, 763
- Stark & Lee (2005) Stark, A. A., & Lee, Y. 2005, ApJ, 619, L159
- Stone & Gardiner (2009) Stone, J. M., & Gardiner, T. A. 2009, New Astronomy, 14, 139
- Stone et al. (2008) Stone, J. M., Gardiner, T. A., Teuben, P. Hawley, J. F., & Simon, J. B. 2008, ApJS, 178, 137
- Toomre & Toomre (1972) Toomre, A., & Toomre, J. 1972, ApJ, 178, 623
- Tubbs (1980) Tubbs, A. D. 1980, ApJ, 239, 882
- Vogel, Kulkarni, & Scoville (1988) Vogel, S. N., Kulkarni, S. R., & Scoville, N. Z. 1988, Nature, 334, 402
- Wada (2008) Wada, K. 2008, ApJ, 675, 188
- Wada & Koda (2004) Wada, K., & Koda, J. 2004, MNRAS, 349, 270
- Wada & Norman (2002) Wada, K. & Norman, C. A. 2002, ApJ, 566, L21
- Wada & Norman (2007) Wada, K. & Norman, C. A. 2007, ApJ, 660, 276
- Williams et al. (1994) Williams, J. P., de Geus, E. J., & Blitz, L. 1994, ApJ, 428, 693
- Willner et al. (2004) Willner, S. P., Ashby, M. L. N., & Barmby, P., et al. 2004, ApJS, 154, 222
- Woodward (1975) Woodward, P. R. 1975, ApJ, 195, 61
- Woodward (1976) Woodward, P. R. 1976, ApJ, 207, 484
- Wolfire et al. (2003) Wolfire, M. G., McKee, C. F., Hollenbach, D., & Tielens, A. G. G. M. 2003, ApJ, 587, 278
- Zimmer et al. (2004) Zimmer, P., Rand, R. J., & McGraw, J. T. 2004, ApJ, 607, 285