Monovalent Ion Condensation at the Electrified Liquid/Liquid Interface
Abstract
X-ray reflectivity studies demonstrate the condensation of a monovalent ion at the electrified interface between electrolyte solutions of water and 1,2-dichloroethane. Predictions of the ion distributions by standard Poisson-Boltzmann (Gouy-Chapman) theory are inconsistent with these data at higher applied interfacial electric potentials. Calculations from a Poisson-Boltzmann equation that incorporates a non-monotonic ion-specific potential of mean force are in good agreement with the data.
pacs:
68.05.Cf, 61.05.cm, 61.20.Qg, 82.45.GjInterfacial ion distributions underlie numerous electrochemical and biological processes, including electron and ion transfer across charged biomembranes and energy storage in electrochemical capacitors. The solution to the Poisson-Boltzmann equation for a planar geometry, Gouy-Chapman theory, including modifications with a Stern layer, is often used to predict ion distributions near those interfaces.Gouy (1910); *Chapman1913; *Stern1924 We showed previously that the predictions of such theories are inconsistent with x-ray reflectivity measurements of ion distributions at an electrified liquid/liquid interface.Luo et al. (2006); *Luo2006b Instead, an ion-specific Poisson-Boltzmann equation (PB-PMF) that incorporated a potential of mean force (PMF) for each ion produced excellent agreement with the x-ray results.Luo et al. (2006); *Luo2006b The PB-PMF theory accounts for interactions and correlations between ions and solvents that are left out of Gouy-Chapman theory. This approach has promise for understanding ion-specific effects that are relevant to many chemical processes.Lima et al. (2008)
Here, we demonstrate the condensation of a monovalent ion at a liquid/liquid interface. Recent theory proposes that condensation of multivalent ions is the result of strong ion-ion correlations.Grosberg et al. (2002) However, these theories do not predict such distributions for monovalent ions. Our current results can be understood by PB-PMF theory. We have chosen to fit our x-ray data to the potentials of mean force instead of fitting to a model of the electron density profile because a single PMF for each ion determines the ion distributions for all interfacial potentials.
The system under study is the liquid/liquid interface between a 100 mM aqueous solution of NaCl (Fisher Scientific) including 20 mM HEPES to buffer the pH to 7.0, and a 5 mM solution of bis(triphenyl phosphoranylidene) ammonium tetrakis(pentafluorophenyl) borate (BTPPA+, TPFB-) in 1,2-dichloroethane (DCE, Fluka). Water was produced by a Barnstead Nanopure system and DCE was purified using a column of basic alumina. BTPPATPFB was synthesized from BTPPACl (Aldrich) and LiTPFB (Boulder Scientific).Fermin et al. (1999) Conductance measurements using the method in Ref. Raymond and Shedlovsky (1949) determined that 54% of BTPPATPFB is dissociated in DCE.
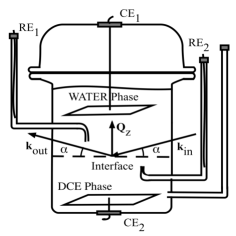
The electric potential difference between the water and oil (DCE) phases is given by the applied potential difference across the electrochemical cell (Fig.1) minus the potential of zero charge (). We determined mV by measuring the interfacial tension as a function of Schmickler (1996). The ions Na+ and Cl- stay primarily in the aqueous phase and BTPPA+ and TPFB- stay in the DCE phase throughout the potential range studied. When , the ions form back-to-back electrical double layers at the interface. For example, when , the concentrations of Na+and TPFB- are enhanced at the interface while those of Cl- and BTPPA+ are depleted. The variation of ionic concentration along the interfacial normal produces a variation in the electron density profile (averaged over the x-y plane) that is probed by x-ray reflectivity.
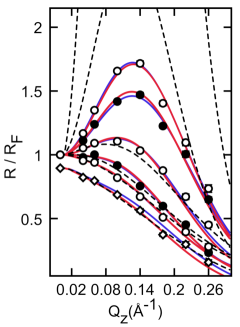
X-ray reflectivity measurements from the electrified liquid/liquid interface were carried out at the ChemMatCARS sector of the Advanced Photon Source.Schlossman et al. (1997) is the reflected intensity normalized by the incident intensity (after subtraction of background scattering Zhang et al. (1999)) as a function of wave vector transfer / , where (=0.41255 0.00005 Å) is the x-ray wavelength and is the angle of incidence (Fig. 1). Figure 2 illustrates / for different . The variation of the peak amplitude in / with increasing reveals the formation of a TPFB- layer, as discussed below.
We analyzed the x-ray data using the Poisson-Boltzmann (PB) equation,
| (1) |
which relates the electric potential along the interfacial normal to the concentration profile of ion i, , with Boltzmann constant , temperature , charge of ion (BTPPA+, TPFB-, Na+, and Cl-), permittivity of free space , and dielectric constant of either DCE (10.43) for or water (78.54) for . is the energy of ion relative to its value in the bulk phase. The bulk ion concentration is calculated from the Nernst equation
111Gibbs energies of transfer: Na+ (57 kJ/mol), Cl- (53 kJ/mol), BTPPA+ (56 kJ/mol), TPFB- (72.5 kJ/mol), last two measured by partitioning
via UV-visible spectroscopy and mass spectroscopy
,Volkov and Deamer (1996). Fitting to the data involves calculating the electron density and from the ion concentration profiles as described previously.Luo et al. (2006); *Luo2006b For the purpose of calculating from the ions were modeled as spheres of diameter 2Å for Na+, 3.5Å for Cl-, 12.6Å for BTPPA+, and 10Å for TPFB-, where the latter were estimated from the crystal structure of BTPPATPFB.Marcus (1988), 222C.Zheng and P. Vanysek (unpublished) The TPFB- ion provides the dominant ionic contribution to the electron density profile when .
The Gouy-Chapman theory assumes that in Eq. 1. Fits of to predictions of Gouy-Chapman theory (Fig. 2, dashed lines) used only the interfacial roughness and a offset ( Å-1, a typical misalignment of the reflectometer) as fitting parameters.
| TABLE I. TPFB- PMF parameters obtained by fitting to the reflectivity data at and 0.33 V. | ||||||||||||||||||||||||||||
|
These fits agree with the data at small ( V to V), but at larger (0.28 V and 0.33 V) is greatly overestimated primarily because Gouy-Chapman theory predicts unphysically large ion concentrations near the interface.
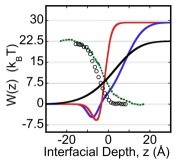
Ion-specific effects can be included in Eq. 1 by expressing , where is the potential of mean force (PMF) for each ion .Luo et al. (2006); *Luo2006b; Horinek and Netz (2007); Daikhin et al. (2001) The PMF of Na+ was calculated from a molecular dynamics (MD) simulation for a single ion.Benjamin (2008) The PMF of Cl- was taken from an MD simulation in the literature.Wick and Dang (2008) Fig. 3 illustrates the monotonic variation of for Na+ and Cl-. Due to the computational difficulties of simulating for large molecular ions such as BTPPA+ and TPFB- we used a phenomenological PMF previously introduced in Ref.Luo et al. (2006); *Luo2006b,
| (2) |
where refers to either the water phase or the oil phase (DCE,), is the Gibbs energy of transfer of ion from water to oil, is an offset to ensure continuity of at , and characterizes the decay of to its bulk values and. We used this monotonic PMF for BTPPA+, but had to modify it for TPFB-, as described below. Since for BTPPA+ is known (Ref. ††footnotemark: ) , the PMF of BTPPA+ is characterized by 3 parameters determined by fitting to data at V where it is expected that the BTPPA+ interfacial concentration is enhanced: Å), Å), and . The large error bars on the PMF of BTPPA+ are due to the small magnitude of the most negative that we studied.
The x-ray reflectivity at the two highest positive potentials cannot be fit if Eq. 2 is used to model the PMF for TPFB-. The simplest model that will produce the peaks in Fig. 3 is a single layer of TPFB- ions at the interface (note that a layer of Na+, whose concentration is also enhanced at the interface, cannot provide the x-ray contrast required to fit the data). The TPFB- layer is modeled by an attractive well in the PMF. is given by Eq. 2 plus a Gaussian function ] for along with a constant offset at to maintain continuity (see Fig.3). Analysis with a Lorentzian produced similar results.
The six parameters of [, , , , , ] along with the offset and the interfacial roughness ( ) are determined by fitting measured at V and 0.33 V, where the concentration of TPFB- is enhanced at the interface (Table LABEL:table1). This fitting is performed under the constraint that the resultant produces in agreement with the data over the entire range of potentials. In addition, fitted PMFs were rejected if the fit value of the roughness was unphysically small. In those cases an interfacial bending modulusSafran (1994) on the order of would have been required to reconcile the discrepancy of with its value predicted by capillary wave theoryLuo et al. (2006). In the case of the TPFB- PMF, two local minima in -space (denoted and ) were found to satisfy these conditions. Potential profiles that are intermediate between and do not satisfy these conditions. Most of these fits had values of within one standard deviation of capillary wave theory predictions using the measured potential-dependent interfacial tension.Luo et al. (2006, 2006). Fits to at V and 0.33 V had values of within two standard deviations of capillary wave theory.
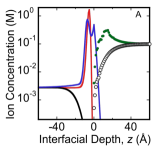
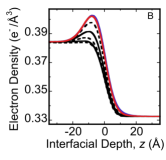
The PB-PMF model with the shown in Fig. 3 produces in good agreement with the data over the entire range of measured potentials (Fig. 2). The attractive wells for have comparable depths (6 for and 5 T for ), FWHM, and centers (Table 1). The ion concentration profiles , are calculated from Eq. 1 using . Figure 4 shows that the at the highest potential, V, take the form of two back-to-back double layers with a sharply defined layer of TPFB-. The different calculated from or differ mainly in the broadness of the profile, which in the case of returns to its bulk value at , while allows TPFB- to penetrate slightly more into the water phase. The electron density profiles calculated from the different are almost identical (Fig. 3), which demonstrates why our data cannot discriminate between and .
The maximum density of TPFB- near the interface occurs at V and is 1 nm2 per TPFB- ion when is used or 1.5 nm2 per TPFB- ion when is used. Both values represent a high-density layer for an ion of 1 nm diameter. Although dense ionic layers have been observed in the interfacial adsorption of charged amphiphiles, Leveiller et al. (1991) the absence of a dense TPFB- layer at indicates that TPFB- is, at most, weakly amphiphilic.
Simulations and supporting spectroscopy experiments indicate that highly polarizable ions (such as I- with a polarizability of 7.4Å3) are preferentially adsorbed to the water/vapor interface, though dense layers are not expected or observed.Winter and Faubel (2006); *Dang2002 We calculated the polarizability of TPFB- to be 42.9Å3.Frisch et al. ,333TPFB- geometry optimized at B3LYP/6-311++G(d,p) level with tightest constraints on convergence (opt=very tight, int=ultra fine). Resultant geometry agreed closely with crystal structure. Polarizability tensor calculated from optimized structure at the same level of theory. This large polarizability may play a role in forming a dense layer at high potentials. Also, Borukhov et al. suggested that the entropy of the solvent can stabilize large ion adsorption.Borukhov et al. (1997) Additional theoretical work is required to determine the relevance of these two effects for the data presented here.
The MD simulations of the potentials of mean force that we used for Na+ and Cl- do not account for ion-ion correlations, but they do include ion-solvent and solvent-solvent correlations. Such correlations also account for the monotonic form of . However, as a result of modeling the x-ray reflectivity, the phenomenological in Fig. 3 must implicitly account for ion-ion correlations if they are important for the observed condensation. The description of this monovalent ion condensation within PB-PMF theory illustrates the utility of this approach in describing ion-specific effects that are important for the behavior of ions in soft matter.
Acknowledgements.
MLS, PV and IB acknowledge support from NSF-CHE. NL acknowledges support from a UIC University Fellowship and the GAANN program. ChemMatCARS is supported by NSF-CHE, NSF-DMR, and the DOE-BES. The APS at Argonne National Laboratory is supported by the DOE-BES.References
- Gouy (1910) G. Gouy, “Constitution of the electric charge at the surface of an electrolyte,” J. Physique, 9, 457 (1910).
- Chapman (1913) D. L. Chapman, “A contribution to the theory of electrocapillarity,” Philos. Mag. Ser. 6, 25, 475 (1913).
- Stern (1924) O. Stern, Z. Elekt. Angew. Phys. Chem., 30, 508 (1924).
- Luo et al. (2006) G. Luo, S. Malkova, J. Yoon, D. G. Schultz, B. Lin, M. Meron, I. Benjamin, P. Vanysek, and M. L. Schlossman, “Ion distributions at the nitrobenzene-water interface electrified by a common ion,” J. Electroanal. Chem., 593, 142 (2006a).
- Luo et al. (2006) G. Luo, S. Malkova, J. Yoon, D. G. Schultz, B. Lin, M. Meron, I. Benjamin, P. Vanysek, and M. L. Schlossman, “Ion distributions near a liquid-liquid interface,” Science, 311, 216 (2006b).
- Lima et al. (2008) E. R. A. Lima, D. Horinek, R. R. Netz, E. C. Biscaia, F. w. Tavares, W. Kunz, and M. Bostrom, “Specific ion adsorption and surface forces in colloid science,” J. PHys. Chem. B, 112, 1580 (2008).
- Grosberg et al. (2002) A. Y. Grosberg, T. T. Nguyen, and B. I. Shklovskii, “The physics of charge inversion in chemical and biological systems,” Rev. Mod. Phys., 74, 329 (2002).
- Fermin et al. (1999) D. J. Fermin, H. D. Duong, Z. Ding, P.-F. Brevet, and H. H. Girault, “Photoinduced electron transfer at liquid/liquid interfaces part ii. a study of the electron transfer and recombination dynamics by intensity modulated photocurrent spectroscopy (imps),” Phys. Chem. Chem. Phys., 1, 1461 (1999).
- Raymond and Shedlovsky (1949) F. M. Raymond and T. Shedlovsky, “Extrapolation of conductance data for weak electrolytes,” J. Am. Chem. Soc., 71, 1496 (1949).
- Schmickler (1996) W. Schmickler, Interfacial Electrochemistry (Oxford University Press, Oxford, 1996).
- Schlossman et al. (1997) M. L. Schlossman, D. Synal, Y. Guan, M. Meron, G. Shea-McCarthy, Z. Huang, A. Acero, S. M. Williams, S. A. Rice, and P. J. Viccaro, “A synchrotron x-ray liquid surface spectrometer,” Rev. Sci. Instrum., 68, 4372 (1997).
- Zhang et al. (1999) Z. Zhang, D. M. Mitrinovic, S. M. Williams, Z. Huang, and M. L. Schlossman, “X-ray scattering from monolayers of f(cf2)10(ch2)2oh at the water-(hexane solution) and water-vapor interfaces,” J. Chem. Phys., 110, 7421 (1999).
- Wick and Dang (2008) C. D. Wick and L. X. Dang, “Recent advances in understanding transfer ions across aqueous interfaces,” Chem. Phys. Lett., 458, 1 (2008).
- Note (1) Gibbs energies of transfer: Na+ (57 kJ/mol), Cl- (53 kJ/mol), BTPPA+ (56 kJ/mol), TPFB- (72.5 kJ/mol), last two measured by partitioning via UV-visible spectroscopy and mass spectroscopy.
- Volkov and Deamer (1996) A. G. Volkov and D. W. Deamer, Liquid-Liquid Interfaces: Theory and Methods (CRC Press, Boca Raton, 1996).
- Marcus (1988) Y. Marcus, “Ionic radii in aqueous solutions,” Chemical Reviews, 88, 1475 (1988).
- Note (2) C.Zheng and P. Vanysek (unpublished).
- Horinek and Netz (2007) D. Horinek and R. R. Netz, “Specific ion adsorption at hydrophobic solid surfaces,” Phys. Rev. Lett., 99, 226104 (2007).
- Daikhin et al. (2001) L. I. Daikhin, A. A. Kornyshev, and M. Urbakh, “Ion penetration into an ’unfriendly medium’ and the double layer capacitance of the interface between two immiscible electrolytes,” J. Electroanal. Chem., 500, 461 (2001).
- Benjamin (2008) I. Benjamin, “Empirical valence bond model of an sn2 reaction in polar and nonpolar solvents,” J. Chem. Phys., 129 (2008).
- Safran (1994) S. A. Safran, Statistical Thermodynamics of Surfaces, Interfaces, and Membranes (Addison-Wesley Publishing Co., Reading, MA, 1994).
- Luo et al. (2006) G. Luo, S. Malkova, S. V. Pingali, D. G. Schultz, B. Lin, M. Meron, I. Benjamin, P. Vanysek, and M. L. Schlossman, “Structure of the interface between two polar liquids: Nitrobenzene and water,” J. Phys. Chem. B, 110, 4527 (2006c).
- Leveiller et al. (1991) F. Leveiller, D. Jacquemain, M. Lahav, L. Leiserowitz, M. Deutsch, K. Kjaer, and J. Als-Nielsen, “Crystallinity of the double layer of cadmium arachidate films at the water surface,” Science, 252, 1532 (1991).
- Winter and Faubel (2006) B. Winter and M. Faubel, “Photoemission from liquid aqueous solutions,” Chem. Rev., 106, 1176 (2006).
- Dang (2002) L. X. Dang, “Computational study of ion binding to the liquid interface of water,” J. Phys. Chem. B, 106, 10388 (2002).
- (26) M. J. Frisch, G. W. Trucks, H. B. Schlegel, et al., “Gaussian 03,” Gaussian,Inc. Wallingford,CT,2004.
- Note (3) TPFB- geometry optimized at B3LYP/6-311++G(d,p) level with tightest constraints on convergence (opt=very tight, int=ultra fine). Resultant geometry agreed closely with crystal structure. Polarizability tensor calculated from optimized structure at the same level of theory.
- Borukhov et al. (1997) I. Borukhov, D. Andelman, and H. Orland, “Steric effects in electrolytes: A modified poisson-boltzmann equation,” Phys. Rev. Lett., 79, 435 (1997).