2NRAO, PO Box O, Socorro, NM 87801, USA
3Raman Research Institute, CV Raman Ave, Sadashivanagar, Bangalore 560080, India
4Australia Telescope National Facility, PO Box 76, Epping 1710, NSW, Australia
5ASTRON, PO Box 2, 7990 AA, Dwingeloo, The Netherlands
Detection of the H92 Recombination Line from NGC 4945
Context. Hydrogen ionized by young, high-mass stars in starburst galaxies radiates radio recombination lines (RRLs), whose strength can be used as a diagnostic of the ionization rate, conditions and gas dynamics in the starburst region, without problems of dust obscuration. However, the lines are weak and only few extragalactic starburst systems have been detected.
Aims. We aimed to increase the number of known starburst systems with detectable RRLs for detailed studies, and we used the line properties to study the gas properties and dynamics.
Methods. We searched for the RRLs H91 and H92 with rest frequencies of 8.6 GHz and 8.3 GHz in the nearby southern Seyfert galaxy NGC 4945 using the Australia Telescope Compact Array with resolution of . This yielded a detection from which we derived conditions in the starburst regions.
Results. We detected RRLs from the nucleus of NGC 4945 with a peak line strength integrated over the source of mJy, making it the strongest extragalactic RRL emitter known at this frequency. The line and continuum emission from NGC 4945 can be matched by a model consisting of a collection of 10 to 300 H II regions with temperatures of 5 000 K, densities of cm-3 to cm-3 and a total effective diameter of 2 pc to 100 pc. The Lyman continuum production rate required to maintain the ionization is to , which requires 2 000 to 10 000 O5 stars to be produced in the starburst, inferring a star formation rate of 2 yr-1 to 8 yr-1. We resolved the rotation curve within the central 70 pc region and this is well described by a set of rotating rings that were coplanar and edge on. We found no reason to depart from a simple flat rotation curve. The rotation speed of 120 km s-1 within the central (19 pc) radius infers an enclosed mass of , and an average surface density with the central 19 pc of pc-2, which exceeds the threshold gas surface density for star formation.
Conclusion. We discovered RRLs from NGC 4945. It is the strongest known extragalactic RRL emitter and is suited to high-quality spectroscopic study. We resolved the dynamics of the ionized gas in the central 70 pc and derived conditions and star formation rates in the ionized gas.
Key Words.:
galaxies: individual: NGC 4945 - galaxies: nuclei - radio lines: galaxies1 Introduction
NGC 4945 is a nearby almost edge-on spiral galaxy at a distance of (3.8 0.3) Mpc (Karachentsev et al. (2007); implying a scale of 19 pc per arcsec). It has prominent dust lanes obscuring the nucleus, and is one of the brightest extragalactic sources seen by IRAS. The nuclear optical spectrum shows no sign of the Seyfert nucleus, and shows a purely starburst emission (Krabbe et al. (2001) and references therein). The presence of an active galactic nucleus (AGN) was finally settled when X-ray emission from a variable compact nuclear source was detected in the range 2 keV to 10 keV (Iwasawa et al. (1993)) with heavy absorption ( cm-2) typical of Seyfert 2 galaxies. The absorption was predicted to be much less at higher X-ray energies, and indeed at 100 keV Done et al. (1996) found it to be the second-brightest known Seyfert galaxy in the sky. X-ray imaging by Schurch et al. (2002) with X-ray Multi-Mirror-Newton and Chandra revealed a conical plume extending 500 pc NW which they interpret as a mass-loaded superwind driven by the starburst, and they found a 6.4 keV iron K line and a Compton reflection component, which are characteristic of AGNs.
A compact ( mas) radio core with high brightness temperature (107 K) detected by Sadler et al. (1995) at 2.3 GHz and 8.4 GHz indicates the presence of bright synchrotron emission, additional evidence for an AGN, though could possibly be radio supernovae. Mid-infrared spectroscopy was carried out with the Infrared Space Observatory by Spoon et al. (2000) to penetrate the dust obscuration, and they found no high excitation lines like [Ne V] that are common in AGNs, implying huge obscuration of assuming that a narrow-line region were present like that seen in, for example, the Circinus galaxy (which is similar in many ways to NGC 4945).
The nucleus is the source of abundant infrared and molecular emission, and optical emission line images show gas outflowing from the nucleus perpendicular to the galaxy plane. This activity originates from a composite starburst and AGN. An obscured nuclear starburst ring with diameter 50 pc is seen in Pa (Marconi et al. (2000)).
The molecular content of the NGC 4945 nucleus is rich and varied, producing the strongest known extragalactic molecular lines of many species. Over 80 transitions from 19 molecules have been found with single dishes, principally OH, H2O, CO, HCN, HCO+, CH3OH, but also many others with the Swedish-ESO-Submillimetre Telescope (SEST) and Parkes from 1.6 GHz to 354 GHz (Gardner & Whiteoak (1974), Whiteoak & Gardner (1974), Whiteoak et al. (1980), Whiteoak & Wilson (1990), Whiteoak & Gardner (1986), Dos Santos & Lépine (1979), Batchelor et al. (1982), Henkel et al. (1990), Henkel et al. (1994), Curran et al. (2001), Wang et al. (2004)). Many require densities of cm-3 for excitation and yield cloud temperatures of K. Wang et al. (2004) could determine isotope ratios of C, N, O, and S, and see isotope enrichment by ejecta from massive stars relative to that of fresh gas inflowing through a bar showing that the starburst is old enough to have affected the isotopic composition of the surrounding interstellar medium. Interferometric imaging of the HNC and HCO+ molecular distributions by Cunningham & Whiteoak (2005) with the Australia Telescope Compact Array (ATCA) showed rotation of the molecular disk in the central with rotation speed of 135 km s-1.
Imaging with very long baseline interferometry of the H2O masers by Greenhill et al. (1997) resolved the rotation curve over the central 40 milliarcsec (0.7 pc diameter) with a velocity range of 150 km s-1 inferring a central mass of . The rotation is in the same sense and in the same plane as the galaxy disk.
CO has been imaged at resolution from to with SEST by Dahlem et al. (1993), Ott et al. (2001), and Mauersberger et al. (1996), and interferometrically at with the Submillimeter Array (SMA) by Chou et al. (2007). All groups found the CO to be strongly concentrated towards the centre in a disk of molecular material (310 pc 210 pc). Chou et al. (2007) show that the disk rotates, within the central (95 pc) radius in the plane of the galaxy disk with simple rigid-body circular rotation. At larger radius the isovelocity contours show an ‘S’ shaped asymmetry due to a bar potential, and at the centre there is an unresolved kinematically decoupled component with a broad (340 km s-1) velocity range. They find that this last component is a good candidate for CO emission from the obscuring AGN torus, and too dense to be part of the starburst-driven molecular outflow.
The ionized gas phase has been imaged in H + N II, [O III], and Br by Moorwood & Oliva (1994), Moorwood et al. (1996) and Lípari et al. (1997) and in Pa by Marconi et al. (2000). The optical lines show a conical wind-blown cavity, and the infrared lines (Br and Pa) show a starburst disk at the base of the cavity extending over some and so are embedded within the molecular disk which extends to . Despite the cone resembling Seyfert ionization cones, it lacks [O III] emission and so that origin has been excluded. Spectra in H + N II show motions of km s-1 in the cone and optical line ratios typical of low-ionization nuclear emission-line region galaxies. Infrared spectra covering Br, Pf and shocked molecular hydrogen by Koornneef (1993), Moorwood & Oliva (1994), and Spoon et al. (2003) resolve the nuclear rotating disk over the central pc, showing a velocity range of 500 km s-1. The neutral hydrogen optical emission region is within the molecular hydrogen region, with shock excitation from a nuclear wind from the central cluster. The starburst seen in Br is powerful enough to supply the radiated in the infrared.
The ionized gas component can also be imaged using radio recombination lines (RRLs), which are not affected by extinction unlike at optical and near-infrared wavelengths. In this paper we describe RRL imaging of the nucleus of NGC 4945 in which we detect H92 emission and resolve the rotation curve. RRLs have been used to derive mass, density and ionizing photon fluxes for the ionized gas in other galaxies, from which star formation rates have been derived. The diagnostic methods are described by Anantharamaiah et al. (2000) and references therein, and in detail by Mohan (2002). The mere detection of RRL emission requires the presence of thousands of H II regions or of stimulated emission since a single H II region like the Orion nebula placed at that distance would be undetectably weak.
There are now 15 known extragalactic RRL detections (including NGC 4945), all in bright starburst galaxies, which are listed by Roy et al. (2008). Most of those detections resulted from improving the search sensitivity by a factor of ten during the 1990s and by making surveys of promising bright candidates using the Very Large Array (VLA) and ATCA. Our observation of NGC 4945 reported here was the third detection made in our ATCA survey for H92 emission. The other two detections from this survey (NGC 3256 and the Circinus galaxy) were reported by Roy et al. (2005) and Roy et al. (2008)). NGC 4945 has proven to be the strongest known extragalactic RRL emitter on the sky.
We give velocities in the heliocentric frame using the optical velocity definition throughout this paper.
2 Observations
We observed NGC 4945 with the ATCA simultaneously in the lines H91 and H92 with two orthogonal linear polarizations. The observing parameters and results are summarized in Table 1.
Calibration and imaging were done using the AIPS software using standard methods. The flux-density scale assumed that PKS B1934-638 had a flux density of 2.99 Jy at 8295 MHz and 2.87 Jy at 8570 MHz, based on the Baars et al. (1977) flux-density scale. A phase calibrator was observed every half hour to correct the instrumental phase response. A bandpass calibrator was observed every few hours for correcting the instrumental frequency response (bandpass). Phase corrections obtained from self calibration of the continuum source were applied to the spectral line data. Continuum emission was subtracted from the line data using the method UVLSF (Cornwell, Uson & Haddad (1992)) in which the continuum is determined for each baseline by a linear fit to the spectrum. The final continuum and line images were made using natural weighting of the data to achieve maximum possible signal-to-noise ratio.
Uncertainties on the flux densities have an 11 % rms random multiplicative component due to flux-density bootstrapping and atmospheric opacity, a 0.21 mJy rms random additive component due to thermal noise in a 1 MHz channel and a systematic multiplicative component of 11 % rms due mainly to the uncertainty in the Baars et al. flux-density scale.
| NGC 4945 | |
| Array configuration | 750D (1993jul25), 1.5D (1994sep21), 6C (94oct03) |
| Date of observation | 1993jul25, 1994sep21, 94oct03 |
| Integration time | 22.7 h |
| Transitions | H92 & H91 |
| of RRL | 8309.38 MHz & 8584.82 MHz |
| 8295.00 MHz & 8570.00 MHz | |
| 560 km s-1 (Paglione (1997)) | |
| Distance | 3.8 Mpc |
| Bandwidth, channels, IFs | 64 MHz, 64, 4 |
| Spectral resolution | 36 km s-1 |
| Minimum baseline | 0.86 k |
| Beam size (natural weight) | at -55∘ |
| Beam size (uniform weight) | at -4∘ |
| Phase calibrator (B1950) | 1320-446 |
| Bandpass calibrator (B1950) | 1226+023, 1320-446, 1934-638, 2251+158 |
| Line and Continuum Properties | |
| Peak continuum flux density | mJy beam-1 (natural weighting) |
| Total continuum flux density | mJy |
| Noise per image channel | 0.21 mJy beam-1 |
| Peak line flux density | mJy |
| Integrated line flux | W m-2 |
| Measured line width (FWHM) | km s-1 |
| Deconvolved line width (FWHM) | km s-1 |
| Centroid helio. optical vel. | km s-1 |
| No. of beam areas where line is observed | 1.5 (naturally weighted) |
3 Results
The ATCA continuum and line images, and integrated spectrum are shown in Fig. 1, and the velocity field and position-velocity diagram are shown in Fig. 2.


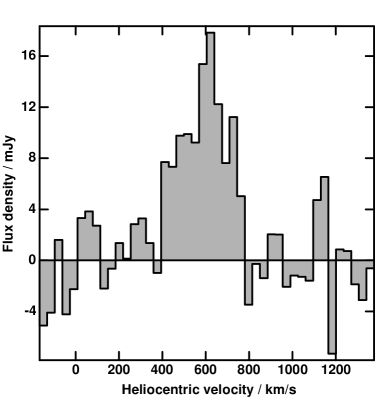
The continuum image shows a well resolved structure extended along the plane of the galaxy in position angle . Line emission was detected from the nuclear region with a well resolved structure that is extended along the plane of the galaxy like the continuum, though more compact and clumpy than the continuum emission. The line emitting region has a total deconvolved extent of (150 pc 30 pc). The peak of line emission is coincident with the peak of continuum emission within . The total area of line emission is 1.5 times the naturally-weighted beam area (8.6 times the uniformly-weighted beam area), or 4500 pc2. The H91 + H92 spectrum integrated over the line emitting region shows a strong line detection with significance of 52 , with centroid at 581 km s-1 in good agreement with the CO systemic velocity of 585 km s-1 (Chou et al. (2007)) and with the velocity of the HI absorption towards the nucleus of 585 km s-1, though significantly higher than the HI systemic velocity inferred from the whole galaxy of 557 km s-1 (Ott et al. (2001)). The line FWHM is 220 km s-1 after deconvolving the instrumental velocity resolution of 42 km s-1.

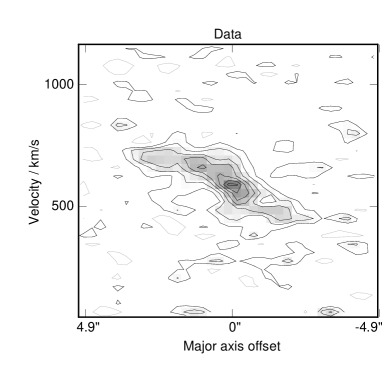
The position-velocity diagram (Fig. 2) shows a well resolved symmetric structure indicating undisturbed rotation with a flat rotation curve extending in close to the nucleus. The rotation curve is modelled in Sec 5.
4 Modelling Line Formation in the Ionized Gas
Two types of models have been considered for the RRL emission from the nuclei of external galaxies: one based on a uniform slab of ionized gas and the other based on a collection of compact H II regions. Such models have been discussed by Anantharamaiah et al. (2000) and references therein, and are documented in detail by Mohan (2002). These models take as constraints the integrated RRL strength at one or more frequencies, the radio continuum spectrum, and the geometry of the line emitting region.
For modelling the RRL emission from NGC 4945 we used the integrated line strength (17.8 mJy), line width (280 km s-1), size of the line-emitting region (equivalent to a 70 pc diameter sphere), continuum emission (1424 mJy), and spectral index (-0.75) to constrain conditions in the ionized gas. Using the collection of H II regions model, models with 10 to 300 H II regions, all with K, cm-3 to cm-3 and a total effective diameter of the line-emitting gas of 2 pc to 100 pc produced good matches to the line and continuum emission. Parameters derived for typical allowed models are given in Table 2.
| NGC 4945 | |
| Electron temperature | 5 000 K |
| Electron density | 1000 cm-3 to 10 000 cm-3 |
| Effective size a | 2 pc to 100 pc |
| Total ionized gas mass | (2 to 6) |
| s-1 to s-1 | |
| No. O5 stars | 2 000 to 10 000 |
a The total size, ie (total volume of all H II regions)1/3
The range of possible filling factors can be estimated by comparing the total volume of the line-emitting gas (8 pc3 to pc3 derived from the total effective diameter) to the volume of the line-emitting region ( pc3, assuming cylindrical geometry with diameter of 150 pc and height of 30 pc). The range of possible values is then to 1.
The inferred mass of ionized gas is to , depending on the model conditions, which requires a Lyman continuum flux of s-1 to s-1 to maintain the ionization. This flux is equivalent to the Lyman continuum output of 2000 to 10000 stars of type O5, which infers a star-formation rate of 2 yr-1 to 8 yr-1 when averaged over the lifetime of OB stars.
This can be compared to star formation rates derived from other indicators following Hopkins et al. (2003). Taking the peak 1.4 GHz flux density of 4.0 Jy beam-1 in the beam of the ATCA at the nucleus of NGC 4945 (Elmouttie et al. (1997)) yields a 1.4 GHz luminosity of W m-2 and a corresponding star formation rate of 3.9 yr-1. This can be attributed to the central (30 pc) diameter region following the argument of Elmouttie et al. (1997) based on the high resolution 8.4 GHz image. The IRAS m and m flux densities yield a far-infrared (FIR) star formation rate of 4.1 yr-1. These estimates agree well with the star formation rate estimated from the RRL emission of 2 yr-1 to 8 yr-1. The H and U-band-based star formation rates were not estimated due to the extreme absorption in the optical band. The supernova rate estimated by Forbes & Norris (1998) from the 4.8 GHz flux density is 0.23 yr-1, and from the [Fe II] flux is much lower at 0.005 yr-1. These can be converted into star-formation rates following Fukugita & Kawasaki (2003), yielding rates of 19 yr-1 and 0.4 yr-1. These bracket the range we estimated from the RRL emission.
Our RRL-based SFR estimate assumed no dust absorption between the OB stars and the H II regions producing the RRL emission. The effect of dust can be estimated by comparing the bolometric luminosity () from the stellar population needed to ionize the RRL-emitting gas to the observed FIR output () from the region. If ionizing photons are absorbed by dust before causing ionization, then will be less than . The ratio / thus gives the ratio of the number of photons absorbed by the gas to the number of photons absorbed by the dust. We derived by taking our RRL-based and dividing by the / ratio of 0.29 calculated for a stellar population with Salpeter IMF, lower-mass cutoff of and upper-mass cutoff of , and using the mass-luminosity relation for OB stars in Table 5 of Vacca et al. (1996). This resulted in to , compared to from region of (Brock et al. 1988). The ratio / shows that the gas volume in the nuclear region is illuminated by ionizing radiation that represents only 7.5 % to 35 % of the ionizing flux from the stars needed to power the FIR output; the rest, we assume, is absorbed by dust within the H II regions. Converting to opacity using Fig 2 of Petrosian (1972) yields dust opacities of 1.3 neper to 3.4 neper within the H II regions.
Given so much absorption, it is unexpected that the star-formation rate inferred from the RRL emission, which assumed zero absorption, should agree so well with that inferred from . An important assumption made while deriving the RRL-based star formation rate from the present inferred number of OB stars was that the stars are being formed at a steady rate that would maintain the present numbers.
5 Dynamical Modelling of the Ionized Gas
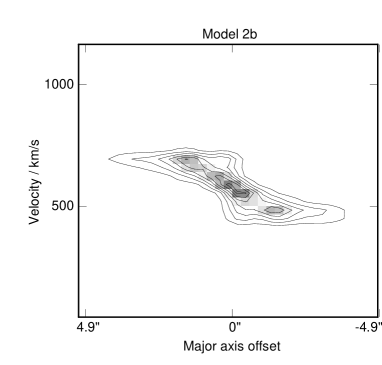
We used the rotation curve to constrain the gas kinematics by fitting to the data a simple model consisting of a set of rings, coplanar, edge-on, with an initially flat rotation curve. The brightness of each ring was determined by deprojecting the observed zeroth-moment image to derive the radial distribution of the line intensity. The radial distribution showed a central peak and a ring of emission (50 pc) from the nucleus.
We refined the model iteratively, varying the systemic velocity, rotation velocity, and velocity dispersion until we achieved a reasonably close match to the data, and found no reason to depart from a simple flat rotation curve. The biggest residual between the model and data was at the nucleus and a smaller one at the 50 pc ring. To improve the model, we refined the radial profile of line emission strength at the nucleus and the ring. The data required us to boost the central peak to 25 times the brightness of the more extended emission and to place that gas at the systemic velocity. This could correspond to gas on circular orbits moving transverse to the line of sight in front of the nucleus. The data also required us to put half that strength in the innermost ring (0.4” = 7.6 pc) with our best-fit rotation velocity. For the 50 pc ring, we tweaked the radius and brightness. The result was a very good match to the observed data, with residuals at 1.5 times the rms noise in the position-velocity diagram.
The final model had a flat rotation curve with km s-1, = 120 km s-1, and = 15 km s-1. We did not need to invoke a bar or radial motion, though the data do not strongly exclude either.
The rotation velocity of 120 km s-1 within the central (19 pc) radius infers an enclosed mass of . The water masers (Greenhill et al. (1997)) infer an enclosed mass of within 0.3 pc radius, and so most of the is extended between 0.3 pc and 19 pc radius of the nucleus. The average surface density within the central 19 pc is pc-2, which exceeds the threshold gas surface density for star-formation of (3 to 10) pc-2 (Kennicutt (1989)) by four orders of magnitude.
The 50 pc ring might be a Lindblad resonance, which would infer a bar and then our assumption of pure rotation would become invalid. The ring and nucleus may be seen also in CO spectra (Whiteoak & Wilson (1990), Dahlem et al. (1993)), and in OH absorption (Whiteoak & Wilson (1990)).
The RRL emission contains a bright peak on the nucleus at the systemic velocity. The continuum emission is smooth and does not show a similar peak and so we speculate that this might be stimulated emission along the line of sight for which the gas velocity is transverse to the line of sight and so has a long maser gain path.
6 Comparison with literature
H I kinematics were studied by Ott et al. (2001) with the ATCA at resolution. They saw HI in emission over the disk, with an extent of (43 kpc x 7.8 kpc) and in absorption towards the nuclear continuum emission. They see an asymmetry in the large-scale H I rotation field, which they argue is due to the bar potential. The H I absorption towards the nucleus shows a uniform velocity gradient across the nucleus indicating solid-body rotation peaking at km s-1 either side of the systemic velocity out to either side of the centre, with a sign of flattening beyond to . For comparison, our H91 + H92 rotation curve remained flat at km s-1 either side of systemic all the way into the central . This difference could be due to the two-times lower spatial resolution of the HI observation compared to that of the H91 + H92 observation ( compared to ). Were we to smooth our position-velocity diagram, or had the noise in our position-velocity diagram been a little higher, the small wings that indicate a flat rotation curve would be less visible, giving the impression of solid-body rotation. Also, in edge-on systems with a flat rotation curve, one finds the density distribution often gives the appearance of solid-body rotation.
Rotation of the larger-scale disk () derived from CO(1-0) observations with SEST by Dahlem et al. (1993) at resolution shows evidence for gas inflow that is consistent with the inflow model proposed by Ables et al. (1987) from H I. This was seen also in CO(2-1) by Ott et al. (2001) with SEST at resolution. However, inflow was not seen in the H91 + H92 dynamics within of the nucleus.
Isovelocity contours of CO by Chou et al. (2007) show an S-shaped asymmetry due to a bar potential at distances larger than from the nucleus, and show simple circular rotation within that radius. The isovelocity contours of the H91 + H92 radio recombination line from the ionized gas component seen within radius of the nucleus likewise shows simple circular rotation with no asymmetry, consistent with the CO on that scale.
The rotation of the nuclear disk derived from CO(3-2) observations with SEST by Mauersberger et al. (1996) with resolution and with SMA by Chou et al. (2007) at resolution show that within of the nucleus, the velocity changes from 390 km s-1 to 730 km s-1, which is broader than the velocity range of the H91 + H92 emission (460 km s-1 to 700 km s-1) over the same region.
The CO emission seen by both Mauersberger et al. (1996) and Chou et al. (2007) shows two local intensity peaks, with a radius of to from the nucleus. The H91 + H92 line emission radial distribution showed a central peak and a ring of emission with radius (50 pc) from the nucleus. Thus, the ring in ionized gas lies within the ring in the molecular gas, consistent with the illustration by Spoon et al. (2003) Fig. 8.
The dynamical mass within the central 100 pc radius derived from the CO by Mauersberger et al. (1996) is and the dynamical mass within 0.3 pc radius derived from the water masers by Greenhill et al. (1997) is . The dynamical mass enclosed within the central (19 pc) radius derived from the H91 + H92 line is , which lies between the masses within the larger and smaller radii, as expected.
Rotation of the nuclear ionized gas is traced also by Pf by Spoon et al. (2003). They find ionized gas within the central around the nucleus from the same region in which we find H91 + H92 emission. Comparing their position-velocity diagram of Pf (their Fig. 7) to our position-velocity diagram of H91 + H92 (our Fig. 2), the diagrams look essentially the same, having the same central velocity gradient, the same rotation rate, the same systemic velocity, and the same overall extent. Thus, both emission lines are tracing the same gas, as expected. Spoon et al. (2003) propose a geometry in which the HI Pf originates from the central ionized and rotating disk (their Fig. 8). The H91 + H92 kinematics supports this picture. Similar rotation curves are seen in HCN, HNC, and HCO+ by Cunningham & Whiteoak (2005), though the molecular material is seen more strongly concentrated into an edge-on ring with weak emission or absorption towards the nucleus, unlike the ionized gas which is always in emission.
Chou et al. (2007) identify a kinematically decoupled component in their CO position-velocity diagrams along the minor axis, showing broad velocity width at or near the disk centre, as a strip in velocity at the origin of the position-velocity diagram spanning 400 km s-1 to 750 km s-1 in their Fig. 5. They identify this gas as a promising candidate for the circumnuclear molecular torus invoked by AGN unification models. For comparison, we show the position-velocity diagram in H91 + H92 along the minor axis in Fig. 3. The H91 + H92 shows a broad velocity range at the position of the nucleus (panel 252), spanning 430 km s-1 to 750 km s-1, similar to that seen in CO by Chou et al. (2007). This broad velocity width in the centre of our position-velocity diagram along the minor axis underlines that the rotation curve is flat; at this position close to the centre, one sees the full receding and the full approaching velocities, which can be the case only if the rotation curve rises very quickly in the central beam and stays flat further out, as seen the other panels of Fig 3. The gas with broad velocity width at the nucleus was included when we fit the kinematics and we obtained a good fit with a simple flat rotation curve extending into the central ring; we did not need to introduce any departure from the simple flat-rotation-curve model.

7 Conclusions
We have discovered H91 + H92 lines in emission in NGC 4945 with flux density of 17.8 mJy using the ATCA, making NGC 4945 the brightest known extragalactic RRL source. The detected line strength infers an ionized gas mass of (2 to 6) and a corresponding star formation rate of 2 yr-1 to 8 yr-1 depending on the model conditions. The star formation rate estimated from the RRL detection in NGC 4945 agrees well with rates estimated from radio and FIR luminosities using previously-calibrated relations.
The rotation curve was found to be flat into the central 1” with km s-1, = 120 km s-1. We found no need to invoke a bar or radial motion and no indication of a kinematically decoupled component.
Future observations at high frequencies where RRLs are stronger and resolution is higher will provide measurements of multiple transitions to provide better constraints on the gas conditions.
Since RRLs occur over a wide range of wavelengths, a given array can provide higher resolution for studying the dynamics of ionized gas than can be achieved for studies of neutral hydrogen.
Followup with the Atacama Large Millimeter/submillimeter Array of RRLs in NGC 4945 and others should be rewarding, giving good SNR and high spatial resolution to see finer details in the kinematics and of the possible circumnuclear torus.
Acknowledgements.
The Australia Telescope Compact Array is part of the Australia Telescope, which is funded by the Commonwealth of Australia for operation as a National Facility managed by CSIRO. The National Radio Astronomy Observatory is a facility of the National Science Foundation operated under cooperative agreement by Associated Universities, Inc.References
- Ables et al. (1987) Ables, J. G., Forster, J. R., Manchester, R. N., Rayner, P. T., Whiteoak, J. B., Mathewson, D. S., Kalnajs, A. J., Peters, W. L., & Wehner, H. 1987, MNRAS, 226, 157
- Anantharamaiah et al. (2000) Anantharamaiah, K. R., Viallefond, F., Mohan, N. R., Goss, W. M., & Zhao, J. H. 2000, ApJ, 537, 613
- Baars et al. (1977) Baars J. W. M., Genzel, R., Pauliny-Toth, I. I. K., Witzel, A. 1977, A&A, 61, 99
- Batchelor et al. (1982) Batchelor, R. A., Jauncey, D. L., & Whiteoak, J. B. 1982, MNRAS, 200, 19P
- Chou et al. (2007) Chou, R. C. Y., Peck, A. B., Lim, J., Matsushita, S., Muller, S., Sawada-Satoh, S., Dinh-V-Trung, Boone, F., & Henkel, C. 2007, ApJ, 670, 116
- Cornwell, Uson & Haddad (1992) Cornwell, T. J., Uson, J. M. & Haddad, N. 1992, A&A, 258, 583
- Cunningham & Whiteoak (2005) Cunningham, M. R., & Whiteoak, J. B. 2005, MNRAS, 364, 37
- Curran et al. (2001) Curran, S. J., Johansson, L. E. B., Bergman, P., Heikkilä, A., & Aalto, S. 2001, A&A, 367, 457
- Dahlem et al. (1993) Dahlem, M., Golla, G., Whiteoak, J. B., Wielebinski, R., Hüttemeister, S. & Henkel, C. 1993, A&A, 270, 29
- Done et al. (1996) Done, C., Madejski, G. M. & Smith, D. A. 1996, ApJ, 463, L63
- Dos Santos & Lépine (1979) Dos Santos, P. M., & Lépine, J. R. D. 1979, Nature, 278, 34
- Elmouttie et al. (1997) Elmouttie, M., Haynes, R. F., & Jones, K. L., Ehle, M., Beck, R., Harnett, J. I., & Wielebinski, R. 1997, MNRAS, 284, 830
- Forbes & Norris (1998) Forbes, D. A., & Norris, R. P. 1998, MNRAS, 300, 757
- Fukugita & Kawasaki (2003) Fukugita, M., & Kawasaki, M. 2003, MNRAS, 340, L7
- Gardner & Whiteoak (1974) Gardner, F. F., & Whiteoak, J. B. 1974, Nature, 247, 526
- Greenhill et al. (1997) Greenhill, L. J., Moran, J. M. & Herrnstein, J. R. 1997, ApJ, 481, L23
- Henkel et al. (1990) Henkel, C., Whiteoak, J. B., Nyman, L.-Å., & Harju, J. 1990, A&A, 230, L5
- Henkel et al. (1994) Henkel, C., Whiteoak, J. B., & Mauersberger, R. 1994, A&A, 284, 17
- Hopkins et al. (2003) Hopkins, A. M., Miller, C. J., Nichol, R. C., Connolly, A. J., Bernardi, M., Gómez, P. L., Goto, T., Tremonti, C. A., Brinkmann, J., Ivezić, Ź., & Lamb, D. Q. 2003, ApJ, 599, 971
- Iwasawa et al. (1993) Iwasawa, K., Koyama, K., Awaki, H., Hunieda, H., Makishima, K., Tsuru, T., Ohashi, T., & Nakai, N. 1993, ApJ, 409, 155
- Karachentsev et al. (2007) Karachentsev, I. D., Tully, R. B., Dolphin, A., Sharina, M., Makarova, L., Makarov, D., Sakai, S., Shaya, E. J., Kashibadze, O. G., Karachentseva, V., & Rizzi, L. 2007, AJ, 133, 504
- Kennicutt (1989) Kennicutt, R. C. 1989, ApJ, 344, 685
- Koornneef (1993) Koornneef, J. 1993, ApJ, 403, 581
- Krabbe et al. (2001) Krabbe, A., Böker, T., & Maiolino, R. 2001, ApJ, 557, 626
- Lípari et al. (1997) Lípari, S., Tsvetanov, Z., & Macchetto, F. 1997, ApJS, 111, 369
- Marconi et al. (2000) Marconi, A., Oliva, E., van der Werf, P. P., Maiolino, R., Schreier, E. J., Macchetto, F., & Moorwood A. F. M. 2000, A&A, 357, 24
- Mauersberger et al. (1996) Mauersberger, R., Henkel, C., Whiteoak, J. B., Chin, Y.-N., & Tieftrunk, A. R. 1996, A&A, 309, 705
- Mohan (2002) Mohan, Niruj R. 2002, PhD Thesis, IISc, Bangalore, India
- Moorwood & Oliva (1994) Moorwood, A. F. M., & Oliva, E. 1994, ApJ, 429, 602
- Moorwood et al. (1996) Moorwood, A. F. M., van der Werf, P. P., Kotilainen, J. K., Marconi, A., & Oliva, E. 1996, A&A, 308, L1
- Ott et al. (2001) Ott, M., Whiteoak, J. B., Henkel, C., & Wielebinski, R. 2001, A&A, 372, 463
- Paglione (1997) Paglione, T. A. D., Jackson, J. M., Ishizuki, S. 1997, ApJ, 484, 656
- Petrosian (1972) Petrosian, V. Silk, J. & Field, G. B. 1972, ApJ, 177, L69
- Roy et al. (2005) Roy, A. L., Goss, W. M., Mohan, Niruj R., Anantharamaiah, K. R. 2005, A&A, 435, 831
- Roy et al. (2008) Roy, A. L., Goss, W. M., Anantharamaiah, K. R. 2008, A&A, 483, 79
- Sadler et al. (1995) Sadler, E. M., Slee, O. B., Reynolds, J. E., & Roy, A. L. 1995, MNRAS, 276, 1373
- Schurch et al. (2002) Schurch, N. J., Roberts, T. P., & Warwick, R. S. 2002, MNRAS, 335, 241
- Spoon et al. (2000) Spoon, H. W. W., Koornneef, J., Moorwood, A. F. M., Lutz, D., & Tielens, A. G. G. M. 2000, A&A, 357, 898
- Spoon et al. (2003) Spoon, H. W. W., Moorwood, A. F. M., Pontoppidan, K. M., Cami, J., Kregel, M., Lutz, D., & Tielens, A. G. G. M. 2003, A&A, 402, 499
- Vacca et al. (1996) Vacca, W. D., Garmany, C. D., & Shull, J. M. 1996, ApJ, 460, 914
- Wang et al. (2004) Wang, M., Henkel, C., Chin, Y. -N., Whiteoak, J. B., Hunt Cunningham, M., Mauersberger, R., & Muders, D. 2004, A&A, 422, 883
- Whiteoak & Gardner (1974) Whiteoak, J. B., & Gardner, F. F. 1974, ApL, 15, 211
- Whiteoak & Gardner (1986) Whiteoak, J. B. & Gardner, F. F. 1986, MNRAS, 222, 513
- Whiteoak et al. (1980) Whiteoak, J. B., Gardner, F. F., & Hoglund, B. 1980, MNRAS, 190, 17P
- Whiteoak & Wilson (1990) Whiteoak, J. B., & Wilson, W. E. 1990, MNRAS, 245, 665