Influence of rotational force fields on the determination of the work done on a driven Brownian particle
Abstract
For a Brownian system the evolution of thermodynamic quantities is a stochastic process. In particular, the work performed on a driven colloidal particle held in an optical trap changes for each realization of the experimental manipulation, even though the manipulation protocol remains unchanged. Nevertheless, the work distribution is governed by established laws. Here, we show how the measurement of the work distribution is influenced by the presence of rotational, i.e. nonconservative, radiation forces. Experiments on particles of different materials show that the rotational radiation forces, and therefore their effect on the work distributions, increase with the particle refractive index.
pacs:
87.80.Cc, 82.70.Dd, 05.40.JcKeywords: Optical tweezers, rotational radiation force, nonconservative force field, thermodynamics work distribution
1 Introduction
Most physical, chemical and biological phenomena present intrinsic degrees of randomness. Such randomness can be treated within the framework of statistical physics and thermodynamics. Equilibrium thermodynamics, in particular, is a mature discipline with well-established laws [1, 2]. However, most natural and engineered processes occur far from equilibrium, e.g., biomolecular reactions in molecular machines [3], oscillations of pumped mesoscopic chemical reaction systems [4] and fast switching between phonon distributions in optical cavities [5]. Such processes cannot be treated within the framework of classical equilibrium thermodynamics. This fact has motivated an intense activity during the last years aiming at extending the results of thermodynamics to out-of-equilibrium systems [6, 7, 8, 9, 10, 11, 12, 13, 14, 15, 16].
In this context, the study of thermodynamic quantities in microscopic systems, such as biomolecules and nanomachines, has posed new challenges due to the ineluctable presence of a Brownian noise background, which prevents one from straightforwardly scaling down the approaches employed on macroscopic systems. For example, the presence of Brownian noise alters the measurement of forces acting on microscopic objects, leading to artifacts if not correctly taken into account [17]. Also the evolution of thermodynamics quantities, e.g., work and entropy, although deterministic in macroscopic systems, becomes stochastic in the microscopic realm. Indeed, a different value is measured in each experimental realization; even phenomena that are forbidden in a macroscopic systems become possible at a microscopic level, e.g., entropy-decreasing trajectories [18, 19]. Nevertheless, the probability distributions of these thermodynamics quantities obey some deterministic laws [19, 20, 21, 22, 23].
Optically trapped particles [24] have emerged as a powerful model system to address experimentally novel concepts in the context of statistical physics in a convenient way relying both on the presence of a natural noisy background and on a finely controllable deterministic optical force field [25]. Indeed, a colloidal particle, i.e. a microscopic particle suspended in a fluid, is set in constant movement by the presence of thermal fluctuations, which are responsible for its diffusion and introduce a well-defined noisy background. Furthermore, it is possible to make use of optical forces to introduce deterministic perturbations acting on the particle in a controllable way. For example, optically trapped particles have been used to study experimentally many non-trivial, sometimes constructive, aspects of the presence of noise, e.g., stochastic resonance [26], stochastic activation [27], Brownian ratchets [28], or stochastic resonant damping [29].
An implicit assumption in these studies is that the optical trap acts as a harmonic potential, i.e. the restoring optical force is proportional to the particle displacement from the trap center. This entails that the optical force field should be conservative, excluding the possibility of a rotational component. This is actually true to a great extent in the -plane perpendicular to the beam propagation direction, at least for a standard optical trap generated by a Gaussian beam. However, due to the presence of the scattering force, this has been shown not to be true in a plane parallel to the beam propagation, e.g., -plane [30, 31, 32, 33]. For most experimental situations the nonconservative effects are effectively negligible, becoming significant only when the particle is allowed to explore a large region of the optical field [33]. This typically occurs for extremely low-power trapping, far away from the trapping regimes usually used in experiments, or for particles driven out-of-equilibrium.
In this article, we show paradigmatically how the determination of a thermodynamic quantity, namely the work, is affected by the presence of a rotational, i.e. nonconservative, force field. We measure the work performed by a fluid flow on three optically trapped colloidal particles of comparable dimension, but different refractive index. For a larger refractive index, the rotational optical force field component increases and, therefore, introduces larger artifacts into the measured work distributions.
2 Experimental setup
The experimental setup consists of an optical tweezers build on a home-made optical microscope with a high-numerical-aperture water-immersion objective lens (Olympus, UPLAPO60XW3, NA=1.2); the optical trap is generated by a frequency and amplitude stabilized Nd-YAG laser (, maximum output power, Innolight Mephisto)[34].
We use colloidal spheres of comparable diameter, i.e. , of three different material – silica (Si), polystyrene (Ps) and melamine (Me). The main parameters of the experimental setup and of the beads used in this experiment are reported in table 1. The particles are diluted in distilled deionized water to a final concentration of a few particles/. The sample cell is made with a -thick coverslip and a microscope slide, which are separated by a -thick Parafilm spacer and sealed with vacuum grease to prevent evaporation and contamination. Such sample cell is mounted on a closed-loop piezoelectric stage (Physik Instrumente PI-517.3CL), which allows movements with nanometer resolution. Obviously, a movement of the stage in a given direction corresponds to a movement the optical trap focus in the opposite direction from the perspective of the trapped particle. The sample temperature is continuously monitored using a calibrated NTC thermistor positioned on the top surface of the microscope slide and remained constant within during each set of measurements.
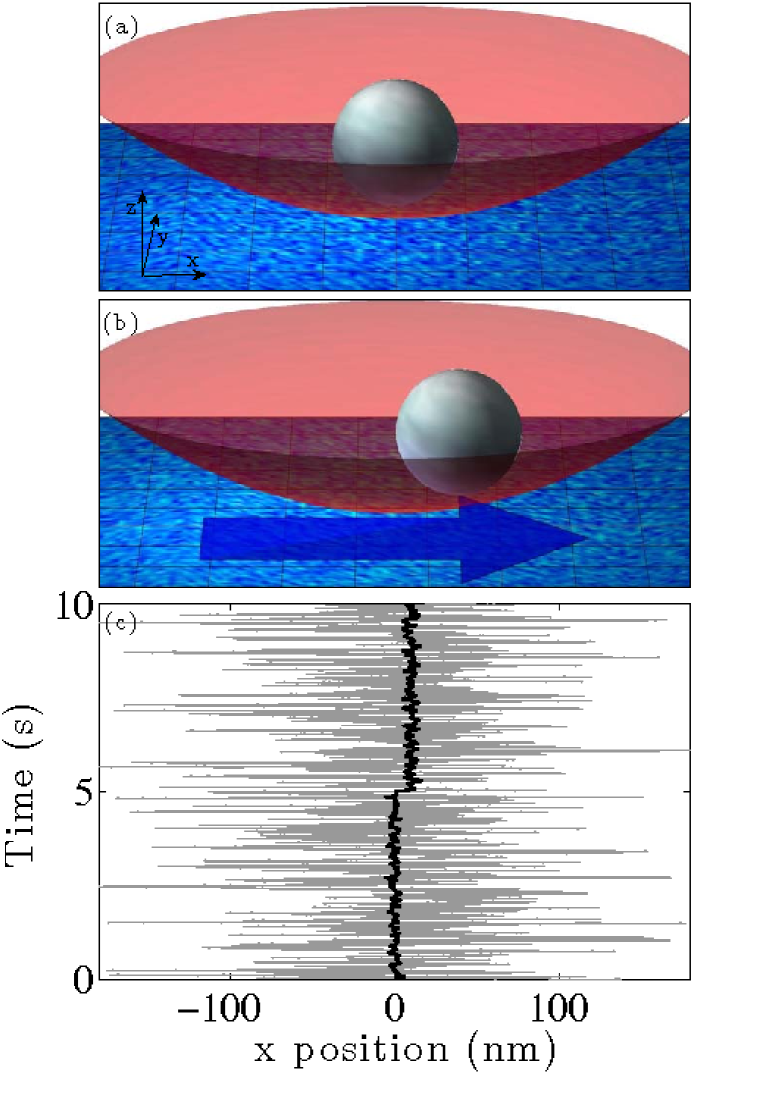
A colloidal sphere is trapped and positioned in the middle of the sample cell, i.e. far away from the surfaces to avoid spurious effects arising from diffusion gradients [17, 35]. Its , and coordinates (figure 1(a)) are monitored through the forward scattered light imaged at the back focal plane of the condenser lens on a InGaAs Quadrant Photodiode (QPD, Hamamatsu G6849) [36, 37]. A digital oscilloscope (Tektronix TDS5034B) is used for data-acquisition. The QPD-response is linear for displacements up to ( resolution, bandwidth). The conversion factor from voltage to distance is calibrated using the power spectral density (PSD) method [35].
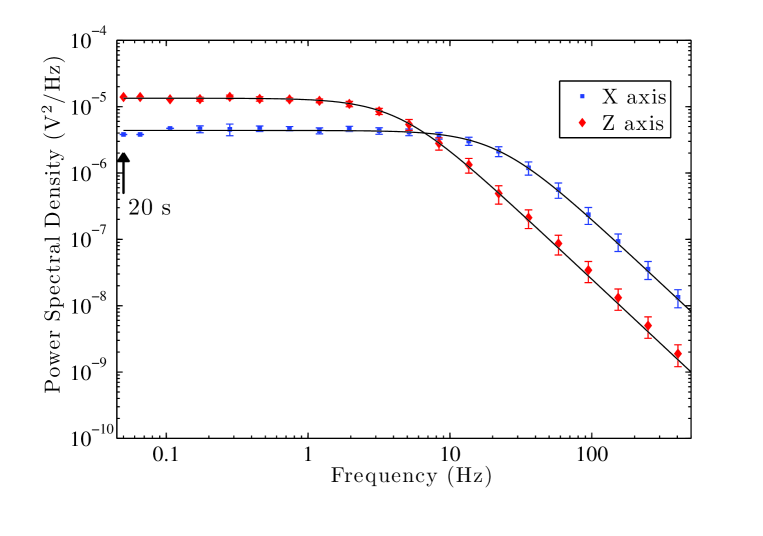
To minimize external noise, the experimental setup is mounted on a passive vibration isolation optical table. Moreover, the laser paths are kept as short as possible to avoid pointing fluctuations and the laser beam is enclosed in plastic pipes wherever possible. Finally, all the setup is enclosed by a polystyrene box to prevent air circulation and temperature drifts. In order to check the achieved stability, in figure 2 the PSD for the (blue squares) and (red diamonds) coordinates are presented for the Ps particle. They fit well the expected theoretical curves (lines) in the range between and . In particular the PSDs show a very flat plateau up to the minimum frequency measured which corresponds to a period of . This allows us to exclude the presence of low frequency noise, since, as described above, each single measurement is performed within .
| Silica | Polystyrene | Melamine | |
|---|---|---|---|
| diameter () | 0.970.01 | 0.990.02 | 1.000.02 |
| refractive index | 1.37 | 1.59 | 1.68 |
| density () | 1.96 | 1.06 | 1.51 |
| () | 1.380.09 | 1.170.07 | 0.840.08 |
| () | 0.260.01 | 0.270.01 | 0.270.01 |
| 0.190.01 | 0.230.01 | 0.320.01 | |
| (%) | – | 2.20.1 | 6.20.2 |
| laser power () |
3 Manipulation protocol
The duration of each trajectory measurement is (figure 1(c)). During the first 5 seconds the stage is at rest and the particle is in an equilibrium state in the optical potential well, (figure 1(a)), where is the radial position of the Brownian particle with respect to the center of the trap, i.e. , and is the radial stiffness of the optical trap, assumed to be harmonic. At the stage starts moving at a speed along the coordinate (figure 1(b)), producing an effective fluid flow and an effective force acting on the particle, where is the particle friction coefficient. Hence, the manipulation protocol is
| (1) |
After a pause of the above described sequence starts again, but the stage is moved in the opposite direction. This allows us to remain in the same region on the sample cell avoiding systematic drifts. By repeating this procedure 400 times, we acquire 800 trajectories for each particle.
During the application of the force, the average trajectory of the particle (black solid line in figure 1(c)) climbs the optical potential; however, due to the overwhelming presence of the Brownian motion, each realization (e.g., gray solid line in figure 1(c)) presents a random behavior.
Assuming a harmonic trapping potential, as the stage moves with constant velocity along the direction, the work done on the Brownian particle reads [19]
| (2) |
corresponding to the classical expression “displacement times force,” where is the infinitesimal displacement of the center of the potential and is the force acting on the particle with the trap stiffness along the direction.
In the case of an ideal Gaussian trap, the work probability distribution is given by [21, 19]
| (3) |
which is a Gaussian whose mean and variance depend on time, i.e. and with the relaxation time in the optical trap, the temperature and the Boltzmann constant. As will be shown, a deviation from a harmonic trap, leads to deviations from such work distribution. Thus, in the presence of nonconservative optical forces, we expect the experimental probability distribution function of the work to deviate from eq. 3.
4 Work measurement on driven Brownian particles
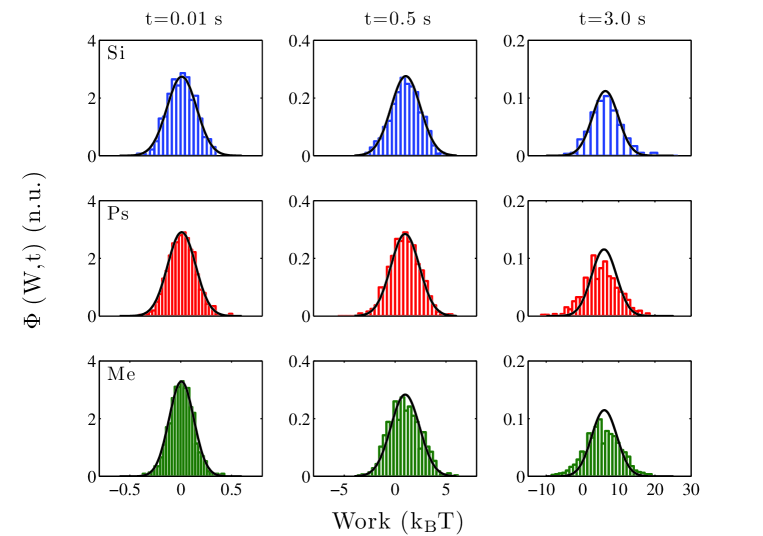
From the measured trajectories we calculated the work performed by the fluid flow on a Brownian particle according to eq. 2. The results are plotted as histograms in figure 3 for Si (first row), Ps (second row) and Me (third row) particles and for (first column), (second column) and (third column). The theoretical expectation for a conservative force field according to eq. 2 are plotted as solid lines. For , the work performed on all particles is in good agreement with the theoretical expectation. However, for larger times only the data relative to the Si particle keep on being in agreement, while deviations arise for the data on Ps and Me particles.
5 Influence of rotational force fields
In order to understand such disagreement, we consider the deviation of the optical force field from the harmonic one assumed in eq. 2. Indeed, in the case of optical trapping powers as small as the ones we employ, the optical force field can be better approximated allowing for a rotational component in the vertical plane [33].
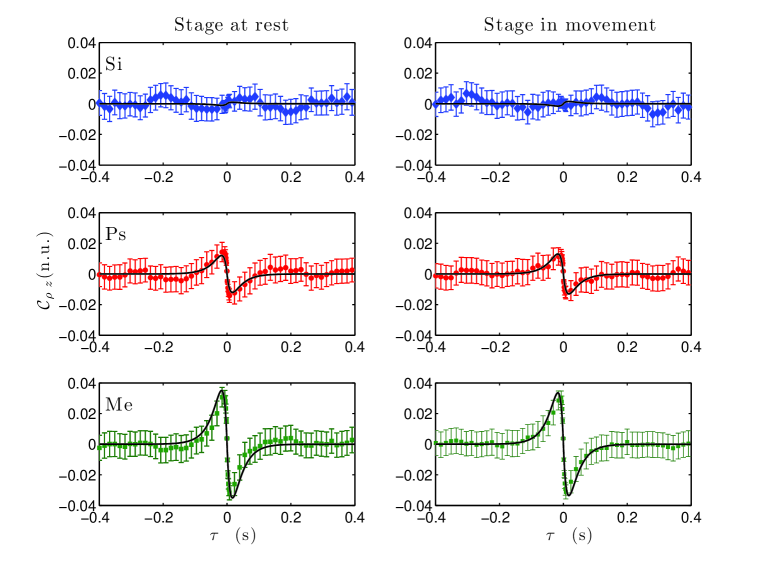
A generic force field can be characterized by measuring the auto-correlation and cross-correlation functions between the coordinates of the particle [38, 39, 40]. In particular, here in order to characterize the rotational optical forces, we use the cross correlation difference between and [33]
| (4) |
where is the average relaxation time in the trap, the relaxation time along the -direction, the stiffness along the -direction and the relative contribution of the nonconservative force fields. is clear evidence that the contribution of the nonconservative force field component is effectively negligible.
In figure 4 the experimental is presented for the case of a Si (blue), Ps (red) and Me (green) optically trapped Brownian particle without fluid flow. While the rotational component is negligible for the case of a Si particle, it becomes significant for the cases of Ps and, even more, for the case of a Me particle. Summarizing, the rotational component appears to increase with the refractive index of the particle. The same results are obtained in the presence of a fluid flow.
The presence of a larger rotational component of the force field appears to be in direct relation to the deterioration of the agreement between theory and experiments in the determination of the work done by the fluid flow on the Brownian particle. This can be understood in a qualitative way. In the presence of a harmonic trapping potential, the particle movement along , and are independent. For example, assuming the particle to be at the protocol acts on the particle trajectory independently from the value of . However, if there is a rotational component of the force field, a particle will undergo the effect of both the protocol and the rotational force field, which, e.g., may result in a longer displacement for and in a shorter one for . Clearly, this effect becomes evident only for times long enough for the effect of the rotational component to be significant. This explains the widening of the experimental work distribution in the case of Ps and Me particles for long times (figure 3).
In principle, the partial differential equation ruling the time evolution of the probability distribution function of the work could be obtained also in the presence of nonconservative forces following the procedure outlined in [19]. However, while such an equation can be explicitly solved in the case of a harmonic potential, leading to eq. (3), this is not as easy for the case of nonconservative forces, because it involves a nonlinear problem. The discrepancy between the experimental data and the theoretical prediction eq. (3) observed in figure 3 can thus be attributed to the fact that eq. (2), and thus eq. (3), only takes into account the contribution of the conservative forces to the work.
6 Conclusions and outlook
We have shown how the presence of rotational radiation forces due to a weak optical trap affects the measurement of the work distributions on a driven particle. As we had already observed in [33], the rotational radiation forces become significative only for a very low trapping power, i.e. below . This is the regime in which various experiments to test thermodynamics relations on colloidal systems have been performed [18, 19]. We have now shown how such spurious effects increase with an increasing refractive index difference between the particle and the medium and that they become undetectable in the case of a Si particle trapped in water even for an extremely low trapping power. These observations will prove useful to minimize the influence of rotational force fields in future experiments.
References
- [1] J. W. Gibbs. Elementary principles of statistical mechanics. Yale University Press, New Haven, 1902.
- [2] H. B. Callen. Thermodynamics and an introduction to thermostatistics. John Wiley & Sons, Inc., New York, 2nd edition, 1985.
- [3] H. Wang and G. Oster. Energy transduction in the motor of ATP synthase. Nature, 396:279–282, 1998.
- [4] H. Qian, S. Saffarian, and E. L. Elson. Concentration fluctuations in a mesoscopic oscillating chemical reaction system. Proc. Natl. Acad. Sci. USA, 99:10376–10381, 2002.
- [5] W. W. Chow, H. C. Scheider, S. W. Koch, C. Chang, L. Chrostowski, and C. J. Chang-Hasnian. Nonequilibrium model for semiconductor laser modulation response. IEEE J. Quantum Electron., 38:402–409, 2002.
- [6] S. R. de Groot and P. Mazur. Non-equilibrium thermodynamics. North-Holland Publishing Co., Amsterdam, 1984.
- [7] D. J. Evans, E. D. G. Cohen, and G. P. Morris. Probability of second law violations in nonequilibrium steady states. Phys. Rev. Lett., 71:2401–2404, 1993.
- [8] C. Jarzynski. Nonequilibrium equality for free energy differences. Phys. Rev. Lett., 78:2690–2693, 1997.
- [9] G. Crooks. Nonequilibrium measurement of free energy differences for microscopically reversible markovian systems. J. Stat. Phys., 90:1481–1487, 1998.
- [10] G. Hummer and A. Szabo. Free energy reconstruction from nonequilibrium single-molecule pulling experiments. Proc. Natl. Acad. Sci. USA, 98:3658–3661, 2001.
- [11] D. Reguera, J. M. Rubi, and J. M. G. Vilar. The mesoscopic dynamics of thermodynamic systems. J. Phys. Chem. B, 109:21502–21515, 2005.
- [12] A. Imparato and L. Peliti. Work-probability distribution in systems driven out of equilibrium. Phys. Rev. E, 72:046114, 2005.
- [13] A. Imparato and L. Peliti. Work distribution and path integrals in general mean-field systems. Europhys. Lett., 70:740–746, 2005.
- [14] A. Imparato and L. Peliti. Fluctuation relations for a driven brownian particle. Phys. Rev. E, 74:026106, 2006.
- [15] A. Imparato and L. Peliti. The distribution function of entropy flow in stochastic systems. J. Stat. Mech., (L02001), 2007.
- [16] S. Kjelstrup and D. Bedeaux. Non-equilibrium thermodynamics of heterogeneous systems. World Scientific Publishing, Singapore, 2008.
- [17] G. Volpe, L. Helden, T. Brettschneider, J. Wehr, and C. Bechinger. Influence of noise on force measurements. Phys. Rev. Lett., 104:170602, 2010.
- [18] G. M. Wang, E. M. Sevick, E. Mittag, D. J. Searles, and D. J. Evans. Experimental demonstration of violations of the second law of thermodynamics for small systems and short time scales. Phys. Rev. Lett., 89:050601, 2002.
- [19] A. Imparato, L. Peliti, G. Pesce, G. Rusciano, and A. Sasso. Work and heat probability distribution of an optically driven brownian particle: Theory and experiments. Phys. Rev. E, 76:050101, 2007.
- [20] A. Mazonka and C. Jarzynski. Exactly solvable model illustrating far-from-equilibrium predictions. cond-mat/9912121, 1999.
- [21] T. Speck and U. Seifert. Dissipated work in driven harmonic diffusive systems: general solution and application to stretching rouse polymers. Eur. Phys. J. B, 43:521–527, 2005.
- [22] R. van Zon and E. G. D. Cohen. Extended heat-fluctuation theorems for a system with deterministic and stochastic forces. Phys. Rev. E, 69:056121, 2004.
- [23] T. Taniguchi and E. G. D. Cohen. Onsager-machlup theory for nonequilibrium steady states and fluctuation theorems. Journal of Statistical Physics, 126:1–41, 2007.
- [24] A. Ashkin. Optical trapping and manipulation of neutral particles using lasers. Proc. Natl. Acad. Sci. USA, 94:4853–4860, 1997.
- [25] D. Babic, C. Schmitt, and C. Bechinger. Colloids as model systems for problems in statistical physics. Chaos, 15:026114, 2005.
- [26] L. Gammaitoni, P. Hanggi, P. Jung, and F. Marchesoni. Stochastic resonance. Rev. Mod. Phys., 70:223– 287, 1998.
- [27] C. R. Doering and J. C. Gadoua. Resonant activation over a fluctuating barrier. Phys. Rev. Lett., 69:2318–2321, 1992.
- [28] R. D. Astumian. Thermodynamics and kinetics of a brownian motor. Science, 276:917–922, 1997.
- [29] G. Volpe, S. Perrone, J. M. Rubi, and D. Petrov. Stochastic resonant damping in a noisy monostable system: Theory and experiment. Phys. Rev. E, 77:051107, 2008.
- [30] A Ashkin. Forces of a single-beam gradient laser trap on a dielectric sphere in the ray optics regime. Biophys. J., 61(2):569–582, Jan 1992.
- [31] F. Merenda, G. Boer, J. Rohner, G. Delacrétaz, and R.-P-Salathé. Escape trajectories of single-beam optically trapped micro-particles in a transverse fluid flow. Opt. Express, 14:1685–1699, 2006.
- [32] Y. Roichman, B. Sun, A. Stolarski, and D. G. Grier. Influence of nonconservative optical forces on the dynamics of optically trapped colloidal spheres: The fountain of probability. Phys. Rev. Lett., 101:128301, 2008.
- [33] G. Pesce, G. Volpe, A. C. De Luca, G. Rusciano, and G. Volpe. Quantitative assessment of non-conservative radiation forces in an optical trap. EPL (Europhys. Lett.), 86:38002, 2009.
- [34] G.Pesce, A.Sasso, and S. Fusco. Viscosity measurements on micron-size scale using optical tweezers. Rev. Sci. Instrumen., 76:115105, 2005.
- [35] K. Berg-Sørensen and H. Flyvbjerg. Power spectrum analysis for optical tweezers. Rev. Sci. Instrumen., 75:594–612, 2004.
- [36] F. Gittes and C.F. Schmidt. Interference model for back-focal-plane displacement detection in optical tweezers. Opt. Lett., 23:7, 1998.
- [37] A. Buosciolo, G. Pesce, and A. Sasso. New calibration method for position detector for simultaneous measurements of force constants and local viscosity in optical tweezers. Opt. Commun., 230(4-6):357–368, 2004.
- [38] G. Volpe and D. Petrov. Torque detection using brownian fluctuations. Phys. Rev. Lett., 97(21):210603, Nov 2006.
- [39] G. Volpe, G. Volpe, and D. Petrov. Brownian motion in a nonhomogeneous force field and photonic force microscope. Phys. Rev. E, 76(6):061118, Dec 2007.
- [40] G. Volpe, G. Volpe, and D. Petrov. Singular-point characterization in microscopic flows. Phys. Rev. E, 77(3):037301, Mar 2008.