Unveiling the nature of INTEGRAL objects through optical spectroscopy††thanks: Based on observations collected at the following observatories: Cerro Tololo Interamerican Observatory (Chile); Observatorio del Roque de los Muchachos of the Instituto de Astrofísica de Canarias (Canary Islands, Spain); ESO (La Silla, Chile) under programme 083.D-0110(A); Astronomical Observatory of Bologna in Loiano (Italy); Astronomical Observatory of Asiago (Italy); Observatorio Astronómico Nacional (San Pedro Mártir, México); South African Astronomical Observatory (Sutherland, South Africa); Anglo-Australian Observatory (Siding Spring, Australia); Apache Point Observatory (New Mexico, USA).
Hard X–ray surveys performed by the INTEGRAL satellite have discovered a conspicuous fraction (up to 30%) of unidentified objects among the detected sources. Here we continue our program of identification of these objects by (i) selecting probable optical candidates by means of positional cross-correlation of the INTEGRAL detections with soft X–ray, radio, and/or optical archives and (ii) performing optical spectroscopy on them. As a result, we pinpointed and identified, or more accurately characterized, 44 definite or likely counterparts of INTEGRAL sources. Among them, 32 are active galactic nuclei (AGNs; 18 with broad emission lines, 13 with narrow emission lines only, and one X–ray bright, optically normal galaxy) with redshift 0.019 0.6058, 6 cataclysmic variables (CVs), 5 high-mass X–ray binaries (2 of which in the Small Magellanic Cloud), and 1 low-mass X–ray binary. This was achieved by using 7 telescopes of various sizes and archival data from two online spectroscopic surveys. The main physical parameters of these hard X–ray sources were also determined using the multiwavelength information available in the literature. In general, AGNs are the most abundant population among hard X–ray objects, and our results confirm the tendency of finding AGNs more frequently than any other type of hard X–ray emitting object among unidentified INTEGRAL sources when optical spectroscopy is used as an identification tool. Moreover, the deeper sensitivity of the more recent INTEGRAL surveys enables one to begin detecting hard X–ray emission above 20 keV from sources such as LINER-type AGNs and non-magnetic CVs.
Key Words.:
Galaxies: Seyfert — quasars: emission lines — X–rays: binaries — Stars: novae, cataclysmic variables — Techniques: spectroscopic — X–rays: individuals1 Introduction

![[Uncaptioned image]](/html/1006.4513/assets/x37.png)
![[Uncaptioned image]](/html/1006.4513/assets/x38.png)
![[Uncaptioned image]](/html/1006.4513/assets/x39.png)
![[Uncaptioned image]](/html/1006.4513/assets/x40.png)
![[Uncaptioned image]](/html/1006.4513/assets/x41.png)
![[Uncaptioned image]](/html/1006.4513/assets/x42.png)
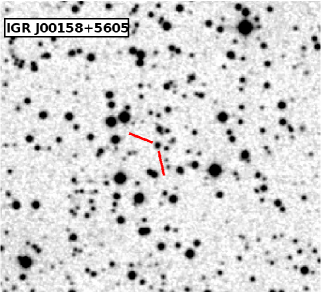
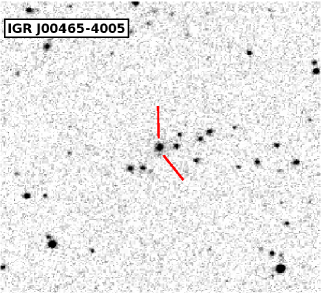
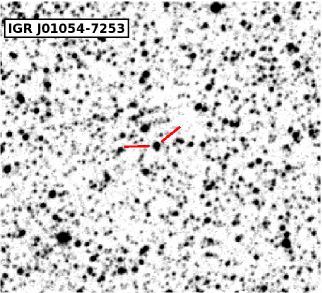
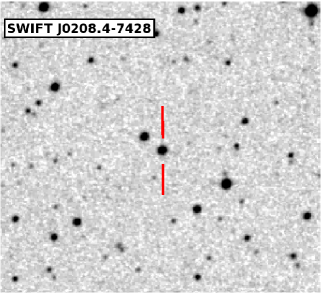
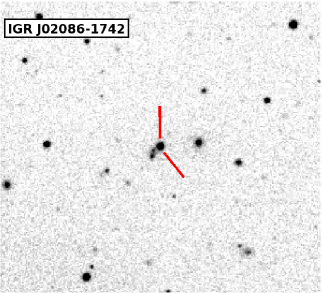
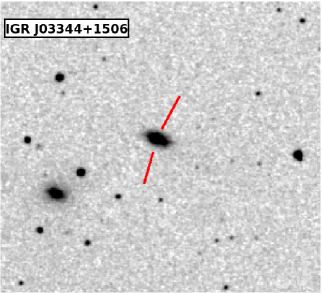
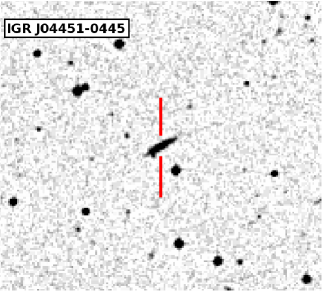
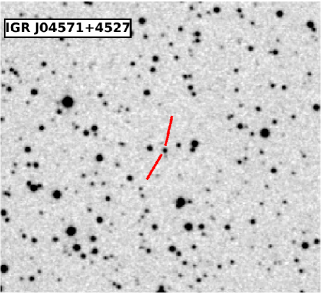
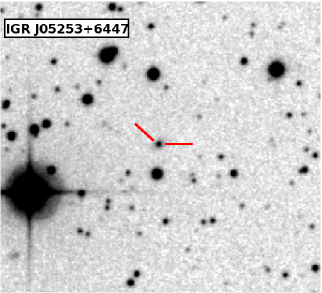
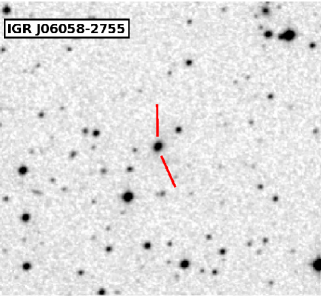
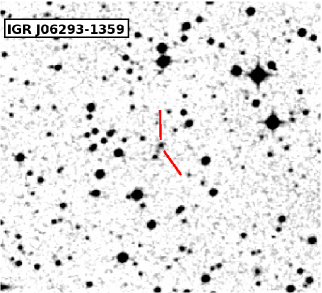
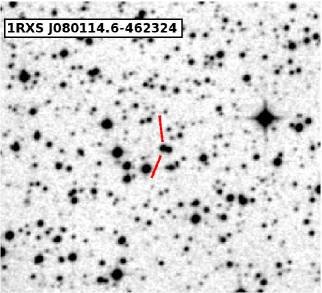
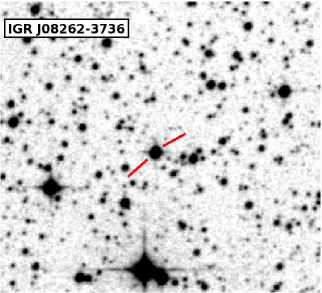
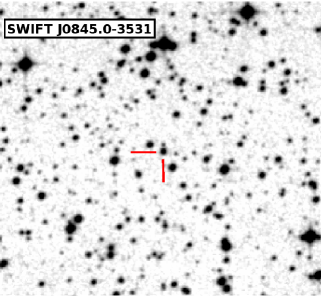
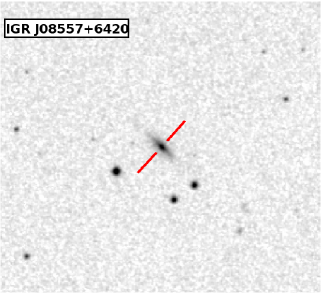
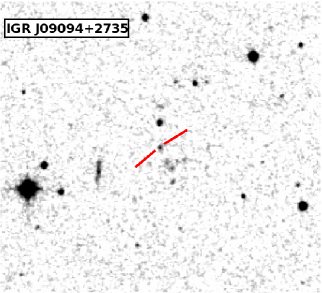
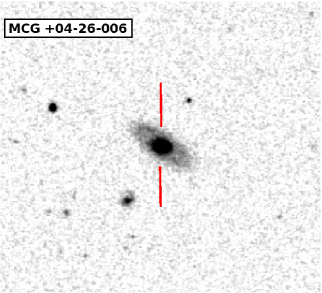
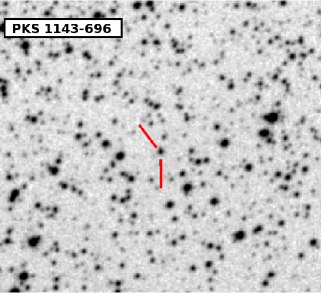
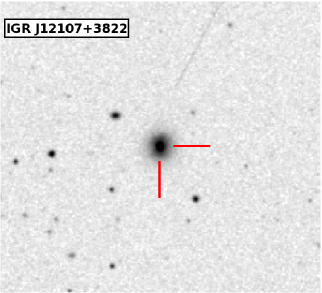
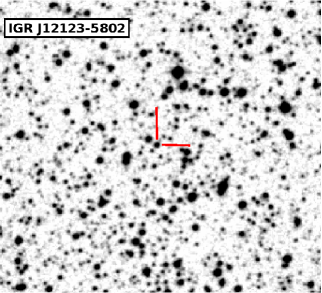
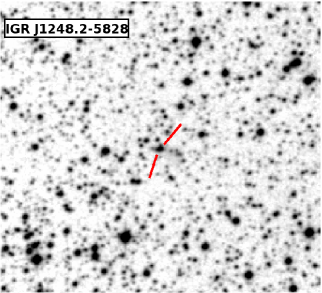
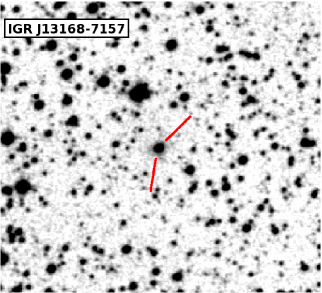
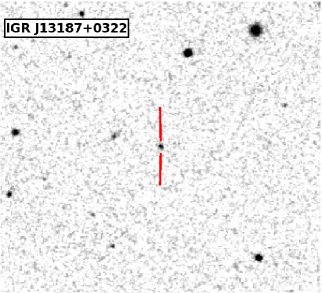
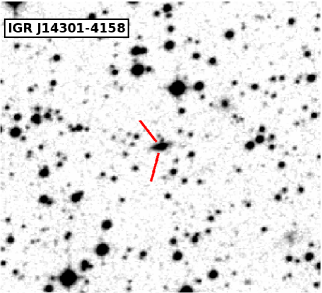
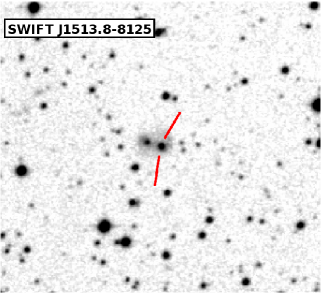
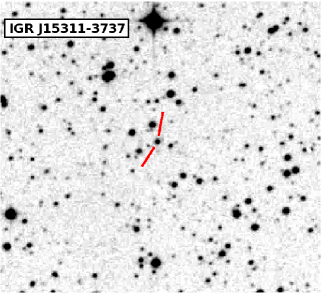
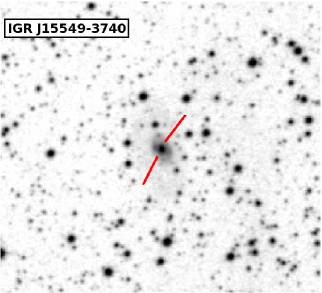
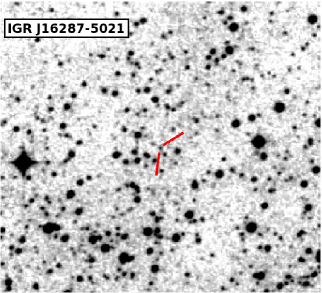
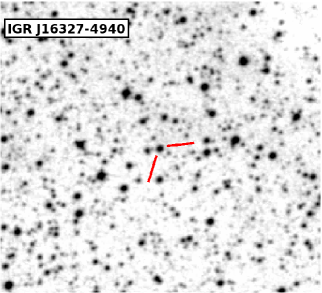
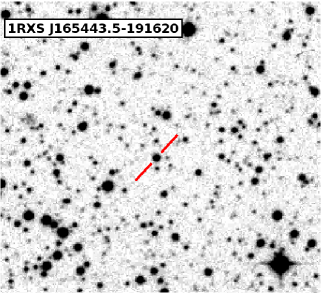
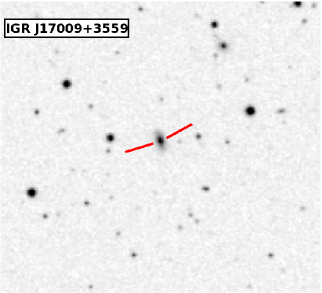
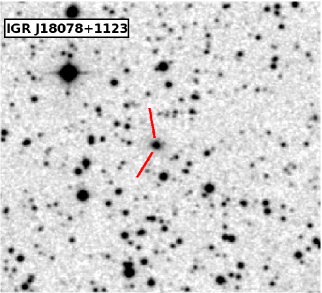
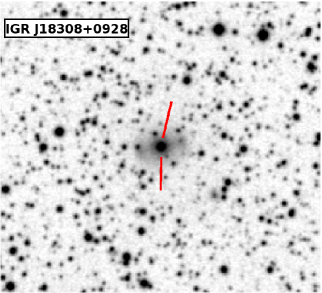
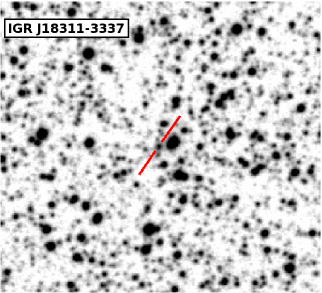
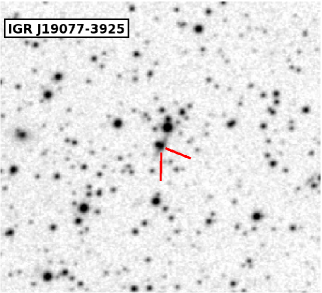
![[Uncaptioned image]](/html/1006.4513/assets/x43.png) Figure 5: As Fig. 1, but for 7 more INTEGRAL sources of our
sample (see Table 1).
Figure 5: As Fig. 1, but for 7 more INTEGRAL sources of our
sample (see Table 1).
The fourth survey (Bird et al. 2010) performed by the IBIS instrument (Ubertini et al. 2003) onboard the INTEGRAL satellite (Winkler et al. 2003) has allowed the detection of more than 700 hard X–ray sources over the whole sky in the 20–100 keV band down to an average flux level of about 1 mCrab and with positional accuracies ranging between 0.2 and 5 arcmin.
In this survey, IBIS found mostly active galactic nuclei (AGNs, 35% of the total number of detected objects) followed by known Galactic X–ray binaries (26%) and cataclysmic variables (CVs, 5%). A large number of the remaining objects (29% of all detections) has no obvious counterpart at other wavelengths and therefore cannot be associated with any known class of high-energy emitting objects. Therefore, a multiwavelength observational campaign on these unidentified sources is crucial to determine their nature, and is especially important given that they constitute one third of the whole set of IBIS detections.
X–ray analysis methods have helped in identifying the nature of new INTEGRAL sources, such as for example X–ray timing (by the detection of pulsations or orbital periods, e.g., Walter et al. 2006; Corbet et al. 2010; La Parola et al. 2010) or, in general, X–ray spectroscopy and imaging (Tomsick et al. 2009 and references therein). Alternatively, and also quite effectively, cross-correlation with soft X–ray catalogs and optical spectroscopy on thereby selected candidates allows the determination of the nature and main multiwavelength characteristics of unidentified or poorly studied hard X–ray objects.
We thus continue the identification work on INTEGRAL sources
started in 2004, which has allowed us to identify up to now more than 100
sources by means of optical spectroscopy (see Masetti et al. 2004,
2006a,b,c,d, 2008a, 2009 — hereafter Papers I-VII, respectively — and
Masetti et al. 2007, 2008b), by presenting optical spectra of the firm or
likely counterparts of 42 unidentified, unclassified or poorly studied
sources belonging to the 4th IBIS catalog (Bird et al. 2010) or
the online INTEGRAL All-Sky Survey Source Catalog (Krivonos et
al. 2010111A preliminary version of this catalog can be found at
http://hea.iki.rssi.ru/rsdc/catalog/index.php); we moreover included
two additional sources in our sample, that is, IGR J010547253 (Bozzo et
al. 2009; Coe et al. 2010) and Swift J0208.47428 (McBride et al. 2010)
observed in the Small Magellanic Cloud (SMC), thus reaching a total of 44
objects. Optical spectroscopy for all of them was acquired using 7
different telescopes and 2 public spectroscopic archives.
The paper is structured as follows: in Sect. 2, we explain the criteria used to select the sample of INTEGRAL and optical objects considered in this work. In Sect. 3, a brief description of the observations is given. Section 4 reports and discusses the results, divided into three broad classes of sources (CVs, X–ray binaries, and AGNs), and an update of the statistical outline of the identifications of INTEGRAL sources obtained until now. Conclusions are drawn in Sect. 5.
The main results of this paper, along with the information about the INTEGRAL sources that have been identified (by us or by other groups) using optical or near-infrared (NIR) observations, are also collected in a web page222http://www.iasfbo.inaf.it/extras/IGR/main.html that we maintain as a service to the scientific community (Masetti & Schiavone 2008). In this work, if not otherwise stated, errors and limits are reported at 1 and 3 confidence levels, respectively. We also note that this work supersedes the results presented in the preliminary analysis of Masetti et al. (2010) in which the identifications for a subsample of 25 sources were reported.
2 Sample selection
In a similar way to Papers I-VII, and this time using the two largest
and most recently available IBIS surveys (Bird et al. 2010; Krivonos et
al. 2010), we selected unidentified or unclassified hard X–ray
sources that contain, within the
IBIS 90% confidence level error box, a single bright soft X–ray object
detected either in the ROSAT all-sky surveys (Voges et al. 1999,
2000), or with Swift/XRT (from Baumgartner et al. 2008,
Landi et al. 2009, 2010, Mescheryakov et al. 2009, Krivonos et al.
2009, Coe et al. 2009, Kniazev et al. 2010, McBride et al. 2010, and
— in some cases independently — from the
XRT archive333XRT archival data are freely available at
http://www.asdc.asi.it/), or in the XMM-Newton Slew Survey (Saxton
et al. 2008), or with Chandra (Tomsick et al. 2009). This approach
was proven by Stephen et al. (2006) to be very effective in associating,
with a high degree of probability, IBIS sources with a softer
X–ray counterpart and in turn drastically reducing their positional
error circles to a few arcsec in radius, thus shrinking the search
area by a factor of 104.
After this first selection, we chose among these objects those that had, within their refined 90% confidence level soft X–ray error boxes444When needed, for the cases in which the soft X–ray positional error is given at 1 confidence level (basically, the ROSAT and XMM-Newton Slew Survey sources) we rescaled it to the corresponding 90% confidence level assuming a Gaussian probability distribution., a single or a few (3 at most) possible optical counterparts with magnitudes 19 in the DSS-II-Red survey555Available at http://archive.eso.org/dss/dss, for which optical spectroscopy could be obtained with reasonable signal-to-noise ratio (S/N) at telescopes with diameter smaller than 4 metres.
This allowed us to pinpoint 31 sources, to which we added two hard X–ray objects detected with INTEGRAL in the SMC, as mentioned above (Bozzo et al. 2009; Coe et al. 2009, 2010; McBride et al. 2010).
To enlarge the sample, we performed a similar procedure by cross-correlating the above IBIS surveys with radio catalogs such as the NVSS (Condon et al. 1998), SUMSS (Mauch et al. 2003), and MGPS (Murphy et al. 2007) surveys when a soft X–ray observation of the hard X–ray source field was not available. This step provided 5 more INTEGRAL sources with likely optical counterparts. Finally, we also considered IBIS objects that contain within their error box a conspicuous galaxy belonging to the 2MASX archive (Skrutskie et al. 2006), or an emission-line object present in the SIMBAD database666Available at http://simbad.u-strasbg.fr. This identified 6 additional IBIS sources to be included in our sample.
Although selected by means of cross-correlation with optical catalogs only, the position of the possible counterpart to IGR J082623736 is within the 2 error circle of a ROSAT all-sky faint survey source (Voges et al. 2000); however, given the large extent of its ROSAT error circle (31′′ in radius at 1 confidence level), we consider the association between the optical and the ROSAT sources too loose to be assumed as firm.
Thus, in total we gathered a sample of 44 INTEGRAL objects with possible optical counterparts, which we explored by means of optical spectroscopy. Their names and accurate coordinates (to 1′′ or less) are reported in Table 1, while their optical finding charts are shown in Figs. 1-5, with the corresponding putative counterparts indicated with tick marks. The finding chart for source IGR J22292+6647 is not reported here as it was already published in Landi et al. (2009).
For the source naming in Table 1, we simply adopted the names as they appear in the relevant catalogs (Bird et al. 2010; Krivonos 2010) or papers (Bozzo et al. 2009; Coe et al. 2010; McBride et al. 2010), and the “IGR” alias when available. However, we note that for one of the hard X–ray objects selected by means of cross-correlation with soft X–ray catalogs, i.e., 1RXS J191928.5295808, we chose to use its ROSAT name (thus associated with its soft X–ray emission) rather than the denomination reported in the 4th IBIS Survey (PKS 1916300; Bird et al. 2010) because the latter refers to a radio source that is slightly but significantly offset from the optical and soft X–ray positions of the possible counterpart to this INTEGRAL hard X–ray object.
In any case, we wish to point out that the 11 sources with no associated soft X–ray counterpart should be considered to have only a tentative, albeit likely, counterpart: this is indicated with an asterisk in Table 1. This caution, although to a much lesser extent, should also be applied to those IBIS sources (IGR J03344+1506, IGR J09094+2735, and 1RXS J211336.1+542226) associated only with an object belonging to the ROSAT all-sky faint survey (Voges et al. 2000) as pointed out by Stephen et al. (2006). The reader is nevertheless referred to Paper III for the caveats and the shortcomings of choosing, within an IBIS error box, “peculiar” sources that are not straightforwardly linked to an arcsec-sized soft X–ray position.
We also note that, for the high-energy sources in our sample with more than one optical candidate in the corresponding arcsec-sized error box, all objects with 19 were spectroscopically observed. However, we only indicate their firm or likely optical counterpart, identified on the basis of peculiar spectral features (that is, emission lines). All other candidates are considered no further because their spectra do not exhibit any peculiarity.
To summarize, we emphasize that in our final sample there are 4 INTEGRAL sources (IGR J12107+3822, Mescheryakov et al. 2009; IGR J131687157, Kniazev et al. 2010; IGR J17009+3559, Krivonos et al. 2009; and IGR J22292+6647, Butler et al. 2009) that, although already identified by these authors, have incomplete information at longer wavelengths or were independently observed by us before their identification was published. Our observations are thus presented here to confirm the nature of these objects and improve their classification and the amount of information known about them.
| (1) | (2) | (3) | (4) | (5) | (6) | (7) | (8) |
| Object | RA | Dec | Telescope+instrument | range | Disp. | UT Date & Time | Exposure |
| (J2000) | (J2000) | (Å) | (Å/pix) | at mid-exposure | time (s) | ||
| IGR J00158+5605 | 00:15:54.19 | +56:02:57.5 | Cassini+BFOSC | 3500-8700 | 4.0 | 16 Nov 2009, 19:46 | 21800 |
| IGR J004654005 | 00:46:20.68 | 40:05:49.1 | CTIO 1.5m+RC Spec. | 3300-10500 | 5.7 | 12 Sep 2009, 04:22 | 21800 |
| IGR J010547253 | 01:04:42.28 | 72:54:03.7 | Radcliffe+Gr. Spec. | 3850-7200 | 2.3 | 16 Aug 2009, 03:17 | 21800 |
| IGR J01545+6437∗ | 01:54:35.29 | +64:37:57.5 | Copernicus+AFOSC | 3500-7800 | 4.2 | 07 Dec 2008, 22:51 | 21800 |
| Swift J0208.47428 | 02:06:45.17 | 74:27:47.7 | CTIO 1.5m+RC Spec. | 3300-10500 | 5.7 | 27 Dec 2009, 01:13 | 21200 |
| IGR J020861742 | 02:08:34.95 | 17:39:34.8 | SPM 2.1m+B&C Spec. | 3500-7800 | 4.0 | 03 Dec 2008, 06:28 | 21800 |
| IGR J03344+1506 | 03:34:32.77 | +15:08:01.2 | SPM 2.1m+B&C Spec. | 3500-7800 | 4.0 | 19 Sep 2009, 10:31 | 21800 |
| IGR J044510445∗ | 04:44:52.93 | 04:46:39.5 | SPM 2.1m+B&C Spec. | 3500-7800 | 4.0 | 19 Sep 2009, 11:49 | 21800 |
| IGR J04571+4527 | 04:57:06.98 | +45:27:48.5 | SPM 2.1m+B&C Spec. | 3500-7800 | 4.0 | 29 Jan 2009, 07:01 | 21800 |
| IGR J05253+6447 | 05:24:28.61 | +64:44:43.7 | Cassini+BFOSC | 3500-8700 | 4.0 | 09 Dec 2009, 22:35 | 21800 |
| IGR J060582755 | 06:05:48.96 | 27:54:40.1 | CTIO 1.5m+RC Spec. | 3300-10500 | 5.7 | 30 Nov 2009, 02:51 | 21000 |
| IGR J062931359∗ | 06:29:09.3‡ | 14:04:49‡ | SPM 2.1m+B&C Spec. | 3500-7800 | 4.0 | 05 Dec 2008, 05:38 | 21800 |
| 1RXS J080114.6462324 | 08:01:17.03 | 46:23:27.5 | NTT+EFOSC2 | 3650-9300 | 5.5 | 01 Jun 2009, 00:31 | 1200 |
| IGR J082623736∗ | 08:26:13.65 | 37:37:11.9 | CTIO 1.5m+RC Spec. | 3300-10500 | 5.7 | 30 Nov 2009, 08:18 | 2900 |
| Swift J0845.03531 | 08:45:21.38 | 35:30:24.2 | CTIO 1.5m+RC Spec. | 3300-10500 | 5.7 | 19 Dec 2009, 06:10 | 21800 |
| IGR J08557+6420 | 08:55:12.54 | +64:23:45.5 | SPM 2.1m+B&C Spec. | 3500-7800 | 4.0 | 30 Jan 2009, 07:17 | 21800 |
| IGR J09094+2735 | 09:09:18.75 | +27:37:33.7 | SDSS+CCD Spec. | 3800-9200 | 1.0 | 17 Jan 2005, 06:22 | 2700 |
| MCG +0426006 | 10:46:42.51 | +25:55:53.9 | SPM 2.1m+B&C Spec. | 3500-7800 | 4.0 | 03 Dec 2008, 11:51 | 21800 |
| PKS 1143696 | 11:45:53.62 | 69:54:01.8 | CTIO 1.5m+RC Spec. | 3300-10500 | 5.7 | 31 Dec 2009, 06:19 | 21800 |
| IGR J12107+3822 | 12:10:44.28 | +38:20:10.2 | SDSS+CCD Spec. | 3800-9200 | 1.0 | 13 Apr 2005, 07:12 | 2300 |
| IGR J121235802 | 12:12:26.24 | 58:00:20.5 | CTIO 1.5m+RC Spec. | 3300-10500 | 5.7 | 31 Dec 2009, 07:22 | 21800 |
| IGR J1248.25828 | 12:47:57.84 | 58:30:00.2 | Radcliffe+Gr. Spec. | 3850-7200 | 2.3 | 13 Aug 2009, 17:56 | 1800 |
| IGR J131687157 | 13:16:54.28 | 71:55:27.1 | CTIO 1.5m+RC Spec. | 3300-10500 | 5.7 | 28 Jan 2010, 05:15 | 21200 |
| IGR J13187+0322∗ | 13:18:31.24 | +03:19:48.9 | SDSS+CCD Spec. | 3800-9200 | 1.0 | 22 Jan 2002, 13:07 | 4800 |
| IGR J143014158∗ | 14:30:12.17 | 41:58:31.4 | AAT+6dF | 3900-7600 | 1.6 | 29 Jun 2003, 12:00 | 600+1200 |
| Swift J1513.88125 | 15:14:41.92 | 81:23:38.0 | Radcliffe+Gr. Spec. | 3850-7200 | 2.3 | 13 Aug 2009, 20:37 | 21800 |
| IGR J153113737 | 15:30:51.79 | 37:34:57.3 | Radcliffe+Gr. Spec. | 3850-7200 | 2.3 | 15 Aug 2009, 19:36 | 21800 |
| IGR J155493740∗ | 15:54:46.76 | 37:38:19.1 | AAT+6dF | 3900-7600 | 1.6 | 12 May 2002, 15:38 | 1200+600 |
| IGR J162875021 | 16:28:27.36 | 50:22:42.9 | NTT+EFOSC2 | 3650-9300 | 5.5 | 31 May 2009, 01:41 | 1200 |
| IGR J163274940∗ | 16:32:39.95 | 49:42:13.8 | Radcliffe+Gr. Spec. | 3850-7200 | 2.3 | 10 Aug 2009, 20:44 | 21800 |
| 1RXS J165443.5191620 | 16:54:43.74 | 19:16:31.1 | SPM 2.1m+B&C Spec. | 3500-7800 | 4.0 | 21 Jun 2009, 06:13 | 21800 |
| IGR J17009+3559 | 17:00:53.00 | +35:59:56.2 | Copernicus+AFOSC | 3500-7800 | 4.2 | 16 Oct 2009, 18:04 | 21800 |
| IGR J18078+1123 | 18:07:49.91 | +11:20:49.1 | SPM 2.1m+B&C Spec. | 3500-7800 | 4.0 | 21 Jun 2009, 18:49 | 21800 |
| IGR J18308+0928 | 18:30:50.64 | +09:28:41.7 | Cassini+BFOSC | 3500-8700 | 4.0 | 18 May 2009, 23:24 | 21200 |
| IGR J183113337∗ | 18:31:14.75 | 33:36:08.5 | AAT+6dF | 3900-7600 | 1.6 | 27 Jul 2003, 12:48 | 1200+600 |
| IGR J190773925 | 19:07:50.36 | 39:23:31.9 | AAT+6dF | 3900-7600 | 1.6 | 26 Jun 2003, 15:25 | 1200+600 |
| IGR J19113+1533∗ | 19:11:18.83 | +15:32:32.8 | SPM 2.1m+B&C Spec. | 3500-7800 | 4.0 | 04 Dec 2008, 02:06 | 1200 |
| IGR J191181707∗ | 19:11:42.64 | 17:10:05.1 | AAT+6dF | 3900-7600 | 1.6 | 21 Apr 2004, 18:34 | 1200+600 |
| 1RXS J191928.5295808 | 19:19:28.04 | 29:58:08.0 | AAT+6dF | 3900-7600 | 1.6 | 10 Sep 2002, 10:10 | 1200+600 |
| IGR J19552+0044 | 19:55:12.47 | +00:45:36.6 | Cassini+BFOSC | 3500-8700 | 4.0 | 19 May 2009, 01:58 | 21800 |
| 1RXS J211336.1+542226 | 21:13:35.38† | +54:22:32.8† | SPM 2.1m+B&C Spec. | 3500-7800 | 4.0 | 22 Jun 2009, 10:21 | 31800 |
| 1RXS J211928.4+333259 | 21:19:29.13 | +33:32:57.0 | SPM 2.1m+B&C Spec. | 3500-7800 | 4.0 | 04 Dec 2008, 03:12 | 21800 |
| 1RXS J213944.3+595016 | 21:39:45.1 | +59:50:14 | SPM 2.1m+B&C Spec. | 3500-7800 | 4.0 | 24 Jun 2009, 10:44 | 21800 |
| IGR J22292+6647 | 22:29:13.84 | +66:46:51.5 | TNG+DOLoReS | 3800-8000 | 2.5 | 13 Aug 2008, 01:27 | 1800 |
| ∗: tentative association (see text). | |||||||
| †: coordinates extracted from the USNO catalogs, having an accuracy of about 02 (Deutsch 1999; Assafin et al. 2001; Monet et al. 2003). | |||||||
| ‡: coordinates extracted from the DSS-II-Red frames, having an accuracy of 1′′. | |||||||
3 Optical spectroscopy
Similarly to Papers VI and VII, the data presented in this work were collected in the course of a campaign that lasted one year and a half involving observations at the following telescopes:
-
•
the 1.5m at the Cerro Tololo Interamerican Observatory (CTIO), Chile;
-
•
the 1.52m “Cassini” telescope of the Astronomical Observatory of Bologna, in Loiano, Italy;
-
•
the 1.82m “Copernicus” telescope of the Astronomical Observatory of Asiago, Italy;
-
•
the 1.9m “Radcliffe” telescope of the South African Astronomical Observatory (SAAO) in Sutherland, South Africa;
-
•
the 2.1m telescope of the Observatorio Astronómico Nacional in San Pedro Martir (SPM), México;
-
•
the 3.58m “Telescopio Nazionale Galileo” (TNG) at the Roque de Los Muchachos Observatory in La Palma, Spain;
-
•
the 3.58m “New Technology Telescope” (NTT) at the ESO-La Silla Observatory, Chile.
The spectroscopic data acquired at these telescopes were optimally extracted (Horne 1986) and reduced following standard procedures using IRAF777IRAF is the Image Reduction and Analysis Facility made available to the astronomical community by the National Optical Astronomy Observatories, which are operated by AURA, Inc., under contract with the U.S. National Science Foundation. It is available at http://iraf.noao.edu/. Calibration frames (flat fields and bias) were taken on the day preceeding or following the observing night. The wavelength calibration was performed using lamp data acquired soon after each on-target spectroscopic acquisiton; the uncertainty in this calibration was 0.5 Å in all cases according to our checks made using the positions of background night sky lines. Flux calibration was performed using catalogued spectrophotometric standards.
Additional spectra were retrieved from two different astronomical archives: the Sloan Digital Sky Survey888http://www.sdss.org/ (SDSS, Adelman-McCarthy et al. 2007) archive, and the Six-degree Field Galaxy Survey999http://www.aao.gov.au/local/www/6df/ (6dFGS) archive (Jones et al. 2004). Since the 6dFGS archive provides spectra that are not flux-calibrated, we used the optical photometric information in Jones et al. (2005) to calibrate the 6dFGS spectra presented in this work.
We report in Table 1 the detailed log of all observations. We list in Col. 1 the names of the observed INTEGRAL sources. In Cols. 2 and 3, we indicate the possible optical counterpart coordinates, extracted from the 2MASS catalog (with an accuracy of 01, according to Skrutskie et al. 2006), from the USNO catalogs (with uncertainties of about 02: Deutsch 1999; Assafin et al. 2001; Monet et al. 2003), or from the DSS-II-Red astrometry (which has a precision of 1′′). In Col. 4, we report the telescope and the instrument used for the observations. The characteristics of each spectrograph are presented in Cols. 5 and 6. Column 7 provides the observation date and the UT time at mid-exposure, while Col. 8 reports the exposure times and the number of observations for each source.
To provide additional information about the possible counterpart to IGR
J162875021, we also analyzed an optical -band frame acquired with
the NTT plus EFOSC2 on 31 May 2009 (start time: 01:27 UT; duration: 20 s)
in seeing conditions of 18; the 22-rebinned CCD of EFOSC2
provides a plate scale of 024/pix and a useful field of
4141.
This imaging frame was corrected for both bias and flat-field using
standard procedures and was calibrated using nearby
USNO-A2.0101010Available at
http://archive.eso.org/skycat/servers/usnoa/ stars. Simple aperture
photometry, within the
MIDAS111111http://www.eso.org/projects/esomidas package, was
then used to evaluate the -band magnitude of the possible optical
counterpart to IGR J162875021.
4 Results
We describe the identification and classification criteria for the optical spectra of the 44 sources belonging to the sample considered in this work. The optical magnitudes quoted below, if not stated otherwise, are extracted from the USNO-A2.0 catalog.
To determinate the reddening along the line of sight to the Galactic sources of our sample, when possible and applicable, we considered an intrinsic Hα/Hβ line ratio of 2.86 (Osterbrock 1989) and inferred the corresponding color excess by comparing the intrinsic line ratio with the measured one by applying the Galactic extinction law of Cardelli et al. (1989).
To determine the distances of the compact Galactic X–ray sources of our sample, for CVs we assumed an absolute magnitude M 9 and an intrinsic color index 0 mag (Warner 1995), whereas for high-mass X–ray binaries (HMXBs), when applicable, we used the intrinsic stellar color indices and absolute magnitudes reported in Lang (1992) and Wegner (1994). For the single low-mass X–ray binary (LMXB) in our sample, we considered 0 MR (e.g., van Paradijs & McClintock 1995). Although these methods basically provide an order-of-magnitude value for the distance of Galactic sources, our past experience (Papers I-VII) tells us that these estimates are in general correct to within 50% of the refined value subsequently determined with more precise approaches.
For the emission-line AGN classification, we used the criteria of Veilleux & Osterbrock (1987) and the line ratio diagnostics of both Ho et al. (1993, 1997) and Kauffmann et al. (2003); for the subclass assignation of Seyfert 1 nuclei, we used the Hβ/[O iii]5007 line flux ratio criterion described in Winkler (1992), and the criteria of Osterbrock & Pogge (1985) for the classification of narrow-line Seyfert 1 galaxies.
The spectra of the galaxies shown here were not corrected for starlight contamination (see, e.g., Ho et al. 1993, 1997) because of the limited S/N and spectral resolution. In this case, we also do not expect this to affect any of our main results and conclusions.
In the following, we consider a cosmology with = 65 km s-1 Mpc-1, = 0.7, and = 0.3; the luminosity distances of the extragalactic objects reported in this paper were computed for these parameters using the Cosmology Calculator of Wright (2006). When not explicitly stated otherwise, for our X–ray flux estimates we assume a Crab-like spectrum except for the XMM-Newton sources, for which we considered the fluxes reported in Saxton et al. (2008).
In the following subsections, we consider the object identifications by dividing them into three broad classes (CVs, X–ray binaries, and AGNs) listed according to their increasing distance from Earth.
4.1 CVs


We identify 6 objects of our sample (IGR J04571+4527, 1RXS J080114.6462324, IGR J121235802, 1RXS J165443.5191620, IGR J19552+0044, and 1RXS J211336.1+542226) as dwarf nova CVs because of the characteristics of their optical spectra (Fig. 6). All of them show Balmer emission lines up to at least Hδ, as well as helium lines in emission. All of the detected lines are consistent with a redshift = 0, indicating that these sources are within our Galaxy.
The main spectral diagnostic lines of these objects, as well as the main astrophysical parameters which can be inferred from the available optical and X–ray observational data, are reported in Table 2. The X–ray luminosities listed in this table for the various objects were computed using the fluxes reported in Voges et al. (1999, 2000), Bird et al. (2010), Cusumano et al. (2010), Krivonos et al. (2010), and Landi et al. (2010).
In the spectra of some of these sources (namely 1RXS J080114.6462324, IGR J121235802, and 1RXS J165443.5191620), the He ii 4686 / Hβ equivalent width (EW) ratio is 0.5 and the EWs of these emission lines are around (or larger than) 10 Å. This indicates that these sources are likely magnetic CVs belonging to the intermediate polar (IP) subclass (see Warner 1995 and references therein). To a lesser extent, a tentative IP classification can also be made for IGR J19552+0044 and 1RXS J211336.1+542226 given the strength of their He ii emission, although their He ii/Hβ EW ratios are 0.5. The spectral characteristics of IGR J04571+4527 (namely the He ii/Hβ EW ratio and the He ii EW) instead imply that it is a non-magnetic CV.
These IP classifications however need confirmation by the measurement of both the orbital period and the spin period of the white dwarf (WD) harbored in these systems, as optical spectroscopy is sometimes insufficient to firmly establish the magnetic nature of CVs (see e.g., Pretorius 2009 and de Martino et al. 2010).
| Object | Hα | Hβ | He ii 4686 | |||||||
| EW | Flux | EW | Flux | EW | Flux | mag | (mag) | (pc) | ||
| IGR J04571+4527 | 19.40.6 | 10.30.3 | 9.50.5 | 4.80.2 | 3.60.4 | 1.670.17 | 17.5 | 0 | 500 | 0.10 (0.1–2.4) |
| 53 (17–60) | ||||||||||
| 67 (14–150) | ||||||||||
| 1RXS J080114.6462324 | 19.90.6 | 7.20.2 | 16.70.8 | 6.50.3 | 9.70.7 | 3.80.3 | 14.8 | 0 | 150 | 0.064 (0.1–2.4) |
| 1.1 (0.2–12) | ||||||||||
| 0.43–1.4 (2–10) | ||||||||||
| 1.6 (20–100) | ||||||||||
| IGR J121235802 | 20.31.0 | 7.10.4 | 12.71.3 | 5.10.5 | 7.40.7 | 3.50.3 | 15.4 | 0 | 190 | 1.9 (2–10) |
| 1.6 (20–40) | ||||||||||
| 1.6 (40–100) | ||||||||||
| 1RXS J165443.5191620 | 38.71.2 | 60.91.8 | 18.50.9 | 33.21.7 | 7.50.5 | 13.40.9 | 15.6 | 0 | 210 | 0.17 (0.1–2.4) |
| 7.7 (20–100) | ||||||||||
| IGR J19552+0044 | 2718 | 1645 | 2648 | 1685 | 392 | 603 | 16.0 | 0 | 250 | 0.66 (0.1–2.4) |
| 4.2 (0.2–12) | ||||||||||
| 6.2 (20–40) | ||||||||||
| 4.9 (40–100) | ||||||||||
| 1RXS J211336.1+542226 | 462 | 5.60.3 | 433 | 2.610.18 | 102 | 5.01.0 | 18.8 | 0 | 910 | 1.3 (0.1–2.4) |
| 99 (20–100) | ||||||||||
| Note: EWs are expressed in Å, line fluxes are in units of 10-15 erg cm-2 s-1, whereas X–ray luminosities are in units of 1031 erg s-1 and the | ||||||||||
| reference band (between round brackets) is expressed in keV. | ||||||||||
4.2 X–ray binaries


| Object | Hα | Hβ | He ii 4686 | Optical | Spectral | ||||||
| EW | Flux | EW | Flux | EW | Flux | mag. | (mag) | (kpc) | type | ||
| IGR J010547253 | 7.150.15 | 16.80.3 | 0.470.12 | 2.00.5 | in abs. | in abs. | 14.81a () | 0.7 | 60b | B0 III | 0.13 (0.1–2.4) |
| 700c (3–10) | |||||||||||
| 77 (20–100) | |||||||||||
| Swift J0208.47428 | 2.90.3 | 4.50.5 | in abs. | in abs. | 0.5 | 0.2 | 14.75d () | 0.18e | 60b | B1 III | 19 (0.2–12) |
| 6.5 (3–10) | |||||||||||
| 108 (15–35) | |||||||||||
| IGR J082623736 | 652 | 105030 | 5.50.4 | 967 | in abs.? | in abs.? | 12.9f () | 3.3e | 6.1 | OB V | 0.43 (20–100) |
| IGR J163274940 | 31.30.9 | 37011 | 7.60.7 | 3.80.4 | in abs. | in abs. | 15.5 () | 11.2 | 2 | OB giant | 0.0072 (20–40) |
| 0.018 (40–100) | |||||||||||
| IGR J19113+1533 | 22.51.1 | 1598 | 3.60.7 | 5.91.2 | 1.2 | 1.5 | 13.3 () | 7.0 | 9.1 | sgB[e] | 0.15 (20–40) |
| 0.28 (40–100) | |||||||||||
| IGR J162875021 | 523 | 1.750.09 | 196 | 0.230.07 | 155 | 0.160.05 | 19.5g () | 3.1 | 19 | — | 1.3 (0.2–12) |
| 2.9 (0.3–10) | |||||||||||
| 2.8 (2–10) | |||||||||||
| 3.8 (17–60) | |||||||||||
| 2.3 (20–40) | |||||||||||
| 1.2 (40–100) | |||||||||||
| Note: EWs are expressed in Å, line fluxes are in units of 10-15 erg cm-2 s-1, whereas X–ray luminosities are in units of 1035 erg s-1 and the reference | |||||||||||
| band (between round brackets) is expressed in keV. | |||||||||||
| a: from Massey (2002); b: from Harries et al. (2003); c: from Coe et al. (2010); d: from Demers & Irwin (1991); | |||||||||||
| e: only the Galactic reddening along the line of sight was assumed; f: from Pettersson (1987); g: this work. | |||||||||||
Six objects of our sample can be classified as X–ray binaries, given their optical spectral shape and characteristics (see Fig. 7), that is, Balmer emission lines at redshift 0 superimposed on an intrinsically blue continuum (in some cases modified by interstellar reddening).
Table 3 collects the relevant optical spectral information about these 6 sources, along with their main parameters inferred from the available X–ray and optical data. X–ray luminosities in Table 3 were calculated using the fluxes in Saxton et al. (2008), Bozzo et al. (2009), Rodriguez et al. (2009), Tomsick et al. (2009), Bird et al. (2010), Krivonos et al. (2010), and McBride et al. (2010). In this table, we also report the results of our -band photometry of the counterpart of IGR J162875021, described in Sect. 3, which infers a magnitude = 19.50.1.
Five of the sources (IGR J010547253, Swift J0208.47428, IGR J082623736, IGR J163274940, and IGR J19113+1533) can be classified as HMXBs due to their overall early-type star spectral appearance, which is typical of this class of objects (see e.g. Papers II-VII).
The spectra of the last three sources appear substantially reddened, which is indicative of interstellar dust along their lines of sight. This is quite common in X–ray binaries detected with INTEGRAL (e.g., Papers III-VII) and indicates that these objects are relatively far from Earth. The confirmation of reddening towards these sources comes from either their Hα/Hβ line ratio (see Table 3) or their optical colors. For IGR J082623736 and IGR J163274940, we find a reddening compatible with the Galactic one along the line of sight of the object (Schlegel et al. 1998).
The Balmer line ratio of KW97 3614, the putative optical counterpart of IGR J19113+1533, instead indicates an absorption that is larger than the Galactic one, implying that there is additional absorbing material local to the source. The spectral appearance of this optical object resembles that of IGR J163184848 (Filliatre & Chaty 2004), a heavily absorbed X–ray binary hosting a supergiant B[e] star, albeit the source of our sample is much less affected by reddening. Assuming these two sources to be similar, and the distance to IGR J163184848 as reported in Rahoui et al. (2008), the relevant parameters in Table 3 for IGR J19113+1533 were computed. We note that, if pointed soft X–ray observations confirm the association of IGR J19113+1533 with KW97 3614, this would be the second supergiant B[e]/X–ray binary detected by INTEGRAL at hard X–rays.
For the first 4 HMXBs of Table 3, we obtained the constraints for distance, reddening, spectral type, and X–ray luminosity shown in the table by considering the absolute magnitudes of early-type stars and by applying the method described in Papers III and IV for the classification of this type of X–ray sources. In particular, the optical counterparts of IGR J010547253 and Swift J0208.47428 are consistent with being blue giant stars at the distance of the SMC (60 kpc: see e.g. Harries et al. 2003) in terms of line redshift, magnitude, and optical colors. This result for IGR J010547253 was independently confirmed by the X–ray timing analysis of Townsend et al. (2009): these authors indeed classify this source as a Be/X–ray binary on the basis of its orbital and neutron star spin periodicities. For Swift J0208.47428, the use of our spectroscopy with the available optical photometry (Demers & Irwin 1991) allowed us to state that this is a B-type star and thus improve the preliminary classification given to the putative optical counterpart of this source by McBride et al. (2010). The two remaining cases (IGR J082623736 and IGR J163274940) are instead broadly classified as OB stars due to the strength of their Hα emission lines, which is much larger than the typical values seen in blue supergiants (Leitherer 1988); the Galactic Arm model of Leitch & Vasisht (1998) is then used to infer a likely distance of these stars and hence their luminosity class. The lack of further detailed photometric optical information and of higher-resolution spectroscopy does not allow us to refine our classification for the putative counterparts of these two INTEGRAL sources.
The HMXB nature of IGR J162875021 can instead be excluded because its spectral shape differs from those of the HMXBs in the present sample (see Fig. 7, lower right panel); it resembles instead those of reddened LMXBs detected with INTEGRAL (see Papers V-VII). The presence of Balmer and helium emission lines and no apparent absorption lines on top of a reddened (but intrinsically blue) continuum are indicative of an accretion disk dominating the total optical emission; the relative faintness of the optical/NIR counterpart also indicates that the size of the system (and thus of the donor star) is much smaller than that of a HMXB. In addition, the reddening itself suggests that this source lies far from Earth.
This is confirmed by the X–ray spectrum of this object (Tomsick et al. 2009), which also reveals absorption toward the source direction. A CV identification would instead make the relatively large optical and X–ray absorption mentioned above incompatible with the relatively small distance of the source (500 pc) derived from its -band magnitude. We thus conclude that this hard X–ray source is a LMXB. Despite this classification, we are unable to provide meaningful constraints on the distance to this source: the assumptions of Sect. 3 only allow us to determine a distance of 19 kpc (which can be considered as an upper limit given its large value; see Table 3).
We finally note that none of these systems are associated with a radio source. This implies that they are X–ray binaries that do not display collimated (jet-like) outflows, that is, that no system is a microquasar.
4.3 AGNs
| Object | Class | (Mpc) | ||||||
| IGR J00158+5605 | * | 27.71.3 | 30.00.9 | Sy1.5 | 0.169 | 875.5 | 0.427 | 1.8 (0.1–2.4) |
| * | [884] | [943] | 6.1 (0.2–2) | |||||
| 35 (20–40) | ||||||||
| 26 (40–100) | ||||||||
| IGR J020861742 | * | 12012 | 38.51.9 | Sy1.2 | 0.129 | 651.8 | 0.028 | 1.1 (0.1–2.4) |
| * | [12613] | [422] | 33 (2–10) | |||||
| 140 (20–100) | ||||||||
| IGR J060582755 | * | 586 | 663 | Sy1.5 | 0.090 | 443.1 | 0.030 | 5.0 (0.1–2.4) |
| * | [646] | [724] | 30 (0.2–12) | |||||
| 36 (17–60) | ||||||||
| Swift J0845.03531 | * | 26.31.3 | 5.40.3 | Sy1.2 | 0.137 | 695.7 | 0.531 | 5.9 (0.1–2.4) |
| * | [1126] | [22.91.6] | 78 (14–150) | |||||
| 50 (17–60) | ||||||||
| IGR J09094+2735 | * | 4.70.3 | 1.360.04 | NLSy1 | 0.2844 | 1572.4 | 0.030 | 6.7 (0.1–2.4) |
| * | [4.80.3] | [1.510.05] | 920 (17–60) | |||||
| PKS 1143696 | * | 482 | 1.00.1 | Sy1.2 | 0.244 | 1320.2 | 0.385 | 23 (0.1–2.4) |
| * | [1347] | [2.40.2] | 120 (2–10) | |||||
| 230 (17–60) | ||||||||
| 280 (20–100) | ||||||||
| IGR J12107+3822 | * | 1097 | 64.21.9 | Sy1.5 | 0.0229 | 107.5 | 0.021 | 0.31 (0.2–12) |
| * | [1157] | [682] | 1.8 (14–150) | |||||
| 1.6 (17–60) | ||||||||
| IGR J1248.25828 | * | 1.10.3 | 7.80.5 | Sy1.9 | 0.028 | 131.9 | 0.624 | 0.85 (2–10) |
| * | [5.81.6] | [544] | 1.6 (17–60) | |||||
| 2.1 (20–100) | ||||||||
| IGR J131687157 | * | 6710 | 47.11.4 | Sy1.5 | 0.070 | 339.9 | 0.255 | 0.60 (0.1–2.4) |
| * | [16020] | [1033] | 11 (0.2–12) | |||||
| 13 (17–60) | ||||||||
| IGR J13187+0322 | — | 17.21.7 | 1.50.3 | Type 1 | 0.6058 | 3846.2 | 0.031 | 540 (20–40) |
| — | [17.21.7] | [1.50.3] | QSO | 1300 (40–100) | ||||
| Swift J1513.88125 | * | 1035 | 37.31.1 | Sy1.2 | 0.069 | 334.8 | 0.272 | 20 (14–150) |
| * | [22311] | [832] | 34 (14–195) | |||||
| 15 (17–60) | ||||||||
| IGR J153113737 | — | 482 | 6.90.3 | Sy1 | 0.127 | 640.8 | 0.320 | 2.3 (0.1–2.4) |
| — | [1204] | [16.60.5] | 12–16 (0.2–12) | |||||
| 44 (20–100) | ||||||||
| IGR J18078+1123 | * | 644 | 12.60.6 | Sy1/1.2 | 0.078 | 380.9 | 0.131 | 1.2 (0.1–2.4) |
| * | [906] | [18.60.9] | 51 (17–60) | |||||
| IGR J190773925 | * | 4.80.7 | 20.11.2 | Sy1.9 | 0.0760 | 370.6 | 0.107 | 1.3 (0.1–2.4) |
| * | [6.20.9] | [28.01.4] | 24 (20–100) | |||||
| 1RXS J191928.5295808 | * | 428 | 1226 | Sy1.5/1.8 | 0.1669 | 863.5 | 0.139 | 12 (0.1–2.4) |
| * | [5611] | [1839] | 120 (17–60) | |||||
| 67 (20–40) | ||||||||
| 42 (40–100) | ||||||||
| 1RXS J211928.4+333259 | * | 102 | 15.20.8 | Sy1.5 | 0.051 | 244.4 | 0.217 | 0.44 (0.1–2.4) |
| * | [183] | [29.61.5] | 6.8 (0.2–12) | |||||
| 5.6 (14–150) | ||||||||
| 11 (14–195) | ||||||||
| 9.1 (17–60) | ||||||||
| 11 (20–100) | ||||||||
| 1RXS J213944.3+595016 | * | 3.00.2 | 2.010.10 | Sy1.5 | 0.114 | 570.4 | 1.271 | 1.7 (0.1–2.4) |
| * | [1128] | [724] | 23 (2–10) | |||||
| 14 (14–150) | ||||||||
| 40 (20–100) | ||||||||
| IGR J22292+6647 | * | 2.250.11 | 1.240.06 | Sy1.5 | 0.112 | 559.6 | 1.089 | 0.63 (0.1–2.4) |
| * | [523] | [26.31.3] | 12 (0.2–12) | |||||
| 25 (2–10) | ||||||||
| 55 (14–150) | ||||||||
| 100 (14–195) | ||||||||
| 42 (17–60) | ||||||||
| 42 (20–100) | ||||||||
| Note: emission-line fluxes are reported both as observed and (between square brackets) corrected for the intervening Galactic | ||||||||
| absorption along the object line of sight (from Schlegel et al. 1998). Line fluxes are in units of 10-15 erg cm-2 s-1, | ||||||||
| whereas X–ray luminosities are in units of 1043 erg s-1 and the reference band (between round brackets) is expressed in keV. | ||||||||
| The typical error in the redshift measurement is 0.001 but for the SDSS and 6dFGS spectra, for which an uncertainty | ||||||||
| of 0.0003 can be assumed. | ||||||||
| ∗: heavily blended with [N ii] lines | ||||||||
| Object | Class | ||||||||
| (Mpc) | Gal. | AGN | |||||||
| IGR J004654005 | 1.80.4 | 0.170.05 | 3.630.18 | Sy2 | 0.201 | 1061.3 | 0.011 | 1.26 | 16 (2–10) |
| [2.10.6] | [0.210.07] | [3.710.19] | 480 (20–100) | ||||||
| IGR J01545+6437 | 273 | 2.60.3 | 17.00.9 | Sy2 | 0.034 | 160.9 | 0.866 | 0.38 | 1.4 (20–40) |
| [17020] | [415] | [24012] | 1.2 (40–100) | ||||||
| IGR J03344+1506 | 422 | 5.10.5 | 20.71.0 | Sy2 | 0.021 | 98.4 | 0.316 | 0.81 | 0.0095 (0.1–2.4) |
| [874] | [14.01.4] | [543] | 0.79 (20–40) | ||||||
| 2.3 (40–100) | |||||||||
| IGR J044510445 | 5.20.5 | 0.5 | 0.7 | likely Sy2 | 0.076 | 370.6 | 0.048 | 1.05 | 47 (20–100) |
| [5.60.3] | [0.7] | [0.9] | |||||||
| IGR J05253+6447 | 4.50.5 | in abs. | 6.00.3 | likely Sy2 | 0.071 | 345.0 | 0.190 | — | 7.7 (0.2–2) |
| [6.70.7] | ′′ | [11.10.6] | 8.6 (20–40) | ||||||
| 19 (40–100) | |||||||||
| IGR J062931359 | 34.81.7 | 3.30.2 | 19.00.6 | Sy2 | 0.033 | 156.0 | 0.323 | 1.28 | 4.8 (20–40) |
| [734] | [7.40.5] | [51.71.6] | 4.1 (40–100) | ||||||
| IGR J08557+6420 | 6.20.4 | in abs. | 8.80.4 | likely Sy2 | 0.037 | 175.5 | 0.103 | — | 7.4 (17–60) |
| [7.90.6] | ′′ | [12.30.6] | |||||||
| MCG +0426006 | 212 | 8.20.6 | 15.40.8 | LINER | 0.020 | 93.7 | 0.030 | 0 | 0.23 (2–10) |
| [222] | [8.60.6] | [17.00.9] | 1.4 (14–150) | ||||||
| 3.3 (20–100) | |||||||||
| IGR J143014158 | 22.51.8 | 5.70.9 | 39.61.2 | Sy2 | 0.0387 | 183.8 | 0.117 | 0.29 | 3.7 (20–100) |
| [292] | [7.61.2] | [56.11.7] | |||||||
| IGR J155493740 | 67.71.8 | 7.930.12 | 462 | Sy2 | 0.0194 | 90.8 | 0.475 | 0.67 | 1.7 (20–100) |
| [2006] | [365] | [19510] | |||||||
| IGR J17009+3559 | — | in abs. | 0.33 | XBONG | 0.113 | 565.0 | 0.018 | — | 8.0 (1–10) |
| — | ′′ | [0.34] | 52 (17–60) | ||||||
| IGR J18308+0928 | 13.11.3 | 2 | 16.01.6 | Sy2 | 0.019 | 88.9 | 0.243 | 0.83 | 1.5 (14–150) |
| [263] | 4 | [333] | 3.7 (14–195) | ||||||
| 0.081 (17–60) | |||||||||
| IGR J183113337 | 40.21.8 | 6.00.6 | 822 | Sy2 | 0.0687 | 333.3 | 0.185 | 0.94 | 22 (20–100) |
| [603] | [8.40.8] | [1414] | |||||||
| IGR J191181707 | 1324 | 322 | 834 | LINER | 0.0234 | 109.9 | 0.137 | 0.25 | 0.87 (20–40) |
| [1795] | 493 | [1266] | 0.82 (40–100) | ||||||
| Note: emission-line fluxes are reported both as observed and (between square brackets) corrected for the intervening Galactic | |||||||||
| absorption along the object line of sight (from Schlegel et al. 1998). Line fluxes are in units of 10-15 erg cm-2 s-1, | |||||||||
| whereas X–ray luminosities are in units of 1043 erg s-1 and the reference band (between round brackets) is expressed in keV. | |||||||||
| The typical error in the redshift measurement is 0.001 but for the SDSS and 6dFGS spectra, for which an uncertainty | |||||||||
| of 0.0003 can be assumed. | |||||||||


It is found that 32 objects of our sample have optical spectra that allow us to classify them as AGNs (see Figs. 8-13). Thirty-one of them exhibit strong, redshifted broad and/or narrow emission lines typical of nuclear galactic activity: 18 of them can be classified as Type 1 (broad-line) and 13 as Type 2 (narrow-line) AGNs (see Tables 4 and 5, respectively, for their breakdown in terms of subclasses). In any case, we wish to draw the reader’s attention to our identification, for the first time, of two definite low-ionization nuclear emission-line regions (LINERs; Heckman 1980) among the unknown-nature hard X–ray sources detected with INTEGRAL: they are MCG +0426006 and IGR J191181707 (see Fig. 13).
In a single galaxy, IGR J17009+3559, the nuclear activity was discovered only thanks to soft X–ray emission detected with Swift (Krivonos et al. 2009), because no emission lines appear in its optical spectrum (Fig. 12, lower right panel): we therefore classify it as an X–ray bright, optically normal galaxy (XBONG; see Comastri et al. 2002). The “normal galaxy” nature of this source is confirmed using the approach of Laurent-Muehleisen et al. (1998). The association of this galaxy with a NVSS radio source (Condon et al. 1998) also points to an AGN nature. We note that, as already mentioned and at variance with Krivonos et al. (2009), we do not detect any emission line in the optical spectrum of IGR J17009+3559.
The main observed and inferred parameters for each of these two broad classes of AGNs are reported in Tables 4 and 5, respectively; those regarding the XBONG are shown in Table 5. In these tables, X–ray luminosities were computed from the fluxes reported in Voges et al. (1999, 2000), Saxton et al. (2008), Krivonos et al. (2009), Bird et al. (2010), Cusumano et al. (2010), Krivonos et al. (2010), Landi et al. (2010), Rodriguez et al. (2010), and Tueller et al. (2010).
For most of the AGNs in our sample (that is, 22 objects out of 32), the redshift value was determined or explictly published121212We here define as “explicitly published” the galaxy redshifts that appeared in published papers, rather than simply in online catalogs or databases (such as, for instance, the SIMBAD database). in this work for the first time. The redshifts of the remaining 10 sources are consistent with those reported in the literature, i.e., in the Hyperleda archive (Prugniel 2005), Mescheryakov et al. (2009), Kniazev et al. (2010), Krivonos et al. (2009), and Butler et al. (2009).
We were also able to give a more accurate classification of the three sources (IGR J12107+3822, IGR J131687157, and IGR J22292+6647) independently identified by Mescheryakov et al. (2009), Kniazev et al. (2010), and Butler et al. (2009), respectively: in detail, all of them could be classified as Seyfert 1.5 galaxies.
In addition, we slightly corrected the classification of Swift J1513.88125 from Seyfert 1.9 (as given in Tueller et al. 2010) to Seyfert 1.2, based on the appearance of its optical spectrum (Fig. 9, lower left panel). At this stage, we are unable to say whether this classification mismatch is caused by intrinsic spectral variability of the source in the optical.
When we examined in detail the optical and X–ray properties of the AGN sources of our sample, we found the following noteworthy issues for some selected cases. We note that IGR J00158+5605 could have been classified as a narrow-line Seyfert 1 AGN, given the narrowness of the full width at half maximum (FWHM) of its Hβ emission (2000 km s-1); however, owing to the absence of the Fe ii bumps around 4600 Å and 5200 Å, we opted for a Seyfert 1.5 galaxy classification.
It is also seen that, among all narrow-line AGNs (in Table 5) for which an estimate of the local absorption can be obtained, the LINER MCG +0426006 appears to display no reddening local to the AGN host. This suggests that this source may be a “naked” LINER. While “naked” Seyfert 2 galaxies, i.e. AGNs that lack the broad-line region (BLR) are not unheard of (see, e.g., Panessa & Bassani 2002, Bianchi et al. 2008 and Paper VI), the detection of a similar situation in a LINER is quite peculiar, so it is potentially interesting and deserves further study.
A reliable assessment of the Compton nature of the narrow-line AGNs of our sample (see Table 5) can be obtained using the diagnostic of Bassani et al. (1999), that is, the ratio of the measured 2–10 keV X–ray flux to the unabsorbed flux of the [O iii]5007 forbidden emission line. Because of its definition, however, this diagnostic could be explored only for the Seyfert 2 galaxy IGR J004654005 and the LINER MCG +0426006, which are the only two sources of Table 5 for which the above fluxes are simultaneously known. After correcting the [O iii]5007 emission line flux of these objects for the absorption local to the AGN (see again Table 5), we found that the parameter , defined in Bassani et al. (1999), has values 5.7 and 130, respectively, indicating that both sources are in the Compton thin regime. This finding strengthens the result of Landi et al. (2010) who classified these sources as Compton thin (albeit considerably absorbed) AGNs on the basis of their local hydrogen column, determined by means of X–ray spectral fitting and larger than 1023 cm-2 in both cases.
Following an independent method, we also verified this result by applying the diagnostic of Malizia et al. (2007), which uses the ratio of the flux measurement in the 2–10 keV band to that in the 20–100 keV band. Because of its definition, among the objects listed in Table 5, this method can be used with the presently available information only for the two sources above, in addition to the XBONG IGR J17009+3559. We found that this diagnostic yields values 0.033, 0.069, and 0.15, respectively, for the three sources considered. We caution the reader that, despite the definition of the diagnostic of Malizia et al. (2007), at present only the (1–10 keV)/(17–60 keV) flux ratio is available for IGR J17009+3559 (see Table 5): this means that, for this source, the value of this diagnostic should be considered as a strict upper limit. Nevertheless, when comparing these numbers with those of the sample of Malizia et al. (2007, their Fig. 5), we found that none of these sources fall in the locus in which possible Compton thick AGNs dwell. This result therefore independently confirms that these three AGNs are in the Compton thin regime.
Finally, we applied the prescriptions of Wu et al. (2004) and Kaspi et al. (2000), which use the width and the strength of the broad component of the Hβ emission as a probe of the orbital velocity and the size of the BLR. With them we calculated an estimate of the mass of the central black hole in 16 of the 18 Type 1 AGNs of our sample (a procedure that could not be applied to IGR J1248.25828 and IGR J190773925 as no broad Hβ emission component was detected in their spectra). The corresponding black hole masses for these 16 cases are reported in Table 6. Here we assumed a null local absorption for all Type 1 AGNs. The main sources of error in these mass estimates generally come from the determination of the Hβ emission flux, which spans from 3% to 30% in our sample (see Table 4), and from the scatter in the scaling relation, which introduces typical uncertainties of 0.4–0.5 dex in the black hole mass estimate (Vestergaard 2004).
| Object | ||
|---|---|---|
| IGR J00158+5605 | 1900 | 5.3 |
| IGR J020861742 | 12100 | 180 |
| IGR J060582755 | 4100 | 7.7 |
| Swift J0845.03531 | 7400 | 69 |
| IGR J09094+2735 | 1800 | 1.4 |
| PKS 1143696 | 3500 | 42 |
| IGR J12107+3822 | 5900 | 3.5 |
| IGR J131687157 | 11500 | 59 |
| IGR J13187+0322 | 7500 | 200 |
| Swift J1513.88125 | 10300 | 79 |
| IGR J153113737 | 2800 | 9.2 |
| IGR J18078+1123 | 11000 | 58 |
| 1RXS J191928.5295808 | 3800 | 16 |
| 1RXS J211928.4+333259 | 2800 | 0.7 |
| 1RXS J213944.3+595016 | 2300 | 4.9 |
| IGR J22292+6647 | 4700 | 12 |
4.4 Statistical considerations
We again update the statistics of Papers V-VII with the results from the sample presented here and other spectroscopic optical and NIR identifications of INTEGRAL sources (Zurita Heras et al. 2009; Mescheryakov et al. 2009; Burenin et al. 2009a,b; Degenaar et al. 2010).
We find that the 177 INTEGRAL sources identified until now on the basis of their optical or NIR spectroscopy are distributed into the main broad classes discussed in this paper as follows: 105 (59.3%) are AGNs, 49 (27.7%) are X–ray binaries, and 22 (12.4%) are CVs. Only 1 case (0.6%) does not belong to any of the above categories, the identification of IGR J080236954 being a chromospherically active star (see Paper VI and Rodriguez et al. 2010).
Studying the AGN subcategories in greater detail, one can see that 52 sources (i.e., 49% of the AGN identifications) are broad-line AGNs, 42 (40%) are narrow-line AGNs, while the QSO, XBONG, and BL Lac subclasses are populated by 4, 4, and 3 objects (4%, 4%, and 3%), respectively.
For the Galactic objects, it is found that 38 and 11 objects (76% and 24% of the X–ray binary identifications) are HMXBs and LMXBs, respectively; in addition, 22 sources are classified as CVs, most of which (18, that is 82% of them) are definite or likely dwarf novae (mostly of magnetic type), and the remaining 4 are symbiotic stars.
In this paper, we can provide a general overview of these statistics and compare them with those of our previous works (Papers V-VII). In particular, and as already briefly discussed in our previous papers, we focus on the evolution of the source populations. In terms of percentage, we see that AGNs still constitute the vast majority of the identifications, and continue to increase relative to the numbers of Paper VII; in contrast, the total percentage of objects identified as X–ray binaries decreased, while those identified as CVs remain basically unchanged but still represent the third largest group of INTEGRAL sources identified from their optical/NIR spectroscopy.
The majority of AGNs in the sample of optical identifications of INTEGRAL sources can indeed be partly explained by an observational bias: for instance, we have already emphasized in Paper VII that NIR spectroscopy more easily identifies Galactic X–ray binaries, probably because of their larger obscuration in optical bands due to their location in the Galactic plane; likewise, X–ray timing studies of course are more effective in discovering Galactic compact objects (see e.g. Walter et al. 2006). The increasing percentage of AGN discoveries may also be due to the change in the INTEGRAL observational strategy during the spacecraft lifetime, as it now maps more and more frequently the sky outside the Galactic plane (see Bird et al. 2010).
Among the X–ray binaries, the percentage of LMXB discoveries continues to slightly increase with time, possibly thanks to high-precision positional information afforded at soft X–rays coupled with deep optical/NIR imaging and spectroscopy acquired at large (8-m size) telescopes (see e.g. Degenaar et al. 2010).
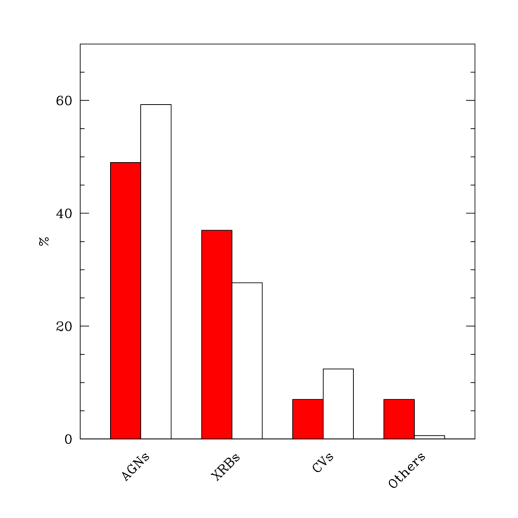
One can compare the latest percentages (see Fig. 14) with those of the 513 identified objects belonging to the deepest and most complete survey of the hard X–ray sky performed by INTEGRAL to date, that is, the 4th IBIS survey of Bird et al. (2010). This catalog contains, among the securely identified sources, 251 (49%) AGNs, 190 (37%) X–ray binaries (nearly equally divided into LMXBs and HMXBs), and 36 (7%) CVs, almost all of them of magnetic nature.
Comparisons of the relative percentages of these subclasses within the identified objects in the 4th IBIS survey of Bird et al. (2010) with the sources identified from optical/NIR spectroscopy until now has confirmed, as noted in Papers V-VII, that this latter method is very effective in detecting AGNs and, to a lesser extent, CVs.
In a similar energy range as IBIS, the Swift/BAT instrument provides a comparable distribution of the hard X–ray source population in the different classes (Cusumano et al. 2010; Tueller et al. 2010), with a slightly larger fraction of AGNs (60%) and a smaller fraction of X–ray binaries (25%) than in the 4th IBIS survey. These differences between the IBIS and BAT surveys can be attributed to different (and, to some extent, complementary) spacecraft observational strategies, INTEGRAL being mainly dedicated to Galactic plane scans and Swift covering more of the ecliptic pole regions and the sky outside the Galactic plane (see Bird et al. 2010, Cusumano et al. 2010, and Tueller et al. 2010 for details).
Returning to the sources identified in the present work, we found that for the first time two definite LINER-type AGNs are identified among the group of INTEGRAL sources of unknown nature. We also identified a non-magnetic CV within the sample selected in the present paper: to our knowledge, this is the first CV belonging to the lot of unidentified INTEGRAL objects that does not have properties that are indicative of accretion onto a WD with magnetic activity. These discoveries may be the result of the latest IBIS surveys (Bird et al. 2010; Krivonos et al. 2010) being the deepest obtained with this instrument and among the deepest and most complete investigations of the whole hard X–ray sky above 20 keV, hence permitting the detection of intrinsically faint objects at these energies.
5 Conclusions
As part of our ongoing identification program of INTEGRAL sources by means of optical spectroscopy (Papers I-VII) that has been employing various telescopes since 2004, we have identified and studied 44 additional objects of unknown or poorly explored nature belonging to surveys of the hard X–ray sky (Bird et al. 2010; Krivonos et al. 2010; Bozzo et al. 2010; Coe et al. 2010; McBride et al. 2010). This has been made possible by using 7 different telescopes and archival data from 2 spectroscopic surveys.
We found that the selected sample consists of 32 AGNs (17 of which are Seyfert 1 galaxies, 11 are Seyfert 2 galaxies, 2 are LINERs, one is an XBONG, and one is a Type 1 QSO), 6 CVs (one of which is very likely of non-magnetic nature), 5 HMXBs (two of which belong to the SMC, two being Galactic Be/X binaries, and one being possibly a supergiant B[e]/X–ray binary), and one LMXB. In the present sample, as in our past papers within the framework of this research, we note that the absolute majority of identified sources belongs to the AGN class, and we detect a non-negligible presence of CVs.
We note that 148 of the 177 optical and NIR spectroscopic identifications considered in this subsection were obtained or refined within the framework of our spectroscopic follow-up program originally set up in 2004 (Papers I-VII, the present work, and references therein).
The results presented in this work once again demonstrate the high effectiveness of the method of catalog cross-correlation and/or follow-up observations (especially with soft X–ray satellites capable of providing arcsec-sized error boxes, such as Chandra, XMM-Newton or Swift), and optical spectroscopy to determine the actual nature of still unidentified INTEGRAL sources. We however recall that, for 11 objects of our present sample, only a putative albeit likely optical counterpart could be identified because of the lack of soft X–ray observations providing a definite arcsec-sized position at high energies. Thus, these INTEGRAL sources should be timely observed by soft X–ray satellites affording arcsec-sized localizations to confirm the proposed associations.
Present and future surveys at optical and NIR wavelengths, such as the ongoing Vista Variables in the Via Lactea (VVV; Minniti et al. 2010) public NIR survey, will permit us to check and identify variable objects in the fields of the objects detected in published and forthcoming INTEGRAL catalogs, thus easing the search for putative counterparts to these high-energy sources.
Acknowledgements.
We thank Silvia Galleti for Service Mode observations at the Loiano telescope; Hripsime Navasardyan for Service Mode observations at the Asiago telescope; Antonio Magazzù for Service Mode observations at the TNG; Manuel Hernández and José Velásquez for Service Mode observations at the CTIO telescope, and Fred Walter for relaying the observing information to them; Roberto Gualandi and Ivan Bruni for night assistance at the Loiano telescope; Gaspare Lo Curto for support at the ESO NTT telescope; Claudia Reyes for night assistance at the ESO NTT telescope. We also thank the anonymous referee for useful remarks which helped us to improve the quality of this paper. This research has made use of the ASI Science Data Center Multimission Archive; it also used the NASA Astrophysics Data System Abstract Service, the NASA/IPAC Extragalactic Database (NED), and the NASA/IPAC Infrared Science Archive, which are operated by the Jet Propulsion Laboratory, California Institute of Technology, under contract with the National Aeronautics and Space Administration. This publication made use of data products from the Two Micron All Sky Survey (2MASS), which is a joint project of the University of Massachusetts and the Infrared Processing and Analysis Center/California Institute of Technology, funded by the National Aeronautics and Space Administration and the National Science Foundation. This research has also made use of data extracted from the Six-degree Field Galaxy Survey and the Sloan Digitized Sky Survey archives; it has also made use of the SIMBAD database operated at CDS, Strasbourg, France, and of the HyperLeda catalog operated at the Observatoire de Lyon, France. The authors acknowledge the ASI and INAF financial support via grant No. I/008/07. LM is supported by the University of Padua through grant No. CPDR061795/06. VC is supported by the CONACYT research grant 54480-F (México). DM is supported by the Basal CATA PFB 06/09, and FONDAP Center for Astrophysics grant No. 15010003. GG is supported by Fondecyt grant No. 1085267.References
- (1) Adelman-McCarthy, J.K., Agüeros, M.A., Allam, S.S., et al. 2007, ApJS, 172, 634
- (2) Assafin, M., Andrei, A.H., Vieira Martins, R., et al. 2001, ApJ, 552, 380
- (3) Bassani, L., Dadina, M., Maiolino, R., et al. 1999, ApJS, 121, 473
- (4) Baumgartner, W.H., Tueller, J., & Mushotzky, R.F. 2008, ATel 1794
- (5) Bianchi, S., Corral, A., Panessa, F., et al. 2008, MNRAS, 385, 195
- (6) Bird, A.J., Bazzano, A., Bassani, L., et al. 2010, ApJS, 186, 1
- (7) Bozzo, E., Ferrigno, C., Coe, M.J., et al. 2009, ATel #2079
- (8) Burenin, R.A., Bikmaev, I.F., Revnivtsev, M.G., et al. 2009, Astron. Lett., 35, 71
- (9) Burenin, R., Makarov, D., Uklein, R., Revnivtsev, M., & Lutovinov, A. 2009, ATel #2193
- (10) Butler S.C., Tomsick, J.A., Chaty, S., et al. 2009, ApJ, 698, 502
- (11) Cardelli, J.A., Clayton, G.C., & Mathis, J.S. 1989, ApJ, 345, 245
- (12) Coe, M.J., Bird, A.J., McBride, V.A., et al. 2009, ATel #2088
- (13) Coe, M.J., Bird, A.J., Buckley, D.A.H., et al. 2010, MNRAS, in press [arXiv:1004.2219]
- (14) Comastri, A., Mignoli, M., Ciliegi, P., et al. 2002, ApJ, 571, 771
- (15) Condon, J.J., Cotton, W.D., Greisen, E.W., et al. 1998, AJ, 115, 1693
- (16) Corbet R.H.D., Barthelmy, S.D., Baumgartner, W.H., et al. 2010, ATel #2598
- (17) Cusumano, G., Segreto, A., La Parola, V., et al. 2010, A&A, 510, A48
- (18) de Martino, D., Falanga, M., Bonnet-Bidaud, J.-M., et al. 2010, A&A, 515, A25
- (19) Degenaar, N., Jonker, P.G., Torres, M.A.P., et al. 2010, MNRAS, 404, 1591
- (20) Demers, S., & Irwin, M.J. 1991, A&AS, 91, 171
- (21) Deutsch, E.W. 1999, AJ, 118, 1882
- (22) Filliatre P., & Chaty, S. 2004, ApJ, 616, 469
- (23) Harries, T.J., Hilditch, R.W., & Howarth, I.D. 2003, MNRAS, 339, 157
- (24) Heckman, T.M. 1980, A&A, 87, 152
- (25) Ho, L.C., Filippenko, A.V., & Sargent, W.L.W. 1993, ApJ, 417, 63
- (26) Ho, L.C., Filippenko, A.V., & Sargent, W.L.W. 1997, ApJS, 112, 315
- (27) Horne, K. 1986, PASP, 98, 609
- (28) Jones, D.H., Saunders, W., Colless, M., et al. 2004, MNRAS, 355, 747
- (29) Jones, D.H., Saunders, W., Read, M., Colless, M. 2005, PASA, 22, 277
- (30) Kaspi, S., Smith, P.S., Netzer, H., et al. 2000, ApJ, 533, 631
- (31) Kauffmann, G., Heckman, T.M., Tremonti, C., et al. 2003, MNRAS, 346, 1055
- (32) Kniazev, A., Revnivtsev, M., Burenin, R., & Tkacenko, A. 2010, ATel #2457
- (33) Krivonos, R., Tsygankov, S., Sunyaev, R., et al. 2009, ATel #2170
- (34) Krivonos, R., et al. 2010, submitted
- (35) La Parola, V., Cusumano, G., Romano, P., et al., MNRAS, 405, L66
- (36) Landi, R., Stephen, J.B., Masetti, N., et al. 2009, A&A, 493, 893
- (37) Landi, R., Bassani, L., Malizia, A., et al. 2010, MNRAS, 403, 945
- (38) Lang, K.R. 1992, Astrophysical Data: Planets and Stars. Springer-Verlag, New York
- (39) Laurent-Muehleisen, S.A., Kollgaard, R.I., Ciardullo, R., et al. 1998, ApJS, 118, 127
- (40) Leitch, E.M., & Vasisht, G. 1998, New Astronomy, 3, 51
- (41) Leitherer, C. 1988, ApJ, 326, 356
- (42) Malizia, A., Landi, R., Bassani, L., et al. 2007, ApJ, 668, 81
- (43) Masetti, N., & Schiavone, F. 2008, IASF-Bologna Internal Report No. 522/2008
- (44) Masetti, N., Palazzi, E., Bassani, L., Malizia, A., & Stephen, J.B. 2004, A&A, 426, L41 (Paper I)
- (45) Masetti, N., Mason, E., Bassani, L., et al. 2006a, A&A, 448, 547 (Paper II)
- (46) Masetti, N., Pretorius, M.L., Palazzi, E., et al. 2006b, A&A, 449, 1139 (Paper III)
- (47) Masetti, N., Bassani, L., Bazzano, A., et al. 2006c, A&A, 455, 11 (Paper IV)
- (48) Masetti, N., Morelli, L., Palazzi, E., et al. 2006d, A&A, 459, 21 (Paper V)
- (49) Masetti, N., Landi, R., Pretorius, M.L., et al. 2007, A&A, 470, 331
- (50) Masetti, N., Mason, E., Morelli, L., et al. 2008a, A&A, 482, 113 (Paper VI)
- (51) Masetti, N., Mason, E., Landi, R., et al. 2008b, A&A, 480, 715
- (52) Masetti, N., Parisi, P., Palazzi, E., et al. 2009, A&A, 495, 121 (Paper VII)
- (53) Masetti, N., Parisi, P., Palazzi, E., et al. 2010, Int. J. of Mod. Phys. D, in press [arXiv:1002.1076]
- (54) Massey, P. 2002, ApJS, 141, 81
- (55) Mauch, T., Murphy, T., Buttery, H.J., et al. 2003, MNRAS, 342, 1117
- (56) McBride, V.A., Bird, A.J., Coe, M.J., et al. 2010, MNRAS, 403, 709
- (57) Mescheryakov, A., Burenin, R., Sazonov, S., et al. 2009, ATel #2132
- (58) Minniti, D., Lucas, P.W., Emerson, J.P., et al. 2010, New Astronomy, 15, 433
- (59) Monet, D.G., Levine, S.E., Canzian, B., et al. 2003, AJ, 125, 984
- (60) Murphy, T., Mauch, T., Green, A., et al. 2007, MNRAS, 382, 382
- (61) Osterbrock, D.E. 1989, Astrophysics of Gaseous Nebulae and Active Galactic Nuclei (Mill Valley: Univ. Science Books)
- (62) Osterbrock, D.E., & Pogge, R.W. 1985, ApJ, 297, 166
- (63) Panessa, F., & Bassani, L. 2002, A&A, 394, 435
- (64) Pettersson, B. 1987, A&AS, 70, 69
- (65) Pretorius, M.L. 2009, MNRAS, 395, 386
- (66) Prugniel, P. 2005, The Hyperleda Catalog, http://leda.univ-lyon1.fr
- (67) Rahoui, F., Chaty, S., Lagage, P.-O., & Pantin, E. 2008, A&A, 484, 801
- (68) Rodriguez, J., Tomsick, J.A., & Chaty, S. 2009, A&A, 494, 417
- (69) Rodriguez, J., Tomsick, J.A., & Bodaghee, A. 2010, A&A, in press [arXiv:1003.3741]
- (70) Saxton R.D., Read, A.M., Esquej, P., et al. 2008, A&A, 480, 611
- (71) Schlegel, D.J., Finkbeiner, D.P., & Davis, M. 1998, ApJ, 500, 525
- (72) Skrutskie, M.F., Cutri, R.M., Stiening, R., et al. 2006, AJ, 131, 1163
- (73) Stephen, J.B., Bassani, L., Malizia, A., et al. 2006, A&A, 445, 869
- (74) Tomsick, J.A., Chaty, S., Rodriguez, J., Walter, R., & Kaaret, P. 2009, ApJ, 701, 811
- (75) Townsend, L.J., Corbet, R.H.D., Coe M.J., et al. 2009, ATel #2202
- (76) Tueller, J., Baumgartner, W.H., Markwardt, C.B., et al. 2010, ApJS, 186, 378
- (77) Ubertini, P., Lebrun, F., Di Cocco, G., et al. 2003, A&A, 411, L131
- (78) van Paradijs, J., & McClintock, J.E. 1995, Optical and ultraviolet observations of X–ray binaries, in: X–ray Binaries, ed. W.H.G. Lewin, J. van Paradijs, & E.P.J. van den Heuvel (Cambridge: Cambridge University Press), p. 58
- (79) Veilleux, S., & Osterbrock, D.E. 1987, ApJS, 63, 295
- (80) Vestergaard, M. 2004, Black-Hole Mass Measurements, in: AGN Physics with the Sloan Digital Sky Survey, ed. G.T. Richards & P.B. Hall, ASP Conf. Ser., 311, 69 (San Francisco: Astronomical Society of the Pacific)
- (81) Voges, W., Aschenbach, B., Boller, T., et al. 1999, A&A, 349, 389
- (82) Voges, W., Aschenbach, B., Boller, T., et al. 2000, IAU Circ. 7432
- (83) Walter, R., Zurita Heras, J., Bassani, L., et al. 2006, A&A, 453, 133
- (84) Warner, B. 1995, Cataclysmic variable stars (Cambridge: Cambridge University Press)
- (85) Wegner, W. 1994, MNRAS, 270, 229
- (86) Winkler, H. 1992, MNRAS, 257, 677
- (87) Winkler, C., Courvoisier, T.J.-L., Di Cocco, G., et al. 2003, A&A, 411, L1
- (88) Wright, E.L. 2006, PASP, 118, 1711
- (89) Wu, X.-B., Wang, R., Kong, M.Z., Liu, F.K., & Han, J.L. 2004, A&A, 424, 793
- (90) Zurita Heras, J.A., Chaty, S., & Tomsick, J.A. 2009, A&A, 502, 787