Adsorption structures of phenol on the Si(001)-(21) surface calculated using density functional theory
Abstract
Several dissociated and two non-dissociated adsorption structures of the phenol molecule on the Si(001)-(21) surface are studied using density functional theory with various exchange and correlation functionals. The relaxed structures and adsorption energies are obtained and it is found that the dissociated structures are energetically more favourable than the non-dissociated structures. However, the ground state energies alone do not determine which structure is obtained experimentally. To elucidate the situation core level shift spectra for Si and C states are simulated and compared with experimentally measured spectra. Several transition barriers were calculated in order to determine which adsorption structures are kinetically accessible. Based on these results we conclude that the molecule undergoes the dissociation of two hydrogen atoms on adsorption.
I Introduction
Adsorption of organic molecules on semiconducting surfaces provides a potential way to produce smaller transistors Bent (2002); Zhou and Leung (2006a, b). While there have been many studies concerning adsorption of benzene and related molecules on semiconductors there are surprisingly few studies concerning phenol adsorption. The OH group gives rise to dissociative reaction possibilities, in addition to the non-dissociative adsorption observed for benzene.
Casaletto et al. Casaletto et al. (2005) studied phenol adsorption on silicon using photoemission spectroscopy. Based on measurements of core level shifts (CLS) of the surface Si states and C states they concluded that phenol undergoes dissociative adsorption at room temperature and that in the adsorbed state the phenyl ring is bonded to the surface via the O atom (see structure D in Fig. 1). However, since the structure cannot be directly observed it is possible that other structures could also fit the data.
The theoretical study by Carbone et al. Carbone et al. (2007) focused on possible adsorption sites for the non-dissociated butterfly structure (structure A in Fig. 1) and the above-mentioned dissociative structure. They looked at possible reaction paths between the structures and found that the conversion barrier is of the same order as the room temperature thermodynamic energy. Other adsorption structures were not considered.
In this article we report density functional calculations of a variety of phenol adsorption structures, which includes structures that were not discussed in Refs. Casaletto et al., 2005; Carbone et al., 2007. In particular, we show that those structures should be included in the analysis. The paper is organised as follows. In section II we describe the methodology, in section III we present the structural data and adsorption energies of the various structures and calculate the core level shifts of the energetically most favored structures. The transition barriers to several adsorption states were calculated to determine which states are kinetically accessible. The results are discussed and summarised in section IV.
II Method
Adsorption energies calculated using density functional theory are known to depend remarkably on the exchange-correlation (XC) functional Hammer et al. (1999). In order to understand this dependence more fully, we perform calculations using the generalized gradient functionals (GGA), PW91 Perdew (1991); Perdew et al. (1996a), PBE Perdew et al. (1996b, 1997, 1998a) and revPBE Perdew et al. (1996b); Zhang and Yang (1998); Perdew et al. (1998b), the three-parameter hybrid functional B3LYP Becke (1988); Lee et al. (1988) and the van der Waals density functional (vdW-DF) that includes non-local correlation to describe van der Waals interactions Dion et al. (2004).
The PW91, PBE and revPBE calculations are performed using the Vienna ab-initio simulation package (VASP) Kresse and Hafner (1993); Kresse and Furthmüller (1996), which is based on density functional theory (DFT) and uses a plane-wave basis set. In the plane-wave calculations the core states are represented using the projector-augmented wave (PAW) method Blöchl (1994); Kresse and Joubert (1999) and the plane-wave cutoff energy is 400 eV.
The B3LYP calculations are performed using an all-electron approach implemented in the LCAO (linear combination of atomic orbitals) code, CRYSTAL Dovesi et al. (2006). We use the valence triple- plus polarisation basis set for all atoms. The basis set for silicon was obtained by optimisation of the total energy of bulk silicon in Ref. Porter et al., 1999. The basis sets for the remaining atoms acquired from Ref. Godbout et al., 1992 were orginally developed for atoms and molecules. In the present work, they are adapted for periodic calculations by increasing the exponent of the outermost p-type shell of C atom from 0.0892605 to 0.13. This shrinks computational expenses and helps to avoid numerical problems such as quasi-linear dependence of basis functions Dovesi et al. (2006).
In order to estimate the basis set superposition error (BSSE) in LCAO adsorption calculations, the counterpoise correction Boys and Bernardi (1970) is used. Its magnitude ranges from 0.24 eV to 0.44 eV for structures A–F and from 0.60 eV to 0.75 eV for structures G and H shown in Fig. 1. This is a substantial correction and, therefore, the adsorption energies in the present paper always include it. Nevertheless, even with the BSSE correction, a low quality basis set can yield energies far from the complete basis limit so we checked the performance of the basis set by comparing the PBE adsorption energies obtained with the LCAO and plane-wave approaches. As shown in Table 1, the two methods give very similar results in all cases, except for structure H, where the difference in the adsorption energies is 0.26 eV. The BSSE introduces artifacts in the interaction between neighbouring phenyl-rings that strongly affects the energy and, due to the flexibility of the Si–O–C bonds, the molecule moves away from the true energy minimum. This problem cannot be resolved by a perturbative correction, however, if the basis set is expanded the relaxed structure changes and the LCAO adsorption energy starts to approach the plane-wave result. Consequently, this single case with a moderately large discrepancy is understood and the match between the LCAO and the plane-wave basis results for the other structures is good. With this in mind, we conclude that our LCAO results are reliable.
The van der Waals corrections to the adsorption energies are calculated using the real-space approach described in Ref. Gulans et al., 2009 combined with the multi-centre integration method Becke (1992). Following Ref.Dion et al., 2004, we use the revPBE functional Zhang and Yang (1998) to describe the exchange. The total vdW-DF energy is calculated non-self-consistently as a post-GGA correction and is given by
| (1) |
where is the total energy obtained in a self-consistent calculation with the revPBE XC functional. The next two terms, and , are the LDA Perdew and Wang (1992) and PBE correlation energies, respectively. Their difference is calculated non-self-consistently using the PAW formalism. Finally, is the non-local correlation term, which is evaluated using pseudo densities with the partial core correction.
In all calculations we use the equilibrium Si lattice constant , which is 5.47–5.49 Å depending on XC functional used. The Si(001) surface is represented by nine atomic layers of Si atoms with the top side (21)-reconstructed and the bottom layer Si atoms fixed in ideal lattice positions with their dangling bonds passivated by H atoms. The positions of the Si atoms on the bottom layer and the passivating H atoms are held fixed. In our VASP calculations, the supercell size for the 0.5 monolayer (ML) coverage1111 ML is defined here as 1 molecule per Si dimer is , which contains a vacuum layer with a height of approximately 22 Å. To check that there is no effect due to an artificial electric field, caused by using an asymmetric slab, structure D was recalculated with thicker vacuum layers. The change in the total energy on going from 22 Å to 38 Å was only 0.004 eV. The CRYSTAL code employs the periodic boundary conditions only along the surface directions and hence the calculation does not include an artificial electric field in the vacuum. The Brillouin zone is sampled using a Monkhorst-Pack mesh of 441 k-points. The ionic relaxations are stopped when the maximum force on the ions is below 10 meV/Å.
To determine the transition states and barriers for the structural changes we use the adaptive nudged elastic band (ANEB) method Maragakis et al. (2002). This calculation is essentially a search for the saddle points of the potential energy surface and all obtained transition states satisfy the same maximum force criterion as above. The total energy and its gradients are evaluated using the PBE XC functional. Due to the computational expense of these calculations we use thinner silicon slabs consisting of 5 layers of Si atoms and the Monkhorst-Pack mesh of 221 -points. This simplification results in changes in adsorption energies that are less than 0.07 eV.
For a semi-quantitative analysis of reactions rate constants we use the Arrhenius equation for the reaction rate constant
| (2) |
is the energy barrier obtained from the ANEB calculations. In our estimates we use the temperature K, which is consistent with the experimental conditions in Ref. Casaletto et al., 2005. The pre-exponential factor is related to atomic vibrations and is assumed to be a constant. We have used a value of s-1, which is typical for reactions on surfaces. There are common inexpensive ways of estimating , for example, using harmonic transition state theory, however, we have chosen to use a constant pre-exponential factor, since the right hand side of Eq. 2 is much less sensitive to variations in than in .
III Results and Discussion
III.1 Structural data
The various adsorption structures are shown in Fig. 1. Structures A–F have a coverage of 0.5 ML, whereas G and H correspond to C and D at a higher coverage of 1.0 ML. The position of the OH group and/or dissociated H atoms corresponds to the energetically favorable position for each morphology. The discussion of energy barriers in subsection III.4 involves structures A’, D’, E’ and F’, which are not shown in Fig. 1. They are similar to structures A, D, E and F, respectively, but with the phenol molecule or with dissociated H atoms bonded to different sites. For instance, a phenol molecule in structure A is bound to one Si dimer, whereas in structure A’ it is bound to Si atoms on adjacent dimers.
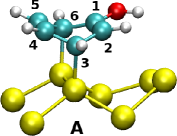
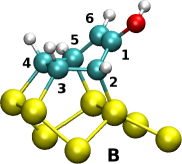
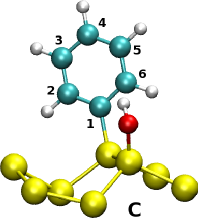
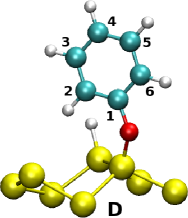
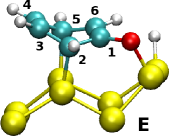
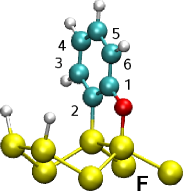
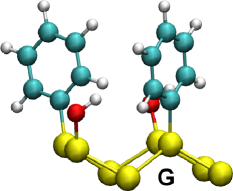
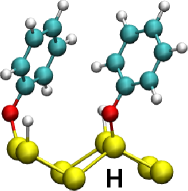
Structures A and B are non-dissociated and are similar to the butterfly (BF) and tight-bridge (TB) structures of benzene on the Si(001)-(21) surfaceTaguchi et al. (1991); Wolkow et al. (1998). In both structures A and B, the OH group remains bonded to a carbon atom. In structure C the OH group is dissociated from the phenyl ring, and the OH group and the phenyl ring are bonded to Si atoms on the same dimer. In structure D the O–H bond is broken and the C6H5O- radical and the dissociated H atom bond to Si atoms on the same dimer. Structure E is similar to A, but the O–H bond is broken and the O and H atoms are bonded to the Si dimer neighbouring the phenyl ring. The O–Si bond is slightly stretched compared to structures C and D due to the structural constraints. In structure F the O–H bond and the neighbouring C–H bond are broken and the two dissociated H atoms are adsorbed on the other Si dimer. Similarly to structure E, the structural constraints result in a slightly longer Si–O bond compared to the free Si–O bond in structure C and D. Structures G and H correspond to C and D but with 1.0 ML coverage. The nearest neighbour phenyl rings are orthogonal with respect to each other. Parallel orientation is energetically less favorable.
III.2 Adsorption energies
III.2.1 Neglecting van der Waals interactions
The phenol adsorption energy is defined as
| (3) |
where , are the total energies of the separate phenol molecule and the Si slab, respectively, and is the total energy of the phenol molecule adsorbed on the Si-slab. The results obtained using the various XC functionals for the different structures are shown in Table 1.
| Standard GGA | Hybrid | Non-local | ||||
| Structure | PW91 | PBE | revPBE | PBE111LCAO | B3LYP111LCAO | vdW-DF |
| A | 1.06 | 1.01 | 0.57 | 0.97 | 0.66 | 1.26 |
| B | 1.27 | 1.24 | 0.75 | 1.26 | 0.80 | 1.23 |
| C | 2.96 | 2.88 | 2.65 | 2.78 | 3.00 | 3.40 |
| D | 2.38 | 2.30 | 2.09 | 2.32 | 2.58 | 2.82 |
| E | 2.61 | 2.52 | 2.04 | 2.47 | 2.41 | 2.91 |
| F | 3.89 | 3.78 | 3.20 | 3.81 | 4.29 | 4.12 |
| G | 5.85 | 5.68 | 5.03 | 5.18 | 5.52 | 7.16 |
| H | 4.82 | 4.64 | 4.13 | 4.40 | 4.92 | 6.07 |
The choice of the XC functional is known to influence adsorption energies significantly Hammer et al. (1999). PW91 and PBE have been found to give significantly higher adsorption energies than revPBE. For the non-dissociated phenol structures A and B, the PBE adsorption energies are almost twice as large as those obtained with revPBE functional. For the remaining 0.5 ML structures, the PW91 and PBE energies are larger than the revPBE energies by 0.29 eV–0.69 eV. Despite these quantitative differences, the energetic ordering for both GGA functionals is mostly the same. The dissociated structures are significantly lower in energy than the non-dissociated structures. This trend has been found previously for benzene Nunzi et al. (2007) and for chloro- and dichlorobenzene Naumkin et al. (2003).
For a 0.5 ML coverage, the energetically most favorable structure is F, which is by 0.8–0.9 eV lower in energy than the next lowest energy structure C. However, according to the revPBE calculations D is 0.15 eV more favorable than E, whereas according to PW91 and PBE calculations E is 0.22-0.23 eV more favorable than D. Carbone et al. Carbone et al. (2007) used first-principles calculations with the BLYP functional Becke (1988); Lee et al. (1988) to study structures A and D on various adsorption sites and found the adsorption energies of 0.55 eV and 2.56 eV, respectively. This is in good agreement with our B3LYP results and the small differences are presumably due to the differences between BLYP and B3LYP functionals and the different coverages of ML and 0.5 ML used in their and the present calculations, respectively.
The gain in energy due to the deposition is largely determined by the number of phenol molecules attached to the surface and it is limited by the available area. In structures E and F the maximum coverage has been reached already, while for structures C and D the number of adsorbed molecules can be doubled to form structures G and H. Such an increase in coverage results in a gain of energy per surface unit, making G energetically favorable for all considered functionals.
III.2.2 Including van der Waals interactions
As shown in Table 1, van der Waals forces make the adsorption energies of A and B comparable, in contrast to the standard GGA results that predict the B to be more energetically favorable than A. This is in agreement with the recent results for benzene on the same silicon surfaceJohnston et al. (2008). Despite qualitative similarities, the present adsorption energies of phenol and those of benzene in Ref. Johnston et al., 2008 differ by eV. Such a difference cannot be explained by a substitution of an H atom with the OH group. We address this problem by repeating the calculations of Ref. Johnston et al., 2008 within the present calculation scheme. The adsorption energies shown in Table 2 imply that the differences are of a numerical nature in evaluating the vdW correction. An analysis of the electron densities used by Johnston et al. in their calculations, reveals that the source of the discrepancy is the term , which was calculated using the non-linear core correction, while in the present paper the PAW formalism is used. Since the latter one is an all-electron method, we believe that the present results are more reliable.
The reversal in the ordering is also observed for structures D and E. However, since there is a disagreement among the GGA functionals concerning the relative stability of these geometries we cannot draw any firm conclusions.
Another interesting observation is that the high-coverage structures G and H have a higher adsorption energy per molecule than that of the corresponding low coverage structures C and D when the van der Waals interaction is included. The distance between the centres of neighbouring phenyl rings in structures G and H is 5.5 Å, which is just slightly larger than the equilibrium distance between the molecules in an isolated benzene dimer in the T-shape and slip parallel configurations Puzder et al. (2006). Due to such a geometrical layout on the Si(001)-() surface, the interaction of phenol molecules is attractive.
In all cases the magnitude of the correction due to the van der Waals interaction (the last three terms in Eq.(1)) is of the order of 0.48–1.07 eV per adsorbed molecule. The corrections are both large and scattered meaning that, in general, the correction may heavily influence the predictions for this kind of adsorbates.
| Benzene | Phenol | |||
|---|---|---|---|---|
| Method | BF | TB | A | B |
| PW91 | 1.00(0.99) | 1.25(1.24) | 1.06 | 1.27 |
| PBE | 0.96(0.92) | 1.24(1.19) | 0.97 | 1.26 |
| revPBE | 0.53(0.48) | 0.72(0.66) | 0.57 | 0.75 |
| vdW-DF | 1.13(0.82) | 1.15(0.77) | 1.26 | 1.23 |
III.3 Core level shifts
At this stage we focus on the dissociated structures and neglect structures A and B. So far, the results show that, for a coverage of 0.5 ML, C and F are more stable than D and that E has an energy comparable to that of D. At high phenol exposure, corresponding to increased coverage, structure G becomes the energetically favourable one. In this subsection we attempt to determine the experimentally observed structure by calculating the CLS spectra for each structure.
The experimental study by Casaletto et al. Casaletto et al. (2005) used X-ray photoemission spectroscopy (XPS) to measure the CLSs for the Si , C , and O core states. In the present work, C and Si CLSs for structures C–F and H (the omission of G is explained below) are calculated and compared with experimental data. In calculating the core-level shifts, we use the method described in Ref. Yazyev and Pasquarello, 2006, where a pseudopotential for an atom core with a hole is constructed. Then, in the supercell calculation, an electron is removed from the system and a homogeneous background charge is applied to keep the system neutral. We use VASP with the PW91 functional for these calculations. To calculate the relative C CLSs for phenol on the Si(001)-(21) we use a nine atomic layer Si slab with the H-passivation on the bottom surface as described above. The Si 2 CLSs were found to be much more sensitive to the slab thickness than the structural properties and energies are. Thus, to obtain converged Si 2 CLSs we used slabs with 17 layers of Si atoms.
III.3.1 C core level shifts
Table 3 shows the C CLSs for structures C–F and H. It is clear from the results for D and H that the coverage does not affect the C CLS, therefore, we have not calculated the CLSs for G as the results would be equal to those for C. For each structure, the average core level binding energy of the carbon atoms -bonded to two other carbon atoms and to one hydrogen atom is taken as the reference energy.
| C | D | E | F | H | Model, Ref. Casaletto et al.,2005 | |
|---|---|---|---|---|---|---|
| C1 | 1.5 | |||||
| C2 | 0 | |||||
| C3 | 0 | |||||
| C4 | 0 | |||||
| C5 | 0 | |||||
| C6 | 0 |
Experiments by Casaletto et al. Casaletto et al. (2005) showed two peaks, which were attributed to the carbon atoms in the phenyl-ring and the carbon atom bonded to the oxygen atom. Based on the magnitude of the shift and the ratio of 1:5 of the integrated intensity, Casaletto et al. concluded that the structure D was observed. According to our calculations, the spectra of structures D–F and H all have one CLS around 1.6–1.7 eV with respect to the reference energy. For structures D and H the remaining five CLSs are positioned in the narrow range, to eV. Such a compact grouping can be explained by almost equivalent nearest neighbour surroundings of the carbon atoms labelled with numbers 2–6 in Fig. 1. This is not the case for structures E and F, in which some of the carbon atoms are bonded to silicon atoms and have different environments than the other carbon atoms. Consequently the spectra contain CLSs that are shifted from the reference energy by – eV and eV for E and F, respectively.
Although there are spectral features unique to each of structures C, D, E and F, they are not necessarily resolvable in experiment. In order to compare the calculated results directly to experiment, we plotted the core level shifts using Gaussian functions with the experimental FWHM of 1.0 eV. The curves are shown in Fig. 2 along with a model function, which was constructed to reproduce the line-shape analysis and experimental data in Ref. Casaletto et al., 2005.
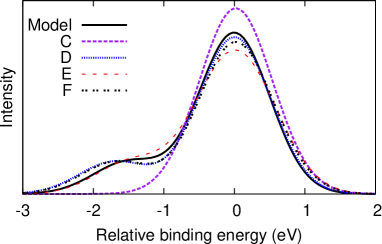
The figure shows clearly that the spectra of structures D (H), E and F qualitatively fit the model function. However, since there is no visible shoulder for structure C (G) we can rule it out.
III.3.2 Si core level shifts
Next, we consider whether it is possible to distinguish between structures D, E, F and H on the basis of the Si surface core level shifts. To extract information about the Si CLSs for the surfaces with adsorbed phenol it is first necessary to calculate the shifts for the clean surface. The CLSs for the clean surface and for structures D, E, F and H are shown in Table 4. For these calculations the silicon slab contains 17 atomic layers and the reference energy is taken to be the core level binding energy averaged over the bulk-like 13th–16th Si layers below the reconstructed surface. The Si 2 CLSs with adsorbed phenol do not agree with the data by Casaletto et al. Casaletto et al. (2005). This is most likely due to their assumption that only the CLSs of the Si atoms on the surface are affected by the phenol adsorption, whereas our calculations clearly show that the SCLSs of the subsurface atoms change significantly.
| Layer | Atom | Clean | D | E | F | H | Expt. Casaletto et al. (2005) |
|---|---|---|---|---|---|---|---|
| 1 | Si up | ||||||
| 1 | Si down | ||||||
| 1 | Si–C2 | ||||||
| 1 | Si–C5 | ||||||
| 1 | Si–O | ||||||
| 1 | Si–O | ||||||
| 1 | Si–H | ||||||
| 1 | Si–H | ||||||
| 2 | Si | ||||||
| 2 | Si | ||||||
| 2 | Si | ||||||
| 2 | Si | ||||||
| 3 | Si | ||||||
| 3 | Si | ||||||
| 3 | Si | ||||||
| 3 | Si | ||||||
| 4 | Si | ||||||
| 4 | Si | ||||||
| 4 | Si | ||||||
| 4 | Si |
Although the curve fitting to the experimental data is inaccurate we can still make use of the raw experimental data as shown in Fig. 3. The experimental curve for the clean surface has three distinct peaks. Due to the spin-orbit splitting of the level two peaks with the intensity ratio of 1:2 and the separation of eV. Casaletto et al. (2005) correspond to each different Si atom environment. The peak at 0.5 eV corresponds to the Si up-dimer atom and disappears as the coverage increases. With the increasing coverage, also the peak at eV develops a shoulder at – eV and a weak peak develops at around eV. The shoulder and the small peak probably belong to the same atoms as their separation is approximately equal to the spin-orbit splitting.
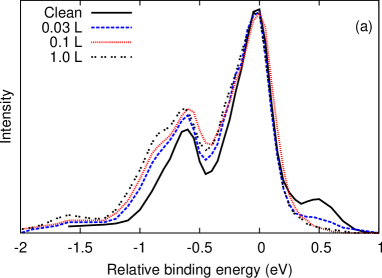

We start by plotting the data for the clean surface and by comparing to experiment. The CLS for each atom is chosen to be a sum of two Gaussian functions with the above-mentioned intensity ratio and energy splitting. The total intensity of the simulated spectruim is then equal to a sum of these split Gaussian functions, i.e.,
| (4) |
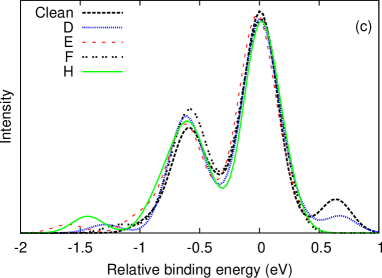
Above, is the the core level shift for atom . is the FWHM, for which we use the value of 0.26 eV. This is the average of the values for bulk and surface atoms used by Casaletto et al. Casaletto et al. (2005). is an attenuation constant, which weakens the contribution from the subsurface layers and is the layer index, so that corresponds to the surface layer, to the subsurface atoms, etc. and are parameters chosen to fit the calculated clean surface spectrum to the experimental one. Using and reproduces well the main features of the experimental curve, as can be seen in Fig. 3. The simulated spectra for structures D, E, F and H in Fig. 3 are calculated using the same parameters as for the clean surface. To analyse our results it is easiest to observe the changes in the spectra for the different structures with respect to the clean surface spectrum.
In our fit the three main peaks are visible although somewhat shifted compared to the experimental data. This is probably due to the reference value of the core level shifts not being equal to the true bulk value. Nevertheless the fit is good enough to compare qualitatively, as shown in Fig. 3. The most obvious change in the curve is the disappearance of the Si up-dimer peak, which implies that the surface is saturated and that no asymmetric dimers remain. This saturation occurs for structures E, F and H but not for D. It is senseless to discuss which structure agrees best with the experimental Si CLS spectrum, since, as explained before, we can make only a qualitative comparison. It is clear that none of the three structures can be ruled out on the basis of the data provided by CLS spectroscopy.
III.4 Reaction barriers
So far we can conclude that any of structures D (H), E or F would be consistent with the experimental core level shift data. To determine which of the conformations are accessible at the room temperature (used for experimental observation) we have calculated the activation energies for different structural transformations of adsorbed phenol molecules as shown in Fig. 4.

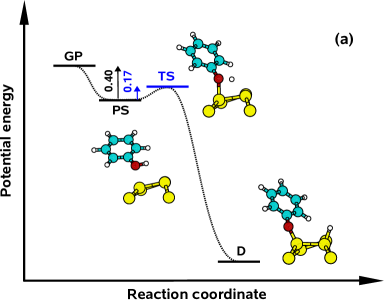
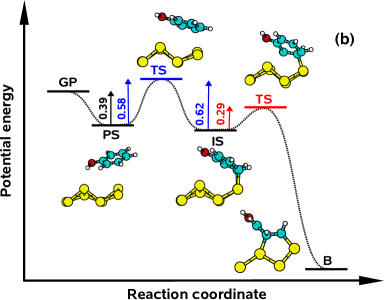
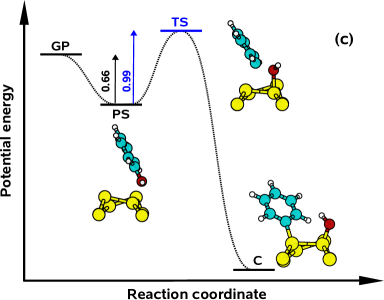
The adsorption reactions starting from the gas phase always involve precursor states, which can be seen in Fig. 5. These precursor states are not discussed further as they only serve as initial traps where phenol molecules are bound non-covalently and weakly ( eV). In the course of time, the molecules either detach from the surface or transform to one of structures A–D. The transition from the molecule in the gas phase to structure D is shown in Fig. 5. After the molecule becomes trapped in the precursor state it faces a eV high energy barrier on its path to structure D. On the other hand, the energy needed for returning to the gas phase is eV. Inserting these energies into Eq. 2 yields a times greater reaction rate constant for transforming to structure D than for desorption. Qualitatively the same picture is observed for the adsorption reaction with structure A as the final product. The opposite conclusion can be drawn for the formation of structures B and C. The energetics of these transitions are shown in Figs. 5 and 5. The main difference in these curves compared to Fig. 5 is the height of the barrier that a molecule has to overcome in order to form a covalent bond. For structures B and C this energy is noticeably higher than for desorption, therefore their formation is improbable.
The flowchart in Fig. 4 does not contain reactions where structures E and F are acquired directly from the gas phase. These reactions require a formation of intermediate products such as structures A or D. For instance, structure F is produced by breaking two bonds: O–H and C–H. In this case the former bond is much easier to break than the latter one and we anticipate that in the first dissociation event the hydrogen atom splits off from the O atom. This corresponds to the formation of a D-like structure. Thus, we consider reaction DF rather than the adsorption of a molecule directly to structure F. On closer inspection, reaction DF involves the diffusion of hydrogen atoms on the surface. Our calculations show that the energy barrier for a hydrogen atom to move diagonally across the dimer row is of the order of eV, which is consistent with the findings of Bowler et al.Bowler et al. (2000). Hence, we disregard this particular reaction in further discussion. On the other hand, reactions involving primed structures, i.e. DF’ and D’F, do not require such a diffusion and the only barrier to overcome is related to the cleavage of a C–H bond.
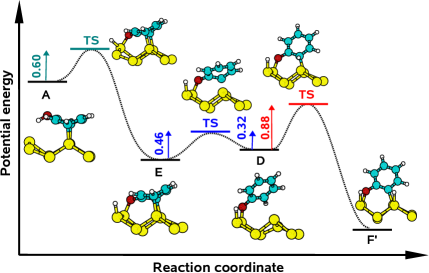
The activation energies can be inserted into Eq. 2 to calculate reaction rate constants. The slowest transitions are AE and DF’, for which s and min, respectively. This shows that the formation of structure F’ is slow, yet it cannot be ignored.
Consider a phenol molecule that approaches the surface with an orientation that leads to structures A’ or D’. Then the molecule undergoes a sequence of structural transformations A’E’D’F, which is qualitatively similar to the one sketched in Fig. 6. However, in this case the dissociation of a C–H bond requires only 0.39 eV, which is a much lower energy than the 0.88 eV required for the reaction DF’. To explain this difference we notice that in structures F and F’ the molecule is bound to two Si atoms that are separated by 2.4 Å and 3.8 Å, respectively. The total energy of the former configuration is lower by 0.35 eV, which indicates that due to the variation of distance between the two Si atoms an additional strain is exerted on the molecule in structure F’. The same geometry considerations are valid for the two transition states, and the difference in their deformation energies can be estimated by the same number as above. This roughly corresponds to the difference in energy barriers for reactions DF’ and D’F.
Molecules with structures F and F’ are bound the most strongly by some margin over the other structures so they are the final products of the reactions that happen on the surface. However, the slow time scale of reaction DF’ implies that there can be other faster processes that prevent the formation of structure F’. For example, if the surface is exposed to a high phenol pressure and if we assume that the activation energy for DH is similar to the gas-phaseD reaction then the surface will saturate to form structure H. Obviously, our analysis is incapable of providing quantitative information about what pressures are required in order for this outcome to take place. Instead, we note that in the experimental results for lower phenol exposures the complete coverage of the surface is not reachedCasaletto et al. (2005) and under these conditions structure F’, rather than H, will be obtained. For the reaction D’F the energy barrier is low and, consequently, the transition time is fast. In fact, the whole sequence gas-phaseD(E)F involves only fast reactions. This means that other processes such as the formation of structure H’ are extremely unlikely to interfere and at room temperature structure F will be abundant on the surface at any phenol deposition conditions.
To our knowledge, activation energies of the considered reactions have not been measured experimentally. However, the quality of the present calculations can be indirectly assessed by using available data on the adsorption of benzene on Si(001)-(). The calculated activation energy of the AB reaction is 1.00 eV, which is in good agreement with the experimentally measured barrier of 0.95 eV for the structural transformation BFTB for benzene adsorbed on the Si(001)(21) surface Lopinski et al. (1998).
IV Conclusions
Density functional theory calculations of the adsorption of phenol on the Si(001)-(21) surface were performed. Regardless of the XC functional used, we found that the dissociated structures were energetically more stable than the non-dissociated ones. The highest adsorption energy per phenol molecule, obtained for the structure with two dissociated hydrogen atoms (structure F), is 3.20–4.29 eV. On the other hand, the highest energy per surface unit cell, obtained for the 1 ML coverage structure with one dissociated hydrogen atom (structure G), is 4.13–6.07 eV. The large range of adsorption energies shows the strong dependence on the XC functional used. An important effect is observed when van der Waals interactions are included. Namely, similar to benzene, the relative stability of the structures is affected when the van der Waals interaction is included in the calculations. Furthermore, for a 1 ML coverage, van der Waals forces cause an attraction between neighbouring phenyl rings.
C and Si CLS spectra for the dissociative structures were simulated and compared with the photoemission spectra in Ref. Casaletto et al., 2005. Based on the comparison, we found that the structures with the cleaved OH group, C and G, do not fit the C spectra obtained in experiment. The disappearance of the Si up-dimer peak from the experimental Si spectra suggests that the surface is fully saturated and thus we can rule out the structure D. The previous analysis of the C CLS spectrum led to the conclusion that structure H (or D) was observedCasaletto et al. (2005). However, we have shown that the remaining dissociative structures, E and F, have very similar C and Si CLS spectra to H and, therefore, they can not be distinguished from H using photoemission spectroscopy alone.
From an analysis of reaction barriers we have shown that the activation energies for the formation of structures F and F’ are 0.39 eV and 0.88 eV, respectively. They are low enough that both reactions will occur at room temperature. However, the rate of formation of structure F’ is slow and at high phenol pressure conditions it will be replaced by structure H. The low barrier path to F suggests that this structure will be the most abundant.
Acknowledgements.
We thank Denis Andrienko and Nico van der Vegt for critical reading of the manuscript and Risto Nieminen for valuable discussions. We acknowledge computational resources provided by the Finnish IT Center for Science (CSC) and by the Rechenzentrum (RZG) of the Max Planck Society. This research was supported by the Finnish Funding Agency for Technology and Innovation (TEKES), the Academy of Finland through its Centres of Excellence Program (2006–2011) and by the Multiscale Modelling Initiative of the Max Planck Society.References
- Bent (2002) S. F. Bent, Surface Science 500, 879 (2002).
- Zhou and Leung (2006a) X. J. Zhou and K. T. Leung, Surface Science 600, 3285 (2006a).
- Zhou and Leung (2006b) X. J. Zhou and K. T. Leung, J. Phys. Chem. B 110, 9601 (2006b).
- Casaletto et al. (2005) M. P. Casaletto, M. Carbone, M. N. Piancastelli, K. Horn, K. Weiss, and R. Zanoni, Surf. Sci. 582, 42 (2005).
- Carbone et al. (2007) M. Carbone, S. Meloni, and R. Caminiti, Phys. Rev. B 76, 085332 (2007).
- Hammer et al. (1999) B. Hammer, L. B. Hansen, and J. K. Norskov, Phys. Rev. B 59, 7413 (1999).
- Perdew (1991) J. P. Perdew, Electronic Structure of Solids ’91 (Academie Verlag, 1991), p. 11.
- Perdew et al. (1996a) J. P. Perdew, K. Burke, and Y. Wang, Phys. Rev. B 54, 16533 (1996a).
- Perdew et al. (1996b) J. P. Perdew, K. Burke, and M. Ernzerhof, Phys. Rev. Lett. 77, 3865 (1996b).
- Perdew et al. (1997) J. Perdew, K. Burke, and M. Ernzerhof, Phys. Rev. Lett. 78, 1396(E) (1997).
- Perdew et al. (1998a) J. P. Perdew, K. Burke, A. Zupan, and M. Ernzerhof, J. Chem. Phys. 108, 1522 (1998a).
- Zhang and Yang (1998) Y. Zhang and W. Yang, Phys. Rev. Lett. 80, 890 (1998).
- Perdew et al. (1998b) J. P. Perdew, K. Burke, and M. Ernzerhof, Phys. Rev. Lett. 80, 891 (1998b).
- Becke (1988) A. D. Becke, Phys. Rev. A 38, 3098 (1988).
- Lee et al. (1988) C. Lee, W. Yang, and R. G. Parr, Phys. Rev. B 37, 785 (1988).
- Dion et al. (2004) M. Dion, H. Rydberg, E. Schröder, D. C. Langreth, and B. I. Lundqvist, Phys. Rev. Lett. 92, 246401 (2004).
- Kresse and Hafner (1993) G. Kresse and J. Hafner, Phys. Rev. B 48, 13115 (1993).
- Kresse and Furthmüller (1996) G. Kresse and J. Furthmüller, Phys. Rev. B 54, 11169 (1996).
- Blöchl (1994) P. E. Blöchl, Phys. Rev. B 50, 17953 (1994).
- Kresse and Joubert (1999) G. Kresse and D. Joubert, Phys. Rev. B 59, 1758 (1999).
- Dovesi et al. (2006) R. Dovesi, V. R. Saunders, C. Roetti, R. Orlando, C. M. Zicovich-Wilson, F. Pascale, B. Civalleri, K. Doll, N. M. Harrison, I. J. Bush, et al., Crystal 2006 User’s Manual, University of Torino, Torino (2006).
- Porter et al. (1999) A. R. Porter, M. D. Towler, and R. J. Needs, Phys. Rev. B 60, 13534 (1999).
- Godbout et al. (1992) N. Godbout, D. R. Salahub, J. Andzelm, and E. Wimmer, Can. J. Chem. 70, 560 (1992).
- Boys and Bernardi (1970) S. F. Boys and F. Bernardi, Molecular Physics 19, 553 (1970).
- Gulans et al. (2009) A. Gulans, M. J. Puska, and R. M. Nieminen, Phy. Rev. B 79, 201105(R) (2009).
- Becke (1992) A. D. Becke, J. Chem. Phys. 96, 2155 (1992).
- Perdew and Wang (1992) J. P. Perdew and Y. Wang, Phys. Rev. B 45, 13244 (1992).
- Maragakis et al. (2002) P. Maragakis, S. A. Andreev, Y. Brumer, D. R. Reichman, and E. Kaxiras, J. Chem. Phys. 117, 4651 (2002).
- Taguchi et al. (1991) Y. Taguchi, M. Fujisawa, T. Takaoka, T. Okada, and M. Nishijima, J. Chem. Phys. 95, 6870 (1991).
- Wolkow et al. (1998) R. A. Wolkow, G. P. Lopinski, and D. J. Moffatt, Surf. Sci. 416, L1107 (1998).
- Nunzi et al. (2007) F. Nunzi, A. Sgamellotti, and N. Re, J. Phys. Chem. C 111, 1392 (2007).
- Naumkin et al. (2003) F. Y. Naumkin, J. C. Polanyi, and D. Rogers, Surf. Sci. 547, 335 (2003).
- Johnston et al. (2008) K. Johnston, J. Kleis, B. I. Lundqvist, and R. M. Nieminen, Phys. Rev. B 77, 121404(R) (2008).
- Puzder et al. (2006) A. Puzder, M. Dion, and D. C. Langreth, J. Chem. Phys. 124, 164105 (2006).
- Yazyev and Pasquarello (2006) O. V. Yazyev and A. Pasquarello, Phys. Rev. Lett. 96, 157601 (2006).
- Bowler et al. (2000) D. R. Bowler, J. H. G. Owen, C. M. Goringe, K. Miki, and G. A. D. Briggs, J. Phys.: Condens. Matter 12, 7655 (2000).
- Lopinski et al. (1998) G. P. Lopinski, D. J. Moffatt, and R. A. Wolkow, Chem. Phys. Lett. 282, 305 (1998).