TRIGONOMETRIC PARALLAX OF W51 MAIN/SOUTH
Abstract
We report measurement of the trigonometric parallax of W51 Main/South using the Very Long Baseline Array (VLBA). We measure a value of 0.1850.010 mas, corresponding to a distance of 5.41 kpc. W51 Main/South is a well-known massive star-forming region near the tangent point of the Sagittarius spiral arm of the Milky Way. Our distance to W51 yields an estimate of the distance to the Galactic center of (statistical) (systematic) kpc by simple geometry. Combining the parallax and proper motion measurements for W51, we obtained the full-space motion of this massive star forming region. We find W51 is in a nearly circular orbit about the Galactic center. The H2O masers used for our parallax measurements trace four powerful bipolar outflows within a 0.4 pc size region, some of which are associated with dusty molecular hot cores and/or hyper- or ultra-compact H II regions.
1 Introduction
We are using the National Radio Astronomy Observatory’s555The National Radio Astronomy Observatory is a facility of the National Science Foundation operated under cooperative agreement by Associated Universities, Inc. Very Long Baseline Array (VLBA), the Japanese VERA (VLBI Exploration of Radio Astrometry) array and the European VLBI Network (EVN) to measure trigonometric parallaxes of maser sources in massive star-forming regions that define the spiral arms of the Milky Way galaxy (Xu et al., 2006, 2009; Hachisuka et al., 2006, 2009; Honma et al., 2007; Hirota et al., 2007; Menten et al., 2007; Sato et al., 2008, 2010; Choi et al., 2008; Kim et al., 2008; Reid et al., 2009a, c, b; Moscadelli et al., 2009; Zhang et al., 2009; Brunthaler et al., 2009; Moellenbrock et al., 2009; Sanna et al., 2009; Rygl et al., 2010; Oh et al., 2010). The primary goal of these efforts is to delineate the spiral structure of the Milky Way by direct and accurate distance determination. Our current view of Galactic structure relies mostly on uncertain kinematic distances, which tend to overestimate the source distances, sometimes over a factor of 2 (e.g., Reid et al., 2009c; Sato et al., 2010). Therefore, a precise map of the Galaxy based on trigonometric parallaxes of massive star-forming regions will significantly refine our knowledge of Galactic structure. In addition to parallax measurements, we also obtain source proper motions. Combining the proper motion and distance of the source with its radial velocity yields the full three-dimensional (3D) space motion of the source, allowing detailed study of the kinematics of the Galaxy.
In this paper, we report parallax measurements of W51 Main/South, a well-studied massive star-forming region that hosts some of the strongest H2O maser sources in the Galaxy. W51 Main/South is associated with a giant H II region W51 A (Figuerêdo et al., 2008), where ongoing formation of massive stars has been reported (e.g., Okumura et al., 2000; Clark et al., 2009). A reliable distance to W51 is important for the physics of massive star formation, since masses, luminosities and ages of young stellar objects depend sensitively on distance. Also, W51 has special importance for the study of Galactic structure, owing to its location very close to the tangency of the Sagittarius spiral arm, hence yielding a good estimate of the distance to the Galactic center by simple geometry.
2 Observations and Data Analysis
2.1 Observations
We used the NRAO VLBA to observe the 22 GHz H2O maser source in the massive star-forming region W51 Main/South. The observations were conducted under VLBA program BR134, which included observations of four star-forming regions thought to be in the Sagittarius spiral arm of the Milky Way. Observations of the other sources will be reported in a forthcoming paper.
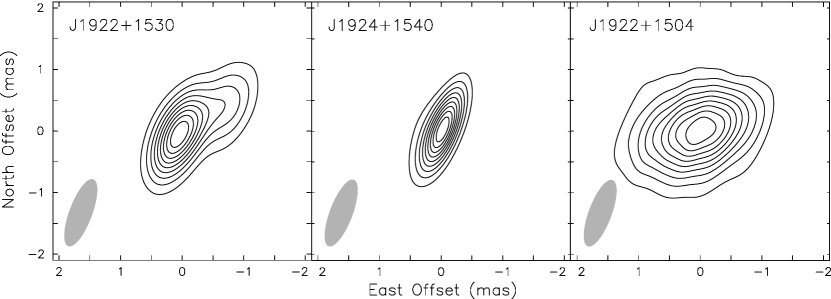
Prior to the VLBA parallax observations, we used the NRAO Very Large Array (VLA; program AR677) in the most extended A configuration on 2008 September 28 to find background extragalactic sources as position references near the target H2O maser sources. Following the methods described by Reid et al. (2009a), we selected unresolved sources in the NRAO VLA Sky Survey (NVSS) catalog within of each maser target and observed both background candidates and target masers at 8 and 22 GHz. For W51 Main/South, we found one new background source J1922+1504 for VLBA observations in addition to two known calibrators from the VLBA Calibrator Survey-1 (VCS1; Beasley et al., 2002), J1922+1530 and J1924+1540. However, at 0.3 mas resolution of the VLBA, we found the new source J1922+1504 displayed a resolved structure and was not useful for parallax measurements (see §3.1). We also obtained an accurate position of the H2O maser source in W51 Main/South to observe with the VLBA.
The VLBA observations of W51 Main/South were scheduled on 2008 October 22, 2009 April 27 and 30, and 2009 October 20, as listed in Table 1. These dates well sample the peaks of the sinusoidal parallax signature in right ascension, maximizing the sensitivity of parallax detection and ensuring that the parallax and proper motion are essentially uncorrelated. We chose four optimal epochs to sample the parallax peaks in right ascension only, instead of sampling the peaks both in right ascension and declination over six or more epochs, since the parallax signature of W51 in right ascension is about twice as large as in declination. The two middle epochs were chosen close to each other and near one parallax peak (which we call a “1–2–1” schedule). The two middle epochs are needed for symmetry and to obtain similar accuracy for the parallax maximum and minimum. This yields zero correlation among the parallax and proper motion parameters. Compared to a “1–1–1–1” schedule over 1.5 cycles (years) of the parallax signature, this “1–2–1” schedule also reduces the time span of observations to one year, reducing sensitivity to maser spot lifetimes.
Our 22 GHz observations were set up in the same manner as described by Reid et al. (2009a) for 12 GHz CH3OH maser observations. For atmospheric calibration, four “geodetic” blocks of ICRF (the International Celestial Reference Frame) quasars (Ma et al., 1998; Fey et al., 2004) with positions accurate to mas were observed at different antenna elevations across the sky in left-circular polarization with eight 4 MHz bands that spanned 450 MHz of bandwidth between 22.02 and 22.47 GHz and uniformly sampled all frequency differences. Using a four-block setup allows the middle block of observing time to be available for phase-referencing rapid-switching scans between the target maser and background continuum sources when the source elevation was the highest at most stations. We measured multi-band delays and fringe rates, mostly due to un-modeled atmospheric propagation delays, to determine zenith delay errors as a function of time for each antenna.
Table 2 lists source information for the target H2O maser emission in W51 Main/South and background continuum sources. We placed three rapid-switching (phase-referencing) blocks between the geodetic blocks and switched every 30 s between the target maser and one of the three background continuum sources. For rapid-switching blocks, we employed four adjacent frequency bands of 8 MHz bandwidth in both right- and left-circular polarizations. The four bands were centered at local standard of rest (LSR) velocities, , of 276.0, 168.0, 60.0, and 48.0 km s-1, covering the maser velocity extent reported in previous studies (Genzel et al., 1981b; Imai et al., 2002); H2O maser emission was detected in the second, third, and fourth bands.
The data correlation was performed at the VLBA correlation facility in Socorro, NM. The data from each antenna pair were cross-correlated with an integration time of 0.92 s. The expected time-averaging effect in wide-field mapping from this integration time, for a beam size of mas, is 5% loss in peak amplitude at an angular distance of from the correlation center (e.g., Thompson et al., 2001). Each of the frequency bands was split into 256 spectral channels, yielding frequency and velocity resolutions of 31.25 kHz and 0.42 km s-1, respectively, for a rest frequency of 22.235080 GHz (Pickett et al., 1998) for the H2O 6523 transition.
Figure 1 shows the 22 GHz H2O maser spectrum of W51 Main/South over all four 8 MHz frequency bands from the first-epoch’s data produced by scalar averaging of the data over the whole observing time at all antennas except Hancock (flagged) and Saint Croix (no data).
2.2 Calibration
We calibrated the correlated data using the NRAO Astronomical Image Processing System (AIPS; Greisen, 2003) in the manner described in four steps by Reid et al. (2009a). We performed “manual phase calibration” using J2253+1608 data to remove instrumental delay and phase and delay offsets among the four frequency bands. We then used one strong maser channel as the phase reference and subtracted reference phases of this channel from all data, including all maser channels and all background sources, by interpolating phase solutions in time. Since the position of J1924+1540 was known to 0.3 mas accuracy (and that of J1922+1530 to 0.8 mas accuracy) (Beasley et al., 2002), the apparent map offset of J1924+1540 when phase referenced to a maser spot is due to a positional offset of the reference maser spot from the correlation center. We corrected for this positional offset by shifting the phase center of the reference maser spot with the AIPS task CLCOR and re-fitted the phase reference data. For the first through third epochs, we used the maser spot at km s-1 in W51 South (feature 32 in Table 3) as phase reference, after shifting the phase center by to the reference spot position. Since this spot became significantly weaker (from 754 to 21 Jy beam-1) and stronger emission appeared elsewhere in the same spectral channel as our observations progressed, we could no longer use this spot as a phase reference at the fourth epoch and used another spot at km s-1 in W51 South (feature 26 in Table 3), after shifting the phase center by to its position.
We flagged jumps greater than 60∘ in the reference phase in adjacent maser scans and all data between these scans. We also flagged all data from antennas that were not of good enough quality to give opacity correction and produced discrepant amplitude results. Table 1 lists all stations that were either not used during the observation or flagged in the calibration.
2.3 Finding Maser Spots
Since maser spots are spread over a large angle on the sky, we first made large-field image cubes involving all spectral channels for each 8 MHz frequency band from the first-epoch data covering a region of around the correlation phase center (i.e., the phase center position was shifted back with CLCOR from the reference maser position). For the large-field imaging, we used only shorter baselines among the inner five VLBA antennas: Fort Davis, Kitt Peak, Los Alamos, Owens Valley, and Pie Town. Robust weighting was adopted for weighting of the visibility data (Briggs et al., 1999). Each image cube was 4096 pixels by 4096 pixels over 256 channels with pixel size of 1 mas, yielding a field of view of . We mapped 27 sub-fields per channel: a grid spaced by plus 2 sub-fields offset north and south of the center by . In order to remove the effects of sidelobes of strong maser features in the same spectral channel, all 27 sub-fields per channel were simultaneously CLEANed using the task IMAGR.
After the large-field imaging, we used Gaussian fitting with the AIPS task SAD (search and destroy) to detect maser spots. Our criteria for maser spot detection required that each detected spot had a peak intensity greater than seven times the rms noise level () over two or more spectral channels within channels (i.e., within 0.84 km s-1) at the same position within mas in each coordinate. From the first-epoch’s data, we detected 1362 spots in 280 unique “features” (i.e., spots at the same position but in adjacent velocity channels).
2.4 Mapping Maser Spot Distributions
After the maser spot detection from large-field imaging, we imaged a small field of 1024 pixels by 1024 pixels with pixel size 0.03 mas ( of the FWHM of the beam) centered at each spot position over detected channels, which yielded a field of view of 30 mas 30 mas. If two or more spots were in overlapping fields, we used one field of 2048 pixels by 2048 pixels centered at the average position of the spots. All fields in the same channel were simultaneously CLEANed to remove sidelobes. We shifted phase centers using CLCOR to each field before mapping the field. (For a technical detail, since we could only shift the phase center to one position at a time, we shifted the phase center using CLCOR to one of the fields that were simultaneously CLEANed, then kept only the image of the phase-centered field by discarding the other field images, and repeated shifting and imaging for all fields.) We then mapped each field at all four epochs in exactly the same manner, except we doubled the field size for the fourth epoch to allow for a large proper motion of the spot and/or small residual position offsets of the field centers due to the change of the reference maser spot at the fourth epoch.
After obtaining all four-epoch maps around each maser spot, we measured positions with the AIPS task SAD. We calculated spot positions relative to the reference maser spot at km s-1 in W51 South (feature 32 in Table 3), by subtracting the position of this spot from all spot positions. We then fitted a linear (relative) proper motion for each spot using the position versus time measurements. We identified a maser spot to be the “same” spot at different epochs if (1) the spot was detected at all four epochs as the strongest spot in the same imaging field, with an intensity greater than 0.5 Jy beam-1 and also greater than 10 times the rms noise of the map; (2) the fitted relative proper motion was smaller than 10 mas yr-1 ( km s-1 at a distance of 5.4 kpc); and (3) the uncertainty for the fitted relative proper motion was smaller than mas yr-1.
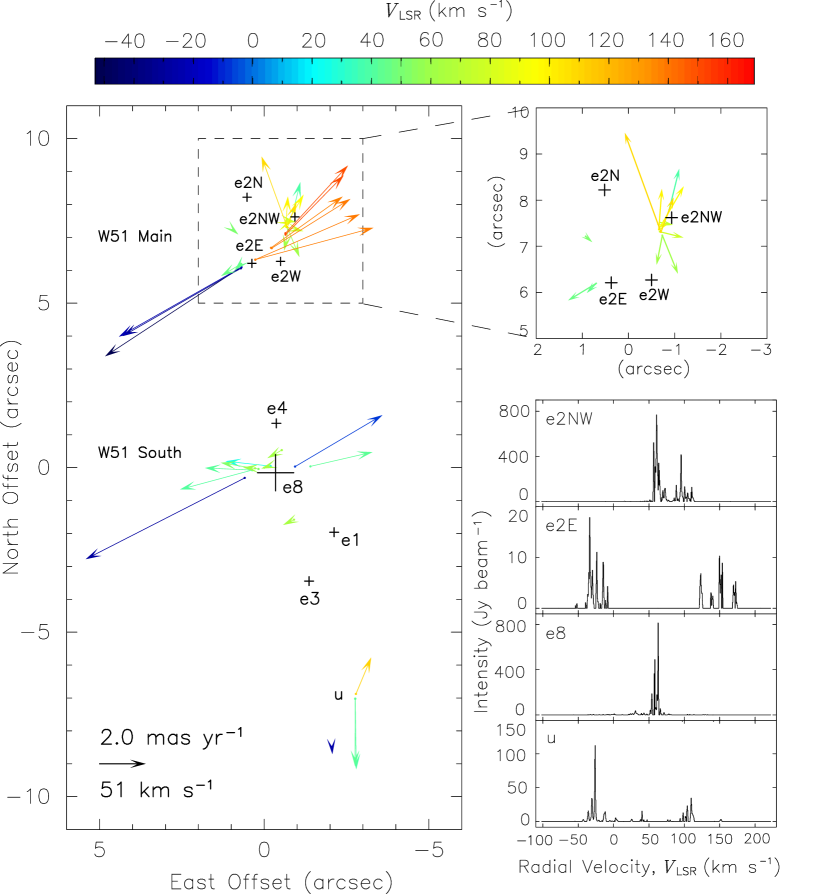
We grouped the identified maser spots into a maser feature (i.e., a group of spots with similar position and velocity) if (1) the positions were within 1 mas in each coordinate; (2) the radial velocities, , agreed within 7 km s-1 (which allows for maser emission from different hyperfine split components; e.g., Walker 1984); and (3) the fitted relative proper motions agreed within 0.3 mas yr-1. Table 3 lists all 37 features with proper motions detected from all four epochs. We estimated the radial velocity for each feature as the intensity-weighted mean of the radial velocities of the spots. The position and proper motion of each feature relative to the reference spot were estimated as error-weighted mean of the values for the included spots. Figure 2 shows the proper motions of the detected features relative to the calculated mean motion of all regions (see Sections 3.2 and 4.2).
3 Results
3.1 Parallax
Since relative positions for two sources (i.e., maser and quasar sources) at low antenna elevations are very sensitive to atmospheric delay errors (e.g., Honma, Tamura & Reid, 2008), we adopted an elevation cutoff of 30∘ for parallax measurement, below which data were discarded for each antenna. At each epoch, we imaged the background continuum sources after calibration (Figure 3) and then fitted elliptical Gaussian brightness distributions to the sources using the task JMFIT. These positions were subtracted from the positions of the maser spot at km s-1 in W51 South (feature 32 in Table 3). Since this maser spot was the phase reference at the first through third epochs, it had essentially zero position. However, at the fourth epoch, this spot was not at the map center since the phase reference was a different maser spot. Since both the maser spot at km s-1 and the continuum sources are equally affected by the change in reference feature, differencing their measured positions removes the effects of a different phase reference spot in the last epoch.
The change in position of the maser spot at km s-1 relative to background continuum sources was then modeled by the parallax sinusoid in east-west () and north-south () directions and a linear proper motion. This requires five parameters, i.e., a single parallax parameter and two parameters for the proper motion in each coordinate. Independent “error floors” were added to positions in each coordinate to allow for unknown systematic errors and then adjusted iteratively to make the reduced in each coordinate (Reid et al., 2009a).
Figure 3 shows contour maps of the background sources. Since one of the three background continuum sources, J1922+1504, displayed heavily resolved structure ( mas), we did not use this source for parallax measurement. For the two quasars, J1922+1530 and J1924+1540, after individual parallax fitting, we also attempted a “combined” fitting with the data from both quasars, solving for seven parameters, i.e., a common parallax and proper motion of the maser source against both background quasars but different position offsets for each quasar.
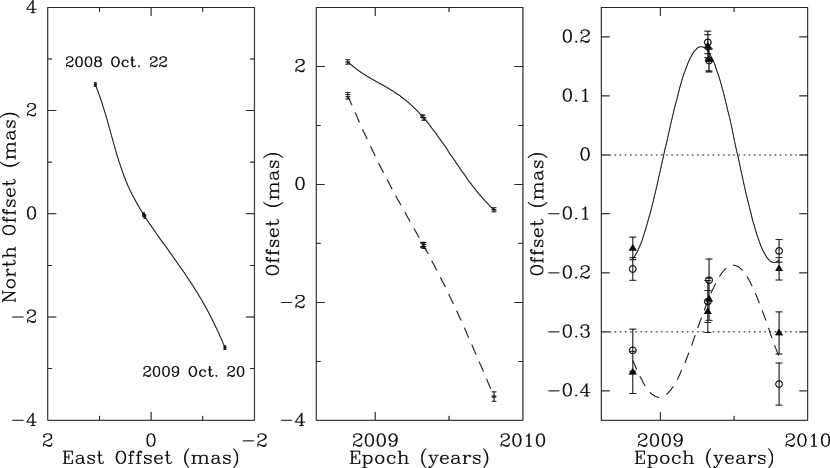
Figure 4 shows position measurements and parallax fits of the masers relative to the two background sources, J1922+1530 and J1924+1540. The results of parallax fitting are listed in Table 4. We obtained the parallax of W51 Main/South to be mas using J1922+1530 and mas using J1924+1540. From the combined fit, we obtained mas. The uncertainty of each parallax fit was obtained from the formal fitting uncertainty. The adjusted error floors which yielded were mas in the east-west direction and mas in the north-south direction using J1922+1530, and mas and mas using J1924+1540. For the combined fit, mas and mas.
We also attempted parallax fitting using other maser spots in both W51 Main and South, which yielded essentially the same parallax as the maser spot at km s-1 in W51 South. This indicates that structural changes in the maser spots are unlikely to be a significant error source for our parallax measurement of W51 Main/South. The dominant error source of the position measurements is likely to be residuals in the atmospheric delay modeling, but structural changes in background quasars may also add some “noise.” Random errors due to thermal noise are negligibly small, considering the high signal-to-noise ratio in both the maser and quasar maps.
The error-weighted mean of the two measurements using each quasar is mas. The deviation of each quasar measurement from the mean, mas gives an estimate of the error intrinsic to each quasar, including potential quasar structural changes and atmospheric delay error differences between the maser and quasar positions. In the right panel of Figure 4, the positions in the east-west direction at the second and third epochs spaced by 3 days differ by mas from each other, while the measurements on the same day using different quasars differ by a much smaller amount mas. The position difference between 3 days is likely due to the atmospheric delay errors, since structural change of the quasars over 3 days is unlikely. Therefore, the dominant source of the position errors appears to be the residuals in the atmospheric delay modeling.
Since the two quasars lie relatively near each other on the sky (see Table 2 for angular separations and position angles relative to W51 Main/South), the atmospheric delay errors may be partially correlated for the two quasars. The uncertainty of the combined-fit parallax, estimated from the formal fitting uncertainty, assumes that the errors of the measurements using two quasars are uncorrelated. If they are 100% correlated, the estimated error needs to be multiplied by (i.e., 16 data points and 7 parameters yielding 9 degrees of freedom for uncorrelated data, and 8 data points and 5 parameters for a single quasar case). As an estimate of partially correlated errors, we average the factors of 1 (for no correlation) and (for a 100% correlation), and multiply the formal error by , which yields an uncertainty of mas, as the best estimate for partially correlated data. We thus adopt the combined-fit parallax of mas as the best estimate, which corresponds to a source distance of 5.41 kpc.
Our parallax distance is in good agreement with 5.1 kpc for W51 IRS 2 (or North) by Xu et al. (2009) from 12 GHz CH3OH maser parallax, but has much higher accuracy. The parallax by Xu et al. (2009) has much larger uncertainty because the 12 GHz masers in W51 IRS 2 had large spot sizes and were resolved out at longer baselines of the VLBA, which resulted in lack of data at the highest resolution. Also, the low signal-to-noise ratio due to the low 12 GHz maser flux density may have contributed to the error of the measurement. Previous to the parallax measurements, the distance to W51 was mostly based on statistical parallaxes based on 22 GHz H2O maser proper motions, e.g., 7 kpc by Genzel et al. (1981b) for W51 Main and 8.3 kpc by Schneps et al. (1981) and 6.1 kpc by Imai et al. (2002) for W51 North. W51 Main/South and W51 IRS 2/North are separated by east and south. Both are thought to be associated with the H II region W51 A. Our distance is consistent with the upper limit of 5.8 kpc by Barbosa et al. (2008) from spectroscopic study of W51 IRS 2, but is in significant disagreement with the smaller distance of 2.0 kpc recently reported by Figuerêdo et al. (2008) from spectroscopic parallaxes of four O-type stars near the giant H II region W51 A. Figuerêdo et al. (2008) discuss an extra uncertainty in the derived distance that comes from the interstellar extinction law, however a factor of 1.28 difference in distance they cite for adopting different methods to estimate will not account for the distance discrepancy. As discussed by Clark et al. (2009), the underestimated spectroscopic distance by Figuerêdo et al. (2008) may come from an underestimate of the luminosity class of the stars (O4 to O7.5) used to derive the distance. Our distance of 5.4 kpc suggests that the luminosity of the P Cyg supergiant type star [OMN2000] LS1, whose nature Clark et al. (2009) discuss for three different assumptions on its distance, is indeed very high and of order .
3.2 Maser Map and Internal Motions
We detected 37 H2O maser features in W51 Main/South that we could identify at all four epochs, and we list their relative proper motions in Table 3. We classified features into four separate groups according to their likely exciting sources: hyper-compact (HC) or ultra-compact (UC) H II regions W51e2-NW, W51e2-E (Shi, Zhao & Han, 2010a, b) and W51e8 (Zhang & Ho, 1997), and a region we call “u” without detected millimeter or centimeter continuum emission (see Figure 2). Note that a proper motion of 2 mas yr-1 corresponds to 51 km s-1 at the distance of 5.4 kpc.
Figure 2 gives a map of positions and internal motions of the detected maser features. The origin of the map is the position of the reference feature 32. The plotted internal motions are relative to the average velocity of the four regions, km s-1 and km s-1 relative to the maser feature 32 (see Section 4.2). The positions of the HC and UC H II regions are also plotted by crosses whose sizes approximate the beam sizes from previous observations: W51e1, e3 and e4 by Gaume, Johnston & Wilson (1993); W51e8 by Zhang & Ho (1997) and W51e2-W, e2-E, e2-NW and e2-N by Shi, Zhao & Han (2010a). Molecular-line studies show evidence for gravitational collapse of W51e2 (W51 Main) and W51e8 (W51 South) cores (Ho & Young, 1996; Zhang, Ho & Ohashi, 1998; Tang et al., 2009).
For the W51e2 region, we can identify two outflows: a high-velocity outflow and a low-velocity outflow that arise separately from the e2-E and e2-NW cores, respectively. We find that the northwest to southeast direction of the bipolar H2O maser outflow from W51e2-E is in good agreement with the molecular outflow direction seen in the CO(2–1) line (Keto & Klaassen, 2008) and the CO(3–2) and HCN(4–3) lines (Shi, Zhao & Han, 2010a, b), but with higher expansion velocities for H2O masers. We classified maser features near W51e2 position into e2-E and e2-NW groups by their radial velocities: features with radial velocities within the rage of km s-1 were included in e2-NW and high-velocity features outside of the range in e2-E. For comparison, the molecular radial velocity of W51e2 was found to be 55 km s-1 by Zhang, Ho & Ohashi (1998) from CH3CN (8-7) line observations.
4 Discussion
4.1 Distance to the Galactic Center
Since the location of W51 is very close to the tangent point of the Sagittarius spiral arm of the Galaxy, the distance to W51 directly yields a good estimate of the distance to the Galactic center by simple geometry.
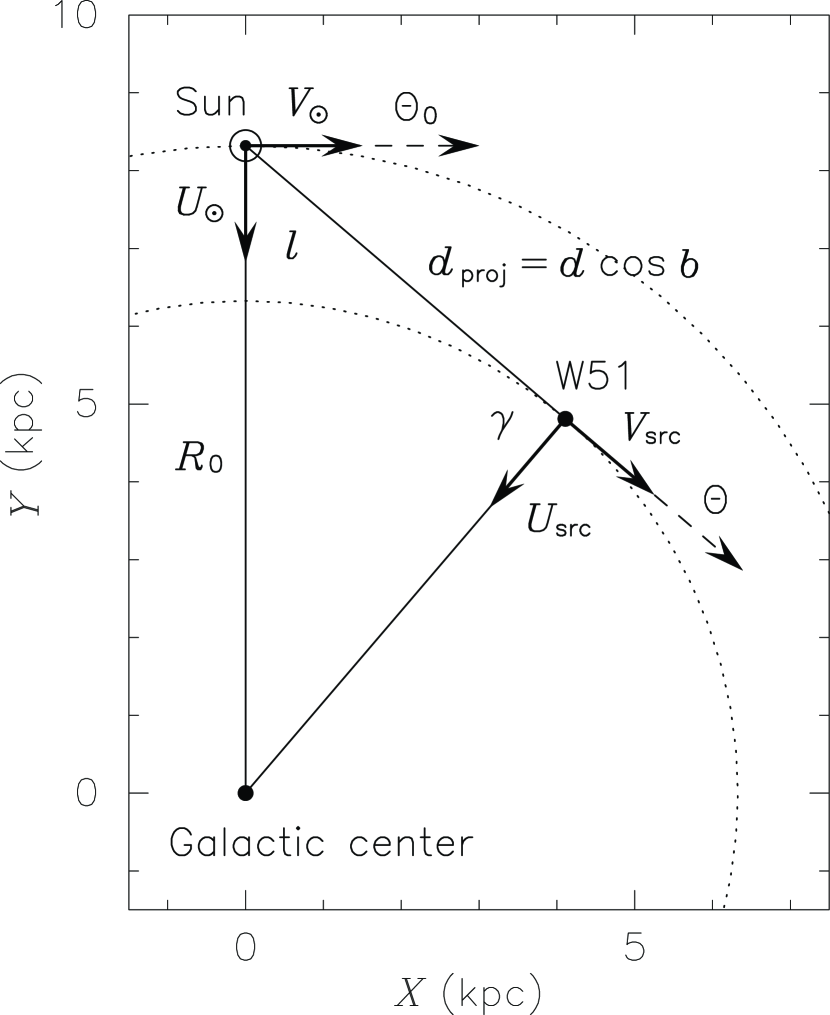
Figure 5 gives a schematic depiction of the source locations. At the galactic coordinates of (, )(, ), W51 lies very close to the tangent point (i.e., the angle between the Sun and the Galactic center as viewed from W51 is very close to ; see Figure 5), since the radial velocity of W51 Main/South, km s-1 (Section 4.2), is very close to the maximum radial velocity (which occurs at the tangent point) given by , assuming a flat rotation curve of the Galaxy (i.e., ). For example, if we adopt kpc (Ghez et al., 2008; Gillessen et al., 2009) and km s-1 kpc-1 (Reid & Brunthaler, 2004) to obtain , then the maximum velocity for is km s-1, which is in good agreement with the observed radial velocity of W51 Main/South ( km s-1; see Section 4.2). Note that correction for a likely counter-rotating peculiar (non-circular) motion of a massive star forming region, as reported by Reid et al. (2009c), would only make the observed radial velocity due to the Galactic rotation larger than the expected maximum velocity, which would then lend further support to the assumption that W51 lies at the tangent point.
From simple geometry, , assuming only that W51 lies at the tangent point (i.e., ), our distance estimate of kpc to W51 directly gives a trigonometric distance of kpc to the Galactic center.
We now relax the assumption that W51 is exactly at the tangent point and estimate the systematic effect this has on the uncertainty of . For example, if we adopt Galactic and source parameters as discussed in Section 4.3 (i.e., km s-1; km s-1, km s-1, km s-1; the source proper motion mas yr-1, mas yr-1; the source radial velocity km s-1 and the radial peculiar motion km s-1) and solve for using the equation by Reid, Moran & Gwinn (1988) with no assumption on the tangent point, we obtain kpc, which includes both statistical and systematic uncertainties. Therefore our best estimate of from the parallax of W51 is (statistical) (systematic) kpc. Combining the statistical and systematic uncertainties in quadrature, we find kpc. This estimate is consistent with other measurements of : e.g., kpc by Reid (1993) from an ensemble of classical techniques, and recent direct measurements of kpc by Ghez et al. (2008) and kpc by Gillessen et al. (2009) from stellar orbits around Sgr A*, kpc by Reid et al. (2009b) from the trigonometric parallax of Sgr B2, and kpc by Reid et al. (2009c) from trigonometric parallaxes and proper motions of 16 massive star-forming regions across the Galaxy. We thus determined the distance to the Galactic center with good accuracy from a precise parallax measurement of W51 Main/South.
4.2 Origins of Internal Maser Motions
The internal proper motions of the H2O masers in W51 Main/South (Figure 2) suggest four bipolar outflows, presumably from four young, massive stars: e2-NW, e2-E, e8, and u. We modeled the first three as uniformly expanding flows and fitted the data to obtain seven global parameters: the expansion speed and the three spatial and velocity components of the center of expansion. (There were not enough measured motions for the “u” group to reliably model.) For each maser feature, we fitted the measured three components of velocity using their positions on the sky as independent variables. Since the spatial offset along the line of sight from the center of expansion for each maser feature is unknown, we needed to solve for an additional offset parameter for each feature.
We adopted a Bayesian fitting procedure using a Markov chain Monte Carlo method to explore parameter space. H2O masers are known to have an internal dispersion of km s-1 for each velocity component (Reid et al., 1988) and we added this in quadrature with the (usually much smaller) measurement errors. Anticipating that some maser features may be “outliers” (i.e., not well modeled by simple uniform expansion), we adopted an “error-tolerant” probability density function for the data errors with the form , where is the adopted (minimum) data uncertainty (see Sivia & Skilling 2007). For priors, we set the expansion speed () at km s-1; the and proper motions of the center ( and ) at km s-1 relative to the reference feature #32; the LSR velocity of the center () was taken as km s-1, a value between the average of the thermal molecular lines in e2 and e8 ( 55 and 59 km s-1 for e2 and e8, respectively, by Zhang, Ho & Ohashi 1998 from the CH3CN (8–7) line); the coordinates of the center of expansion ( and ) were estimated visually from Figure 2 and assigned an uncertainty of arcsec (i.e., arcsec for e2-NW, arcsec for e2-E, and arcsec for e8); and we assumed a source distance given by the parallax () of mas determined in Section 3.1.
The results of the fitting for each center of expansion are given in Table 5. We adopted the peak value of the histogram of each parameter as the best estimate of the parameter, and estimated its uncertainty from the halfwidth of the histogram where the number of occurrences becomes of the peak, i.e., 1 for a Gaussian distribution. The error-weighted means of the fitted velocities are km s-1 and km s-1 relative to feature 32, and km s-1. These values are in good agreement with the unweighted mean of all 37 maser features in Table 3: km s-1 and km s-1 (at a distance of 5.41 kpc) and km s-1. We adopt the result from the Bayesian method as the best estimate for the systemic velocity of W51 Main/South. By adding km s-1 and km s-1 (at a distance of 5.41 kpc) to the absolute proper motion of the feature 32, mas yr-1 (see Section 3.1 and Table 4), we obtain the systemic absolute proper motion of W51 Main/South to be mas yr-1 and mas yr-1, which will be used in Section 4.3 for fitting Galactic parameters. Figure 2 shows the maser motions relative to this systemic velocity.
For comparison, Xu et al. (2009) report proper motions of , mas yr-1 and mas yr-1 for two CH3OH maser spots in W51 IRS 2, whose sky position is west and north of W51 Main/South (see, e.g., Figuerêdo et al. 2008 for a map of the giant H II region W51 A). At the source distance of 5.4 kpc, the two regions are separated by a sky-projected distance of pc. The eastward proper motions of the two regions agree well, and the northward proper motions differ by mas yr-1 km s-1. The difference in of 10 km s-1 is a reasonable value, considering the virial motion of km s-1 in each coordinate expected for each massive star that is exciting the maser emission (Reid et al., 2009c) and some contribution from the internal motion of the CH3OH maser spots km s-1 (Moscadelli et al., 2002).
Each H2O maser outflow in W51 Main/South shows a relatively small range of internal 3D speeds. This is contrary to previous observations of other Galactic star-forming regions, e.g., Orion-KL (Genzel & Downes, 1977; Genzel et al., 1981a) and W49N (Gwinn et al., 1992), which suggested that high- and low-velocity outflows might originate from the same young stellar object. In W49, a strong acceleration region at a radius of 0.1 pc is required if all masers are associated with a single young stellar object. However, these conclusions were based on observations with less precise maser motions and, most importantly, much lower resolution dust emission maps. Our results for W51 suggest that multiple speed outflows may come from separate young stellar objects that can be very closely spaced on the sky.
4.3 Galactic 3D Motion of W51
Using our parallax distance and the fitted full-space systemic velocity of W51 Main/South obtained in Section 4.2, we now estimate the 3D motion of W51 Main/South in the Galaxy. As in Section 4.2, we adopted a Bayesian fitting procedure using a Markov chain Monte Carlo method. We set priors for nine parameters: the source distance of W51 Main/South given by the parallax () determined in Section 3.1; distance to the Galactic center () and the angular rotation speed () of the Galaxy at the LSR; the Solar motion (, , ) relative to the LSR; and source peculiar motion (relative to a circular orbit) of W51 Main/South (, , ), where , , and denote velocity components in the directions (at the source location) toward the Galactic center, toward Galactic rotation and toward the north Galactic pole (NGP), respectively.
The prior kpc was chosen as an average between kpc by Reid (1993) and the recent direct measurements of (e.g., Ghez et al., 2008; Gillessen et al., 2009). The prior value of km s-1 kpc-1 (for km s-1 and corrected for the varied values) was adopted from Reid & Brunthaler (2004) from the proper motion of Sgr A*. The priors of km s-1 and km s-1 were adopted from Hipparcos values by Dehnen & Binney (1998), while km s-1 was chosen to allow for both 5.25 km s-1 by Dehnen & Binney (1998) and a larger value of km s-1 recently revised by Binney (2010). We set the priors of , and to be rather open, km s-1, in particular to allow for a wide possible range of due to the uncertainty of (Reid et al., 2009c; Binney, 2010; McMillan & Binney, 2010; Schönrich et al., 2010). We assumed a flat rotation curve of the Galaxy (i.e., ). The nine parameters were then adjusted to maximize the probability of the model given the above priors and the data of the source proper motion and LSR velocity, mas yr-1, mas yr-1 and km s-1. Note that the proper motions () are in the heliocentric frame, while the given radial velocity is the LSR velocity, converted from the heliocentric radial velocity (obtained from the Doppler shift) using the standard solar motion by definition relative to the LSR (see Reid et al. 2009c).
Since the obtained probability distribution functions for some parameters did not follow a Gaussian function, we adopted, as a conservative approach, the mean value of each parameter as the best estimate for the parameter and the standard deviations from the mean as the uncertainty, based on the last 90% of 500,000 trials. Most of the Galactic parameters returned the uncertainties only slightly smaller than the priors, indicating that these parameters were mainly constrained by the fairly strong priors.
The fitted result yields (, , ) (, , ) km s-1 for the peculiar (non-circular) motion of W51 Main/South. For comparison, the parallax and full-space motion reported by Xu et al. (2006) for W3(OH) in the Perseus spiral arm would yield (, , ) (, , ) km s-1 under the same priors for Galactic parameters. Therefore, the full-space velocity of W51 Main/South suggests that W51 is in a nearly circular orbit about the Galactic center, with no large peculiar motion.
References
- Barbosa et al. (2008) Barbosa, C. L., Blum, R. D., Conti, P. S., Damineli, A. & Figuerêdo, E. 2008, ApJ, 678, L55
- Beasley et al. (2002) Beasley, A.J., Gordon, D., Peck, A.B., Petrov, L., MacMillan, D.S., Fomalont, E.B. & Ma, C. 2002, ApJS, 141, 13
- Binney (2010) Binney, J. 2010, MNRAS, 401, 2318
- Briggs et al. (1999) Briggs, D. S., Schwab, F. R. & Sramek, R. A. 1999, in ASP Conf. Ser. 180, Synthesis Imaging in Radio Astronomy II, ed. G. B. Taylor, C. L. Carilli & R. A. Perley (San Francisco, CA:ASP), 127
- Brunthaler et al. (2009) Brunthaler, A., Reid, M. J., Menten, K. M., Zheng, X. W., Moscadelli, L. & Xu, Y. 2009, ApJ, 693, 424
- Choi et al. (2008) Choi, Y. K. et al.2008, PASJ, 60, 1007
- Clark et al. (2009) Clark, J. S., Davies, B., Najarro, F., MacKenty, J., Crowther, P. A., Messineo, M. & Thompson, M. A. 2009, A&A, 504, 429
- Dehnen & Binney (1998) Dehnen, W. & Binney, J. J. 1998, MNRAS, 298, 387
- Fey et al. (2004) Fey, A. L., et al.2004, AJ, 127, 3587
- Figuerêdo et al. (2008) Figuerêdo, E., Blum, R. D., Damineli, A., Conti, P. S. & Barbosa, C. L. 2008, AJ, 136, 221
- Gaume, Johnston & Wilson (1993) Gaume, R. A., Johnston, K. J. & Wilson, T. L. 1993, ApJ, 417, 645
- Genzel & Downes (1977) Genzel, R. & Downes, D. 1977, A&A, 61, 117
- Genzel et al. (1981a) Genzel, R., Reid, M. J., Moran, J. M., Downes, D. 1981a, ApJ, 244, 884
- Genzel et al. (1981b) Genzel, R., et al.1981b, ApJ, 247, 1039
- Ghez et al. (2008) Ghez, A. M., et al.2008, ApJ, 689, 1044
- Gillessen et al. (2009) Gillessen, S., Eisenhauer, F., Trippe, S., Alexander, T., Genzel, R., Martins, F. & Ott, T. 2009, ApJ, 692, 1075
- Greisen (2003) Greisen, E. W. 2003, in Information Handling in Astronomy: Historical Vistas, ed. A. Heck (Dordrecht: Kluwer), 109
- Gwinn et al. (1992) Gwinn, C. R., Moran, J. M. & Reid, M. J. 1992, ApJ, 393, 149
- Hachisuka et al. (2009) Hachisuka, K. Brunthaler, A., Menten, K. M., Reid, M. J., Hagiwara, Y. & Mochizuki, N. 2009, ApJ, 696, 1981
- Hachisuka et al. (2006) Hachisuka, K. et al. 2006, ApJ, 645, 337
- Hirota et al. (2007) Hirota, T. et al.2007, PASJ, 59, 897
- Honma, Tamura & Reid (2008) Honma, M., Tamura, Y. & Reid, M. J. 2008, PASJ, 60, 951
- Honma et al. (2007) Honma, M. et al.2007, PASJ, 59, 889
- Ho & Young (1996) Ho, P. T. P. & Young, L. M. 1996, ApJ, 472, 742
- Imai et al. (2002) Imai, H., Watanabe, T., Omodaka, T., Nishio, M., Kameya, O., Miyaji, T. & Nakajima, J. 2002, PASJ, 54, 741
- Keto & Klaassen (2008) Keto, E. & Klaassen, P. 2008, ApJ, 678, L109
- Kim et al. (2008) Kim, M. K. et al.2008, PASJ, 60, 991
- Ma et al. (1998) Ma, C., et al.1998, AJ, 116, 516
- McMillan & Binney (2010) McMillan, P. J. & Binney, J. J. 2010, MNRAS, 402, 934
- Menten et al. (2007) Menten, K. M., Reid, M. J., Forbrich J. & Brunthaler, A. 2007, A&A, 474, 515
- Moellenbrock et al. (2009) Moellenbrock, G. A., Claussen, M. J. & Goss, W. M. 2009, ApJ, 694, 192
- Moscadelli et al. (2002) Moscadelli, L., Menten, K. M., Walmsley, C. M. & Reid,, M. J. 2002, ApJ, 564, 813
- Moscadelli et al. (2009) Moscadelli, L., Reid, M. J., Menten, K. M., Brunthaler, A., Zheng, X. W. & Xu, Y. 2009, ApJ, 693, 406
- Oh et al. (2010) Oh, C. S., Kobayashi, H., Honma, M., Hirota, T., Sato, K. & Ueno, Y. 2010, PASJ, 62, 101
- Okumura et al. (2000) Okumura, S., Mori, A., Nishihara, E., Watanabe, E. & Yamashita, T. 2000, ApJ, 543, 799
- Pickett et al. (1998) Pickett, H. M., Poynter, I. R. L., Cohen, E. A., Delitsky, M. L., Pearson, J. C. & Müller, H. S. P. 1998, J. Quant. Spectrosc. Radiati. Transfer, 60, 883
- Reid (1993) Reid, M. J. 1993, ARA&A, 31, 345
- Reid & Brunthaler (2004) Reid, M. J. & Brunthaler, A., 2004, ApJ, 616, 872
- Reid et al. (2009a) Reid, M. J., Menten, K. M., Brunthaler, A., Zheng, X. W., Moscadelli, L. & Xu, Y. 2009a, ApJ, 693, 397
- Reid et al. (2009b) Reid, M. J., Menten, K. M., Zheng, X. W., Brunthaler, A. & Xu, Y. 2009b, ApJ, 705, 1548
- Reid, Moran & Gwinn (1988) Reid, M. J., Moran, J. M. & Gwinn, C. R. 1988, in IAU Symposium 129, The Impact of VLBI on Astrophysics and Geophysics, ed. M. J. Reid & J. M. Moran (Dordrecht: Kluwer), 169
- Reid et al. (1988) Reid, M. J., Schneps, M. H., Moran, J. M., Gwinn, C. R., Genzel, R., Downes, D. & Rönnäng, B. 1998, ApJ, 330, 809
- Reid et al. (2009c) Reid, M. J. et al.2009c, ApJ, 700, 137
- Rygl et al. (2010) Rygl, K. L. J., Brunthaler, A., Reid, M. J., Menten, K. M., van Langevelde, H. J. & Xu, Y. 2010, A&A, 511, A2
- Sanna et al. (2009) Sanna, A., Reid, M. J., Moscadelli, L., Dame, T. M., Menten, K. M., Brunthaler, A., Zheng, X. W. & Xu, Y. 2009, ApJ, 706, 464
- Sato et al. (2010) Sato, M., Hirota, T., Reid, M. J., Honma, M., Kobayashi, H., Iwadate, K., Miyaji, T. & Shibata, K. M. 2010, PASJ, 62, 287
- Sato et al. (2008) Sato, M. et al.2008, PASJ, 60, 975
- Schneps et al. (1981) Schneps, M. H., Lane, A. P., Downes, D., Moran, J. M., Genzel, R. & Reid, M. J. 1981, ApJ, 249, 124.
- Schönrich et al. (2010) Schönrich, R., Binney, J. & Dehnen, W. 2010, MNRAS, 403, 1829
- Shi, Zhao & Han (2010a) Shi, H., Zhao, J.-H., & Han, J. L. 2010a, ApJ, 710, 843
- Shi, Zhao & Han (2010b) Shi, H., Zhao, J.-H., & Han, J. L. 2010b, ApJ, 718, L181
- Sivia & Skilling (2007) Sivia, D. S. & Skilling, J., 2007, Data Analysis: A Bayesian Tutorial (2nd ed.; Oxford, UK: Oxford Univ. Press), 168
- Tang et al. (2009) Tang, Y.-W., Ho, P. T. P., Koch, P. M., Girart, J. M., Lai, S.-P. & Rao, R. 2009, ApJ, 700, 251
- Thompson et al. (2001) Thompson, A. R., Moran, J. M. & Swenson, G. W., Jr. 2001, Interferometry and Synthesis in Radio Astronomy (2nd ed.; New York: Wiley), 205
- Walker (1984) Walker, R. C. 1984, ApJ, 280, 618
- Xu et al. (2009) Xu, Y., Reid, M. J., Menten, K. M., Brunthaler, A., Zheng, X. W. & Moscadelli, L. 2009, ApJ, 693, 413
- Xu et al. (2006) Xu, Y., Reid, M. J., Zheng, W. W. & Menten, K. M. 2006, Science, 311, 54
- Zhang et al. (2009) Zhang, B., Zheng, X. W., Reid, M. J., Menten, K. M., Xu, Y., Moscadelli, L. & Brunthaler, A. 2009, ApJ, 693, 419
- Zhang & Ho (1997) Zhang, Q. & Ho, P. T. P. 1997, ApJ, 488, 241
- Zhang, Ho & Ohashi (1998) Zhang, Q., Ho, P. T. P. & Ohashi, N. 1998, ApJ, 494, 636

| Epoch | Date | Day of Year | Time Range | Restoring Beam | Antennas Unavailable | |
|---|---|---|---|---|---|---|
| (UT) | (mas, mas, deg) | No Data | Flagged | |||
| 1 | 2008 Oct 22 | 2008/296 | 19:36-04:31 | 1.20.4 at –20 | SC | HN |
| 2 | 2009 Apr 27 | 2009/117 | 07:20-16:16 | 0.80.3 at –7 | … | NL |
| 3 | 2009 Apr 30 | 2009/120 | 07:09-16:04 | 1.10.3 at –18 | KP | NL, SC |
| 4 | 2009 Oct 20 | 2009/293 | 19:44-04:40 | 1.10.3 at –19 | SC | … |
Note. — Restoring beam sizes (FWHM) are indicated in Column 5 by the major and minor axes in mas and position angles (P.A.) east of north in degrees. Antenna codes are HN: Hancock, KP: Kitt Peak, NL: North Liberty, and SC: Saint Croix.
| Source | R.A. (J2000) | Dec. (J2000) | P.A. | |||
|---|---|---|---|---|---|---|
| (h m s) | (d ′ ′′) | (deg) | (deg) | (Jy/b) | (km s-1) | |
| W51 Main/South | 19 23 43.87363 | +14 30 29.4536 | … | … | 746 | 58 |
| J1922+1530 | 19 22 34.699314 | +15 30 10.03262 | 1.0 | 0.108 | … | |
| J1924+1540 | 19 24 39.455870 | +15 40 43.94172 | 1.2 | 0.633 | … | |
| J1922+1504 | 19 22 33.27291 | +15 04 47.5382 | 0.6 | 0.025 | … |
Note. — Coordinates are those used in the VLBA correlator. Absolute positions of J1922+1530 and J1924+1540 are based on the VLBA Calibrator Survey 1 (VCS1; Beasley et al., 2002) and known in each coordinate to about mas (J1922+1530) and mas (J1924+1540). The position of J1922+1504 is accurate to about mas. Angular offsets () and position angles (P.A.) east of north relative to the H2O maser source in W51 Main/South are indicated in Columns 4 and 5. Peak brightnesses () for the maser and background continuum sources are from the first epoch.
| ID | ||||||
|---|---|---|---|---|---|---|
| (km s-1) | (Jy/b) | (′′) | (′′) | (mas yr-1) | (mas yr-1) | |
| (e2-NW) | ||||||
| 1 | 39.3 | 1.8 | –0.879 (0.008) | 7.786 (0.025) | –0.43 (0.03) | 1.31 (0.11) |
| 2 | 45.0 | 4.2 | 0.721 (0.008) | 6.177 (0.008) | 0.14 (0.02) | –0.23 (0.02) |
| 3 | 46.6 | 9.3 | 0.700 (0.005) | 6.196 (0.003) | 0.75 (0.01) | –0.49 (0.01) |
| 4 | 51.4 | 6.0 | 0.930 (0.023) | 7.216 (0.001) | –0.32 (0.06) | –0.14 (0.01) |
| 5 | 60.7 | 644.5 | –0.732 (0.010) | 7.238 (0.005) | –0.60 (0.02) | –1.15 (0.01) |
| 6 | 61.9 | 336.9 | –0.732 (0.006) | 7.238 (0.024) | 0.06 (0.02) | –0.87 (0.06) |
| 7 | 72.5 | 114.9 | –0.674 (0.003) | 7.518 (0.003) | –0.53 (0.01) | –0.04 (0.01) |
| 8 | 77.5 | 2.5 | –0.674 (0.044) | 7.315 (0.023) | –0.85 (0.11) | –0.14 (0.05) |
| 9 | 83.6 | 13.6 | –0.662 (0.020) | 7.416 (0.021) | –0.41 (0.09) | 0.14 (0.10) |
| 10 | 95.5 | 357.5 | –0.655 (0.003) | 7.367 (0.002) | –0.89 (0.01) | 1.37 (0.01) |
| 11 | 100.1 | 601.3 | –0.656 (0.006) | 7.361 (0.003) | –0.21 (0.01) | 1.30 (0.01) |
| 12 | 106.8 | 73.4 | –0.702 (0.007) | 7.306 (0.012) | –0.51 (0.04) | 1.11 (0.12) |
| 13 | 109.5 | 103.2 | –0.701 (0.061) | 7.307 (0.087) | 1.00 (0.13) | 3.11 (0.18) |
| (e2-E) | ||||||
| 14 | –51.7 | 3.6 | 0.800 (0.011) | 6.033 (0.030) | 5.64 (0.02) | –3.74 (0.07) |
| 15 | –33.9 | 18.1 | 0.706 (0.013) | 6.059 (0.006) | 5.01 (0.04) | –2.90 (0.02) |
| 16 | –23.6 | 34.2 | 0.687 (0.003) | 6.095 (0.005) | 5.20 (0.02) | –2.98 (0.01) |
| 17 | 137.9 | 4.5 | –0.210 (0.015) | 6.683 (0.003) | –3.22 (0.04) | 2.26 (0.01) |
| 18 | 138.5 | 2.7 | 0.269 (0.008) | 6.323 (0.011) | –5.24 (0.02) | 1.42 (0.02) |
| 19 | 139.6 | 1.0 | –0.229 (0.008) | 6.670 (0.004) | –3.53 (0.03) | 2.18 (0.01) |
| 20 | 139.8 | 12.0 | 0.269 (0.016) | 6.323 (0.013) | –4.65 (0.04) | 2.01 (0.03) |
| 21 | 149.8 | 6.2 | –0.646 (0.007) | 7.125 (0.010) | –2.83 (0.03) | 2.98 (0.03) |
| 22 | 150.9 | 3.5 | –0.649 (0.017) | 7.083 (0.017) | –2.64 (0.05) | 2.61 (0.05) |
| (e8) | ||||||
| 23 | –28.7 | 10.0 | 0.591 (0.001) | –0.311 (0.005) | 6.78 (0.01) | –3.49 (0.02) |
| 24 | –7.4 | 5.5 | –0.938 (0.002) | 0.034 (0.010) | –3.90 (0.01) | 2.27 (0.02) |
| 25 | 26.6 | 6.7 | –0.198 (0.005) | 0.049 (0.007) | 1.84 (0.02) | 0.25 (0.02) |
| 26 | 41.3 | 81.7 | 0.365 (0.073) | –0.074 (0.075) | 3.01 (0.15) | –0.80 (0.16) |
| 27 | 43.0 | 37.3 | –1.404 (0.003) | 0.039 (0.005) | –2.81 (0.01) | 0.66 (0.02) |
| 28 | 42.3 | 11.5 | 0.365 (0.027) | –0.074 (0.020) | 1.93 (0.07) | 0.13 (0.06) |
| 29 | 52.1 | 27.8 | 0.172 (0.012) | –0.040 (0.023) | 1.52 (0.03) | 0.31 (0.06) |
| 30 | 60.0 | 63.6 | 0.277 (0.003) | –0.018 (0.001) | 0.40 (0.01) | 0.07 (0.01) |
| 31 | 61.3 | 128.0 | –0.534 (0.003) | 0.534 (0.006) | 0.50 (0.02) | –0.31 (0.02) |
| 32 | 62.9 | 918.1 | 0.000 (0.001) | 0.000 (0.001) | 0.00 (0.01) | 0.00 (0.01) |
| 33 | 63.2 | 71.9 | –0.905 (0.002) | –1.579 (0.004) | 0.35 (0.01) | –0.19 (0.01) |
| (u) | ||||||
| 34 | –25.7 | 78.5 | –2.054 (0.105) | –8.488 (0.119) | –0.14 (0.22) | –0.27 (0.25) |
| 35 | 40.3 | 15.3 | –2.767 (0.011) | –7.023 (0.010) | –0.16 (0.03) | –3.02 (0.03) |
| 36 | 42.7 | 1.7 | –2.765 (0.015) | –7.022 (0.010) | –0.11 (0.04) | –2.88 (0.03) |
| 37 | 111.9 | 107.2 | –2.787 (0.019) | –6.876 (0.023) | –0.78 (0.05) | 1.62 (0.05) |
Note. — H2O maser features in W51 Main/South listed with relative positions , and proper motions , with respect to feature 32. ad denote eastward and northward directions, respectively. A proper motion of 1 mas yr-1 corresponds to 25.6 km s-1 at a distance of 5.41 kpc. The uncertainties were obtained from the formal fitting uncertainties and are shown in parentheses. The positional offsets of , relative to feature 32 are those fitted for the mid-observation year of 2009.318 (i.e., average year of all four epochs). The brightness () of each maser feature gives the maximum value of all spots of the feature from all four epochs.
| Maser | Background | Parallax | ||
|---|---|---|---|---|
| (km s-1) | Source | (mas) | (mas yr-1) | (mas yr-1) |
| 62.9 | J1922+1530 | |||
| 62.9 | J1924+1540 | |||
| 62.9 | Combined |
Note. — Combined fit used a single parallax parameter and a single proper motion in each coordinate for the maser spot position relative to the two background sources. The uncertainty for each parallax fit was obtained from the formal fitting uncertainty.
| Source | ||||||
|---|---|---|---|---|---|---|
| (′′) | (′′) | (km s-1) | (km s-1) | (km s-1) | (km s-1) | |
| e2-NW | ||||||
| e2-E | ||||||
| e8 |
Note. — () and () are relative to the reference feature 32.
| ID | # | ||||||
|---|---|---|---|---|---|---|---|
| (km s-1) | (Jy/b) | (′′) | (′′) | (mas yr-1) | (mas yr-1) | ||
| 1 | 1 | 39.0 | 1.1 | –0.879 (0.015) | 7.786 (0.046) | –0.41 (0.05) | 1.35 (0.14) |
| 1 | 2 | 39.4 | 1.8 | –0.879 (0.010) | 7.786 (0.030) | –0.45 (0.05) | 1.23 (0.17) |
| 2 | 1 | 44.8 | 4.2 | 0.721 (0.009) | 6.177 (0.008) | 0.15 (0.02) | –0.25 (0.02) |
| 2 | 2 | 45.3 | 2.7 | 0.721 (0.026) | 6.177 (0.025) | –0.02 (0.06) | –0.10 (0.05) |
| 3 | 1 | 46.5 | 9.3 | 0.700 (0.015) | 6.196 (0.003) | 0.59 (0.03) | –0.49 (0.01) |
| 3 | 2 | 46.9 | 5.7 | 0.700 (0.006) | 6.196 (0.007) | 0.78 (0.01) | –0.49 (0.01) |
| 4 | 1 | 51.2 | 5.6 | 0.930 (0.031) | 7.216 (0.012) | –0.34 (0.08) | –0.17 (0.03) |
| 4 | 2 | 51.6 | 6.0 | 0.930 (0.036) | 7.216 (0.000) | –0.29 (0.10) | –0.14 (0.01) |
| 5 | 1 | 58.7 | 106.8 | –0.732 (0.040) | 7.238 (0.031) | –0.67 (0.11) | –1.25 (0.08) |
| 5 | 2 | 59.2 | 127.7 | –0.732 (0.038) | 7.238 (0.027) | –0.71 (0.09) | –1.25 (0.07) |
| 5 | 3 | 59.6 | 156.3 | –0.732 (0.025) | 7.238 (0.022) | –0.59 (0.05) | –1.16 (0.05) |
| 5 | 4 | 60.0 | 316.5 | –0.732 (0.016) | 7.238 (0.007) | –0.53 (0.04) | –1.11 (0.02) |
| 5 | 5 | 60.4 | 537.5 | –0.732 (0.020) | 7.238 (0.007) | –0.67 (0.05) | –1.18 (0.02) |
| 5 | 6 | 60.8 | 644.5 | –0.732 (0.052) | 7.238 (0.031) | –0.68 (0.12) | –1.16 (0.07) |
| 5 | 7 | 61.3 | 474.7 | –0.732 (0.048) | 7.238 (0.040) | –0.44 (0.21) | –1.11 (0.13) |
| 6 | 1 | 61.7 | 336.9 | –0.732 (0.006) | 7.238 (0.039) | 0.02 (0.03) | –0.94 (0.18) |
| 6 | 2 | 62.1 | 221.9 | –0.732 (0.016) | 7.238 (0.040) | 0.12 (0.04) | –0.87 (0.09) |
| 6 | 3 | 62.5 | 138.5 | –0.732 (0.027) | 7.238 (0.048) | 0.06 (0.06) | –0.83 (0.10) |
| 7 | 1 | 71.8 | 79.3 | –0.674 (0.006) | 7.518 (0.013) | –0.58 (0.02) | 0.04 (0.08) |
| 7 | 2 | 72.2 | 110.6 | –0.674 (0.006) | 7.518 (0.011) | –0.54 (0.01) | –0.01 (0.04) |
| 7 | 3 | 72.6 | 114.9 | –0.674 (0.006) | 7.518 (0.007) | –0.53 (0.03) | –0.02 (0.02) |
| 7 | 4 | 73.1 | 91.1 | –0.674 (0.007) | 7.518 (0.008) | –0.51 (0.04) | –0.03 (0.03) |
| 7 | 5 | 73.5 | 48.5 | –0.674 (0.006) | 7.518 (0.008) | –0.49 (0.02) | –0.07 (0.03) |
| 7 | 6 | 73.9 | 17.8 | –0.674 (0.013) | 7.518 (0.007) | –0.52 (0.03) | –0.06 (0.02) |
| 8 | 1 | 77.3 | 2.1 | –0.674 (0.067) | 7.315 (0.036) | –0.66 (0.18) | –0.07 (0.09) |
| 8 | 2 | 77.7 | 2.5 | –0.674 (0.059) | 7.315 (0.030) | –0.94 (0.13) | –0.17 (0.07) |
| 9 | 1 | 82.7 | 6.8 | –0.662 (0.035) | 7.416 (0.054) | –0.39 (0.22) | 0.16 (0.31) |
| 9 | 2 | 83.2 | 8.8 | –0.662 (0.043) | 7.416 (0.041) | –0.31 (0.23) | 0.16 (0.21) |
| 9 | 3 | 83.6 | 13.5 | –0.662 (0.048) | 7.416 (0.040) | –0.44 (0.16) | 0.14 (0.15) |
| 9 | 4 | 84.0 | 13.6 | –0.662 (0.034) | 7.416 (0.035) | –0.45 (0.14) | 0.11 (0.17) |
| 10 | 1 | 94.5 | 93.8 | –0.655 (0.010) | 7.367 (0.018) | –0.90 (0.03) | 1.43 (0.05) |
| 10 | 2 | 94.9 | 205.1 | –0.655 (0.010) | 7.367 (0.012) | –0.88 (0.04) | 1.40 (0.05) |
| 10 | 3 | 95.4 | 357.1 | –0.655 (0.012) | 7.367 (0.008) | –0.86 (0.03) | 1.41 (0.03) |
| 10 | 4 | 95.8 | 357.5 | –0.655 (0.005) | 7.367 (0.005) | –0.85 (0.01) | 1.41 (0.01) |
| 10 | 5 | 96.2 | 182.4 | –0.656 (0.006) | 7.367 (0.003) | –0.98 (0.02) | 1.36 (0.01) |
| 10 | 6 | 96.6 | 51.7 | –0.656 (0.010) | 7.367 (0.010) | –1.06 (0.03) | 1.26 (0.08) |
| 11 | 1 | 100.0 | 601.3 | –0.656 (0.024) | 7.361 (0.005) | –0.18 (0.05) | 1.28 (0.01) |
| 11 | 2 | 100.4 | 280.6 | –0.656 (0.021) | 7.361 (0.005) | –0.17 (0.05) | 1.30 (0.01) |
| 11 | 3 | 100.8 | 76.9 | –0.656 (0.010) | 7.361 (0.010) | –0.21 (0.02) | 1.33 (0.02) |
| 11 | 4 | 101.3 | 20.1 | –0.656 (0.008) | 7.361 (0.014) | –0.22 (0.02) | 1.36 (0.03) |
| 12 | 1 | 105.9 | 29.7 | –0.702 (0.024) | 7.306 (0.044) | –0.56 (0.11) | 1.22 (0.21) |
| 12 | 2 | 106.3 | 48.4 | –0.702 (0.036) | 7.306 (0.034) | –0.52 (0.12) | 1.12 (0.26) |
| 12 | 3 | 106.7 | 63.0 | –0.702 (0.017) | 7.306 (0.031) | –0.43 (0.13) | 1.00 (0.28) |
| 12 | 4 | 107.2 | 73.4 | –0.702 (0.009) | 7.306 (0.016) | –0.50 (0.05) | 1.07 (0.20) |
| 13 | 1 | 108.8 | 52.1 | –0.701 (0.082) | 7.307 (0.134) | 1.03 (0.17) | 3.17 (0.27) |
| 13 | 2 | 109.7 | 103.2 | –0.701 (0.092) | 7.307 (0.114) | 0.97 (0.19) | 3.07 (0.24) |
| 14 | 1 | –52.2 | 1.9 | 0.800 (0.017) | 6.033 (0.044) | 5.64 (0.04) | –3.74 (0.09) |
| 14 | 2 | –51.8 | 3.6 | 0.800 (0.019) | 6.033 (0.061) | 5.65 (0.04) | –3.74 (0.14) |
| 14 | 3 | –51.4 | 3.3 | 0.800 (0.026) | 6.033 (0.056) | 5.63 (0.06) | –3.75 (0.12) |
| 15 | 1 | –35.4 | 1.1 | 0.706 (0.016) | 6.059 (0.017) | 5.06 (0.06) | –2.83 (0.06) |
| 15 | 2 | –34.9 | 2.1 | 0.706 (0.043) | 6.059 (0.010) | 4.97 (0.12) | –2.87 (0.03) |
| 15 | 3 | –34.5 | 6.1 | 0.706 (0.041) | 6.059 (0.014) | 4.97 (0.10) | –2.95 (0.04) |
| 15 | 4 | –34.1 | 16.8 | 0.706 (0.047) | 6.059 (0.021) | 5.05 (0.13) | –2.95 (0.05) |
| 15 | 5 | –33.7 | 18.1 | 0.706 (0.046) | 6.059 (0.019) | 4.92 (0.13) | –2.90 (0.05) |
| 16 | 1 | –24.8 | 10.1 | 0.687 (0.010) | 6.095 (0.016) | 5.38 (0.08) | –3.40 (0.10) |
| 16 | 2 | –24.4 | 22.3 | 0.687 (0.004) | 6.095 (0.053) | 5.31 (0.04) | –3.26 (0.35) |
| 16 | 3 | –24.0 | 23.2 | 0.687 (0.015) | 6.095 (0.077) | 5.23 (0.05) | –2.98 (0.33) |
| 16 | 4 | –23.6 | 30.9 | 0.687 (0.010) | 6.095 (0.005) | 5.14 (0.03) | –2.97 (0.01) |
| 16 | 5 | –23.2 | 34.2 | 0.687 (0.018) | 6.095 (0.070) | 5.07 (0.05) | –3.51 (0.17) |
| 16 | 6 | –22.7 | 16.6 | 0.687 (0.024) | 6.095 (0.071) | 5.06 (0.13) | –3.42 (0.28) |
| 17 | 1 | 137.7 | 3.9 | –0.210 (0.036) | 6.683 (0.003) | –3.22 (0.09) | 2.26 (0.01) |
| 17 | 2 | 138.1 | 4.5 | –0.210 (0.016) | 6.684 (0.015) | –3.22 (0.05) | 2.25 (0.04) |
| 18 | 1 | 138.1 | 1.2 | 0.269 (0.014) | 6.323 (0.031) | –5.23 (0.05) | 1.45 (0.08) |
| 18 | 2 | 138.5 | 2.7 | 0.269 (0.010) | 6.323 (0.011) | –5.25 (0.02) | 1.41 (0.02) |
| 19 | 1 | 139.4 | 1.0 | –0.229 (0.016) | 6.670 (0.006) | –3.50 (0.05) | 2.17 (0.02) |
| 19 | 2 | 139.8 | 0.9 | –0.229 (0.009) | 6.670 (0.007) | –3.54 (0.03) | 2.21 (0.02) |
| 20 | 1 | 139.4 | 9.5 | 0.269 (0.048) | 6.323 (0.035) | –4.76 (0.10) | 1.98 (0.07) |
| 20 | 2 | 139.8 | 12.0 | 0.269 (0.028) | 6.323 (0.021) | –4.67 (0.06) | 2.00 (0.05) |
| 20 | 3 | 140.2 | 9.4 | 0.269 (0.031) | 6.323 (0.022) | –4.63 (0.08) | 2.03 (0.05) |
| 20 | 4 | 140.6 | 3.7 | 0.269 (0.028) | 6.323 (0.049) | –4.62 (0.06) | 2.06 (0.11) |
| 21 | 1 | 149.5 | 5.5 | –0.646 (0.014) | 7.125 (0.011) | –2.78 (0.04) | 3.00 (0.04) |
| 21 | 2 | 149.9 | 6.2 | –0.646 (0.010) | 7.125 (0.026) | –2.83 (0.05) | 2.90 (0.15) |
| 21 | 3 | 150.3 | 3.2 | –0.646 (0.017) | 7.125 (0.048) | –2.92 (0.06) | 2.73 (0.16) |
| 22 | 1 | 150.7 | 3.5 | –0.649 (0.036) | 7.083 (0.037) | –2.66 (0.09) | 2.73 (0.10) |
| 22 | 2 | 151.2 | 2.3 | –0.649 (0.020) | 7.083 (0.018) | –2.62 (0.06) | 2.57 (0.06) |
| 23 | 1 | –29.1 | 8.1 | 0.591 (0.003) | –0.311 (0.008) | 6.77 (0.01) | –3.50 (0.02) |
| 23 | 2 | –28.6 | 10.0 | 0.591 (0.003) | –0.311 (0.009) | 6.78 (0.01) | –3.50 (0.03) |
| 23 | 3 | –28.2 | 5.6 | 0.591 (0.002) | –0.311 (0.013) | 6.78 (0.01) | –3.48 (0.04) |
| 23 | 4 | –27.8 | 1.6 | 0.591 (0.010) | –0.311 (0.019) | 6.79 (0.04) | –3.47 (0.07) |
| 24 | 1 | –8.0 | 3.8 | –0.938 (0.004) | 0.034 (0.025) | –3.82 (0.01) | 2.27 (0.07) |
| 24 | 2 | –7.6 | 5.5 | –0.938 (0.007) | 0.034 (0.017) | –3.85 (0.02) | 2.19 (0.07) |
| 24 | 3 | –7.2 | 4.3 | –0.938 (0.003) | 0.034 (0.018) | –3.93 (0.01) | 2.20 (0.04) |
| 24 | 4 | –6.3 | 2.7 | –0.938 (0.032) | 0.034 (0.019) | –3.85 (0.07) | 2.34 (0.04) |
| 25 | 1 | 26.3 | 4.5 | –0.198 (0.008) | 0.049 (0.009) | 1.84 (0.02) | 0.25 (0.02) |
| 25 | 2 | 26.7 | 6.7 | –0.198 (0.006) | 0.049 (0.012) | 1.82 (0.05) | 0.23 (0.07) |
| 26 | 1 | 41.1 | 54.6 | 0.365 (0.118) | –0.074 (0.099) | 3.00 (0.26) | –0.83 (0.21) |
| 26 | 2 | 41.5 | 81.7 | 0.365 (0.094) | –0.074 (0.115) | 3.01 (0.19) | –0.76 (0.24) |
| 27 | 1 | 42.3 | 16.3 | –1.404 (0.003) | 0.039 (0.017) | –2.81 (0.01) | 0.67 (0.04) |
| 27 | 2 | 42.7 | 37.3 | –1.404 (0.005) | 0.039 (0.023) | –2.83 (0.01) | 0.64 (0.06) |
| 27 | 3 | 43.2 | 36.9 | –1.404 (0.018) | 0.039 (0.022) | –2.85 (0.05) | 0.62 (0.06) |
| 27 | 4 | 43.6 | 16.8 | –1.404 (0.044) | 0.039 (0.014) | –2.86 (0.12) | 0.64 (0.07) |
| 27 | 5 | 44.0 | 15.5 | –1.404 (0.029) | 0.039 (0.009) | –2.82 (0.19) | 0.66 (0.04) |
| 27 | 6 | 44.4 | 8.1 | –1.404 (0.023) | 0.039 (0.009) | –2.90 (0.13) | 0.68 (0.05) |
| 28 | 1 | 42.3 | 11.5 | 0.365 (0.041) | –0.074 (0.031) | 1.98 (0.11) | 0.16 (0.09) |
| 28 | 2 | 42.7 | 2.4 | 0.365 (0.035) | –0.074 (0.027) | 1.90 (0.09) | 0.11 (0.07) |
| 29 | 1 | 52.0 | 27.8 | 0.172 (0.018) | –0.040 (0.029) | 1.48 (0.04) | 0.34 (0.07) |
| 29 | 2 | 52.4 | 15.5 | 0.172 (0.018) | –0.040 (0.039) | 1.57 (0.04) | 0.26 (0.09) |
| 30 | 1 | 59.6 | 37.7 | 0.277 (0.005) | –0.018 (0.004) | 0.31 (0.02) | 0.13 (0.01) |
| 30 | 2 | 60.0 | 63.6 | 0.277 (0.007) | –0.018 (0.002) | 0.39 (0.03) | 0.06 (0.01) |
| 30 | 3 | 60.4 | 44.8 | 0.278 (0.005) | –0.018 (0.004) | 0.52 (0.02) | –0.06 (0.02) |
| 31 | 1 | 60.8 | 51.7 | –0.534 (0.005) | 0.534 (0.009) | 0.54 (0.03) | –0.37 (0.04) |
| 31 | 2 | 61.3 | 128.0 | –0.534 (0.005) | 0.534 (0.009) | 0.49 (0.03) | –0.29 (0.03) |
| 31 | 3 | 61.7 | 81.2 | –0.534 (0.020) | 0.534 (0.032) | 0.45 (0.05) | –0.20 (0.07) |
| 32 | 1 | 62.1 | 129.7 | 0.000 (0.001) | 0.000 (0.001) | 0.01 (0.01) | 0.01 (0.01) |
| 32 | 2 | 62.5 | 622.5 | 0.000 (0.001) | 0.000 (0.001) | 0.01 (0.01) | –0.01 (0.01) |
| 32 | 3 | 62.9 | 918.1 | 0.000 (0.000) | 0.000 (0.000) | 0.00 (0.01) | 0.00 (0.01) |
| 32 | 4 | 63.4 | 520.8 | 0.000 (0.001) | 0.000 (0.001) | –0.01 (0.01) | 0.01 (0.01) |
| 33 | 1 | 62.5 | 40.7 | –0.905 (0.002) | –1.579 (0.006) | 0.34 (0.01) | –0.16 (0.01) |
| 33 | 2 | 62.9 | 60.9 | –0.905 (0.004) | –1.579 (0.010) | 0.38 (0.01) | –0.23 (0.02) |
| 33 | 3 | 63.4 | 71.9 | –0.905 (0.009) | –1.579 (0.013) | 0.40 (0.02) | –0.27 (0.03) |
| 33 | 4 | 63.8 | 52.7 | –0.905 (0.014) | –1.579 (0.021) | 0.38 (0.04) | –0.28 (0.06) |
| 34 | 1 | –28.2 | 3.6 | –2.054 (0.198) | –8.488 (0.243) | –0.17 (0.41) | –0.25 (0.50) |
| 34 | 2 | –27.8 | 5.5 | –2.054 (0.163) | –8.488 (0.208) | –0.04 (0.34) | –0.07 (0.43) |
| 34 | 3 | –25.7 | 78.5 | –2.055 (0.193) | –8.489 (0.182) | –0.26 (0.42) | –0.43 (0.38) |
| 35 | 1 | 39.8 | 6.0 | –2.766 (0.026) | –7.023 (0.023) | 0.11 (0.09) | –2.81 (0.10) |
| 35 | 2 | 40.2 | 15.3 | –2.767 (0.022) | –7.023 (0.022) | –0.06 (0.07) | –2.96 (0.05) |
| 35 | 3 | 40.6 | 9.9 | –2.767 (0.015) | –7.023 (0.012) | –0.22 (0.04) | –3.09 (0.04) |
| 36 | 1 | 42.3 | 0.7 | –2.765 (0.017) | –7.022 (0.015) | –0.07 (0.05) | –2.91 (0.05) |
| 36 | 2 | 42.7 | 1.7 | –2.765 (0.027) | –7.022 (0.012) | –0.22 (0.09) | –2.86 (0.04) |
| 37 | 1 | 111.8 | 107.2 | –2.787 (0.034) | –6.876 (0.049) | –0.70 (0.10) | 1.61 (0.16) |
| 37 | 2 | 112.2 | 59.5 | –2.787 (0.045) | –6.876 (0.051) | –0.71 (0.11) | 1.56 (0.12) |
| 37 | 3 | 112.6 | 16.8 | –2.787 (0.041) | –6.876 (0.049) | –0.76 (0.09) | 1.57 (0.10) |
| 37 | 4 | 113.0 | 6.1 | –2.787 (0.037) | –6.876 (0.037) | –0.88 (0.08) | 1.67 (0.08) |