Ab initio theory of coherent phonon generation by laser excitation
Abstract
We show that time-dependent density functional theory (TDDFT) is applicable to coherent optical phonon generation by intense laser pulses in solids. The two mechanisms invoked in phenomenological theories, namely impulsively stimulated Raman scattering and displacive excitation, are present in the TDDFT. Taking the example of crystalline Si, we find that the theory reproduces the phenomena observed experimentally: dependence on polarization, strong growth at the direct band gap, and the change of phase from below to above the band gap. We conclude that the TDDFT offers a predictive ab initio framework to treat coherent optical phonon generation.
There has been much experimental progress in the study of intense electromagnetic fields interacting with condensed matter using pump-probe techniques on femtosecond time scales ro02 . These interactions are a challenging subject for theory, in view of the need to go beyond perturbative methods in dealing with strong fields. One promising theoretical approach useful to describe electron dynamics on femtosecond time scales is time-dependent density functional theory (TDDFT) rg84 . In this Letter we apply the TDDFT to the generation of coherent phonons by strong laser pulses. Our goals are both to test the utility of the TDDFT in this domain and to assess the validity of phenomenological models that are in current use. In the past, two mechanisms have been invoked to explain the generation of coherent phonon me97 ; st02 . The impulsively stimulated Raman scattering was proposed for the coherent phonon generation in dielectrics with a laser pulse whose frequency is lower than the direct band gap. In this mechanism, electrons are virtually excited following adiabatically the laser electric field. The crucial quantity is the Raman tensor, the derivative of dielectric function with respect to the phonon coordinate. The other mechanism, called displacive excitation, requires higher frequencies to generate real electron-hole excitations in the final state ze92 ; sc93 ; ku94 . These excitations then shift the equilibrium position of the phonon coordinates. In this work we consider a bulk Si under irradiation of laser pulses of frequencies below and above the direct band gap, and show that the TDDFT is computationally feasible, includes two above-mentioned mechanisms, and produces results that are in qualitative agreement with experiments ha03 ; ri07 . The TDDFT calculations prove to be also useful to evaluate phenomenological and macroscopic models for the phonon generation process.
Our computational framework is based on equations of motion derived from a Lagrangian for a periodic crystalline system under a time-dependent, spatially uniform electric field biry . The Lagrangian is
| (1) | |||||
Here is the time-dependent electron orbitals, taken as Bloch orbitals in a unit cell of volume . represents the electron density distribution. are atomic positions. The electromagnetic field terms are split into a long-range spatially uniform part and a periodic part given by a Coulomb potential . Variations with respect to the orbitals , potential , and atomic coordinates result in the time-dependent Kohn-Sham equation for , the Poisson equation for , and the Newton equation for , respectively. All the equations except those for are the same as those employed in biry and ot08 .
To introduce the external laser field, we express the vector potential as a sum of an external field and the induced field , with and treat as dynamic. The variation with respect to yields the following equation of motion,
| (2) |
To simulate the time-dependent electric field of the laser pulse, we take to have the form
| (3) |
for and zero otherwise, with fs and corresponding to peak intensity W/cm2.
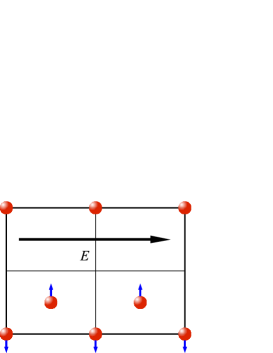
The laser pulse is directed on a Si surface at normal incidence with a linear polarization oriented along the axis. We show in Fig. 1 the atomic positions of Si atoms in the plane defined by the and axes. The 4 atoms lying on the plane are shown. The optical phonon coordinate which couples to the laser field is shown by vertical blue arrows.
Our calculations are based on the LDA density functional pz81 , treating the four valence electrons of Silicon explicitly and using the Troullier-Martins pseudopotential TM . We employ the real-time and real-space scheme which was developed by us yb96 . The geometry is taken to be a simple cubic unit cell containing 8 Si atoms, with lattice constant au. We have carefully examined the convergence of the results with respect to numerical parameters. We find that a spatial division of , -space grid of , and the time step of au is adequate for our purposes, and these numerical parameters are adopted for the results reported below. To make the present calculation feasible, parallel computation distributing -points into processors is indispensable. We note the calculated direct band gap of Si is 2.4 eV, smaller than the measured value of 3.3 eV.
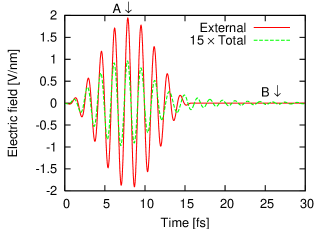
We first show the electron dynamics induced by a laser pulse. Figure 2 shows the time dependence of the electric fields. The red solid curve shows the electric field of applied laser pulse . We choose the laser frequency eV, close to the value of the direct band gap. The green dashed curve shows the sum of the applied and induced electric fields, . The difference of the magnitudes of the two fields comes from a dielectric screening.
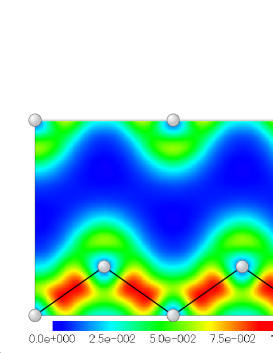
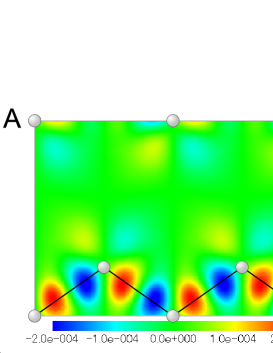
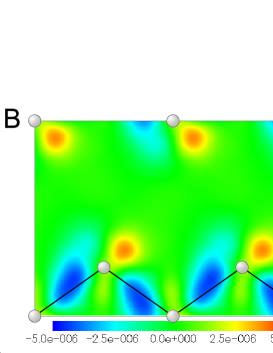
Figure 3 shows the electron density in the plane of Fig. 1. The top panel shows the ground-state electron density, and the middle and bottom panels show the change of electron density from that in the ground state at two times, marked and in Fig. 2, respectively. In the middle and bottom panels, red and blue indicate an increase or decrease of electron density, respectively. At time , the electric field is maximum and there is a strong virtual excitation of the electrons. In the middle panel of Fig. 3, a movement of electrons is seen in the bond connecting two Si atoms. At the time , the external electric field ended. Since the ultrashort laser pulse includes frequency components above the direct band gap, there appear real electron-hole excitations. In the bottom panel of Fig. 3, one can see that the excitation results in a decreased density in the bond region and an increase near the Si atoms but away from the bond. One should note that the coloring of the middle and bottom figures are different by a factor of 40 to improve the visibility of the density change at time .
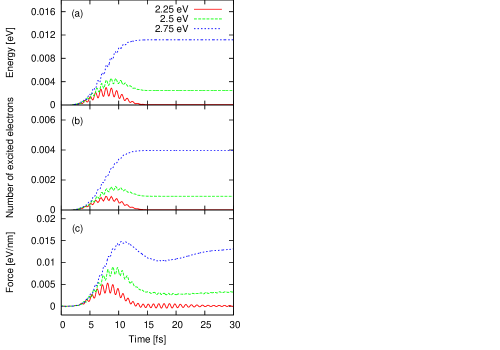
We next examine how the character of the electronic excitation changes as the laser frequency increases from below to above the direct band gap. Characteristics of the excitation as a function of time are shown for frequencies eV, 2.5 eV, and 2.75 eV in Fig. 4. The top panel shows the total increase in energy in the unit cell, including both electronic excitation energy and the electromagnetic field energy. The red solid curve shows the results for a frequency below the band gap. Here the energy drops almost to zero after the pulse is over, as to be expected. The green dashed curve, corresponding to a frequency at the band gap, shows that some excitation energy remains after the end of the pulse, comparable in magnitude to the total energy at the peak. Finally, the blue dotted curve shows that above the gap the laser-electron interaction is highly dissipative, leaving a large excitation energy in the final state. The middle panel in the figure shows the number of excited electrons as a function of time. This is calculated by taking the overlaps of the time-dependent occupied orbitals with the initial state static orbitals as in Ref. ot08 . The results are qualitatively very similar to what we found for the energy. Below the direct band gap, the excited electron shows a peak during the pulse and then drops off to a very small value in the final state. At higher frequencies, the excitations remain in the final state and it is not possible to distinguish the real excitation from the virtual one during the pulse. In summary, one sees an adiabatic response below the gap switching rather abruptly to a strongly dissipative response above the gap.
Finally, in the bottom figure, we show the calculated induced force for the three frequencies. Note that the ion positions are fixed in these calculations; the accelerations are small and the resulting displacements would be inconsequential. The lowest frequency, shown by the red solid curve, gives a force envelope that follows the shape of the pulse intensity. This is just what one would expect from the adiabatic formula (me97, , Eq. (2)). One also sees high frequency oscillations superimposed on the envelope of the curve. The frequency of these oscillations are twice the laser frequency, again as expected from the adiabatic formula. The green dashed curve shows the force for a laser frequency of , nearly at the direct band gap. One still sees a large peak at 10 fs associated with instantaneous high field intensity. However, there is a residual force after the end of the pulse which is rather constant with time. This is just what one expects for displacive mechanism. At this point, we have shown that TDDFT reproduces at a qualitative level the role of the two mechanisms. Beyond that, the relative sign associated with them can be extracted from the graph. The last case shown, , is eV above the direct gap. Here the displacive mechanism is completely dominant, although one can still see an enhancement of the force during the pulse.
We now integrate the time-dependent force to get the lattice distortion associated with the phonon coordinate. In principle, the restoring potential for the lattice vibration is included in the evolution equations, but the amplitude of the lattice displacement is too small numerically to include it in the direct integration. So for this part of the analysis we simply assume a harmonic restoring potential consistent with the observed optical phonon frequency, THz.
To analyze the characteristics of the coherent phonon, we fit the oscillation of the displacement to a cosine function as in conventional parametrization of the experimental reflectivity measurements ha03 ,
| (4) |
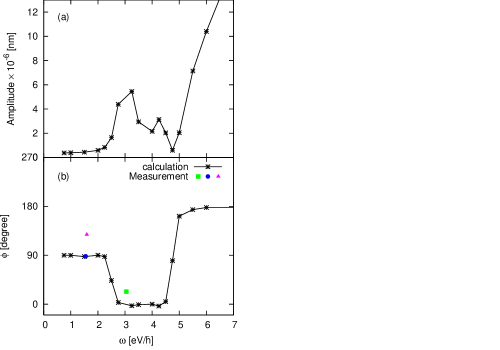
Fig. 5 shows the amplitude and phase as a function of laser frequency, fitted in the time interval 40-90 fs. Below the direct gap energy the phase is close to as expected for the Raman mechanism. The amplitude remains almost constant in this frequency region, also consistent with the Raman mechanism. One sees a quite sharp drop from that value to as the direct gap is crossed, showing the transition to the displacive behavior. The amplitude also shows a sudden increase across the direct gap. Several experimental measurements are also shown on the figure for the phase. Two of them ha03 ; ka09 are in the Raman regime. The theory supports the results of Ref. ha03 , which reports a value close to . The other measurement does not appear consistent with our theory or indeed with the other experiment. The phase has also been measured in the gap region ri07 , shown by the square on Fig. 5(b). This point should be compared with the theory at the corresponding calculated gap energy, 2.4 eV. In both theory and experiment the phase has decreased from the Raman value, but decrease seems larger for the experimental measurement. Both results are in a range where the mechanism is changing rapidly. All in all, we find the agreement quite satisfactory on a qualitative level, particularly since the phase could have come out with an opposite sign ().
At higher frequencies, the theoretical phase goes to zero as expected for the displacive mechanism, but then it rises again beyond 4.5 eV, approaching at eV. There is a corresponding dip and growth in the amplitudes associated with a change in the sign of the displacive force. Different electron orbitals are excited at the high frequency, and apparently those orbitals have an opposite sign contribution to the displacive shift.
We also examined the dependence of amplitude and phase of the coherent phonon on the intensity of the laser pulse. At all frequencies we examined, the amplitude of the phonon is proportional to the laser intensity. In the impulsive Raman mechanism which is applicable below the band gap, this dependence is expected from the adiabatic formula (me97, , Eq. (2)). In the displacive mechanism, it is also expected if the medium is excited by a one-photon absorption process. The phase of the coherent phonon is found to be sensitive only on the frequency but not on the intensity until the multiphoton absorption processes become significant.
In summary, we have derived and carried out a computational method to apply time-dependent density functional theory to laser-lattice interactions, taking as an example the excitation of coherent optical phonon by femtosecond-scale laser pulse in silicon. The qualitative agreement between theory and measured phase of the coherent phonon confirms the utility of the TDDFT to describe electron dynamics resulting from intense laser pulse in solids.
The numerical calculation were performed on the massively parallel cluster T2K-Tsukuba, University of Tsukuba, and the supercomputer at the Institute of Solid State Physics, University of Tokyo. TO acknowledges support by the Grant-in-Aid for Scientific Research No. 21740303. GFB acknowledges support by the National Science Foundation under Grant PHY-0835543 and by the DOE under grant DE-FG02-00ER41132.
References
- (1) F. Rossi and T. Kuhn, Rev. Mod. Phys. 74 895 (2002).
- (2) E. Runge and E.K.U. Gross, Phys. Rev. Lett. 52, 997 (1984).
- (3) R. Merlin, Solid State Comm. 102 207 (1997).
- (4) T.E. Stevens, J. Kuhl and R. Merlin, Phys. Rev. B65 144304 (2002).
- (5) H.J. Zeiger, et al., Phys. Rev. B45 768 (1992).
- (6) R. Scholz, T. Pfeifer and H. Kurz, Phys. Rev. B47 16229 (1993).
- (7) A.V. Kuznetsov and C.J. Stanton, Phys. Rev. Lett. 73 3243 (1994).
- (8) M. Hase, M. Kitajima, A. Constantinescu, and H. Petek, Nature 426 51 (2003).
- (9) D.M. Riffe and A.J. Sabbah, Phys. Rev. B76 085207 (2007).
- (10) G.F. Bertsch, J.I. Iwata, A. Rubio, and K. Yabana, Phys. Rev. B62 7998 (2000).
- (11) T. Otobe, et al., Phys. Rev. B 77 165104 (2008).
- (12) J.P. Perdew, A. Zunger, Phys. Rev. B 23, 5048 (1981).
- (13) N. Troullier and J. Martins, Phys. Rev B 43 1993 (1991).
- (14) K. Yabana, G.F. Bertsch, Phys. Rev. B 54, 4484 (1996).
- (15) K. Kato, A. Ishizawa, K. Oguri, K. Tateno, T. Tawara, H. Gotoh, M. Kitajima, H. Nakano, Japanese J. Appl. Phys. 48 100205 (2009).