∎
Tel.: +358-9-47022973
Fax: +358-9-47022969
22email: ve@boojum.hut.fi 33institutetext: D.E. Zmeev 44institutetext: School of Science and Astronomy, The University of Manchester, UK
Vortex core contribution to textural energy in 3He-B below
Abstract
Vortex lines affect the spatial order-parameter distribution in superfluid 3He-B owing to superflow circulating around vortex cores and due to the interaction of the order parameter in the core and in the bulk as a result of superfluid coherence over the whole volume. The step-like change of the latter contribution at (at a pressure of 29 bar) signifies the transition from axisymmetric cores at higher temperatures to broken-symmetry cores at lower temperatures. We extended earlier measurements of the core contribution to temperatures below , in particular searching for a possible new core transition to lower symmetries. As a measuring tool we track the energy levels of magnon condensate states in a trap formed by the order-parameter texture.
Keywords:
Superfluid 3He-BVortices Texture Vortex core transitionpacs:
67.30.he 75.45.+j1 Introduction
In superfluid 3He Cooper pairing in states with spin and orbital momentum leads to multi-component order parameters and a variety of topological defects, including quantized vortex lines of many different structures vortrev . The simplest vortex structure in any superfluid is a phase vortex with a hard singular core, i.e. with a core of approximately coherence length in radius, where all order parameter components go to zero at the axis. Such vortices exist in superfluid 4He and in superconductors with conventional s-wave pairing. In systems with multi-component order parameters, like 3He, such a simple possibility is never realized. In vortices with the lowest energy the order parameter in the core may deviate from that in the bulk, but remains finite throughout the whole core. Such vortices with a hard, but non-singular core are realized in the B phase of superfluid 3He.
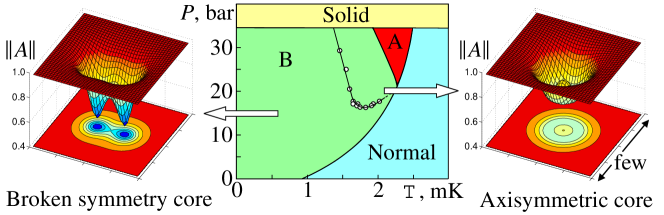
In fact, multiple choices for the order parameter structure in the non-singular core are possible. 3He-B was the first system where a transition between two different core structures was found experimentally coretrans . As seen in the phase diagram in Fig. 1, vortices, which are stable in 3He-B at temperatures above about and pressures above about 15 bar, possess axisymmetric cores, like vortices in most other known systems. In vortices, which are stable at lower pressures or temperatures, the axial symmetry is broken. Each such vortex can be viewed as a bound pair of two half-quantum vortices.
Superfluid coherence is preserved across the whole volume when vortices with non-singular cores are present. The rigidity of the order parameter (supported by the gradient energy) leads to a smooth variation of the order parameter across the sample, which is called a texture. In bulk 3He-B in a magnetic field the order parameter has the form
| (1) |
where is the superfluid phase, is the uniaxial gap matrix in a magnetically distorted B phase and is the matrix of rotation around the axis by the angle which characterizes the broken relative spin-orbit symmetry. The spin-orbit interaction fixes at the value . Thus the texture is essentially formed by the spatial variation of the unit vector . Alternatively, the texture of the orbital anisotropy axis , which is defined in the presence of the magnetic field, can be considered.
Various energies affect the orientations of the and unit vectors in the texture Thuneberg . The magnetic anisotropy energy prefers . The walls of the container orient perpendicular to themselves. A counterflow between superfluid and normal velocities and tends to pull along the flow. Here we are most interested in the contribution of vortex lines to the textural energy. It can be written in the form
| (2) |
where is the magnetic anisotropy parameter, is the vorticity, is the rotation velocity, and is the dimensionless parameter characterizing the vortex contribution to the textural energy. For the equilibrium array of vortex lines is proportional to the number of vortices and hence . Later we will use as an intrinsic velocity-independent parameter.
The vortex effect on the texture has two contributions: . The first contribution comes from the quantized superflow circulating around vortex cores and is independent of the core structure. The other contribution comes directly from the cores since the order parameter has to change smoothly between its bulk value and the value in the core. The latter contribution is of special interest since it depends on the vortex core structure. The step-like change in was in fact the first experimental signature of the transition in the vortex core coretrans .
The cores of 3He-B vortices have broken parity, which leads to a gyromagnetic effect: The value of depends on the orientation of the vortices with respect to the magnetic field direction: , where is the gyromagnetic parameter, the plus sign refers to vortices with their circulation oriented along the magnetic field and the minus sign is for the opposite orientation. Both and change at the core transition gyro .
In this work the previous measurements of at HakonenJLTP , have been extended to below . One of the goals was to check for the possible existence of other transitions in the vortex core structure. In Sec. 2 we explain the general principles of probing the texture using spin-wave resonances. In Sec. 3 we describe a novel precessing state, related to Bose-Einstein condensation of magnons, which is used to determine the positions of the resonances at low temperatures. In Sec. 4 we present our results for the textural energy parameters and . Finally in Sec. 5 we demonstrate how the NMR techniques developed for the measurements of can be used to probe vortex dynamics at the lowest temperatures.
2 Principles of the measurement
One to determine the parameter is to measure how the texture in a sample of 3He-B changes with the density of vortex lines while all other contributions to the textural energy are kept constant. In practice this requires stable temperature and pressure and the absence of a global counterflow, i.e. measurements in the equilibrium vortex state as a function of the angular velocity .
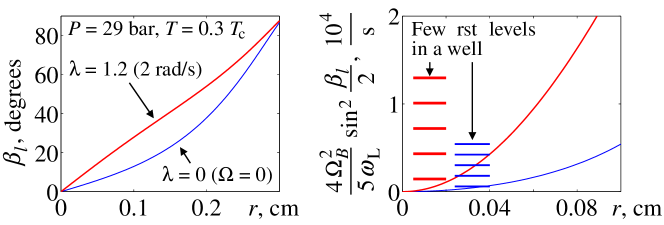
Our sample is in a cylindrical container with a diameter of 6 mm. The axis of the cylinder is parallel to both magnetic field and rotation velocity with a precision of about 1∘. In such a sample the texture is usually of the axially symmetric flare-out type: The orbital anisotropy vector is oriented along the axis in the center of the sample and smoothly reorients perpendicular to the walls of the container at the sample edges. The polar angle of the -vector grows approximately linear at small radii as shown in Fig. 2 (left). Since the effect from vortices is to turn vector away from the axial orientation, with increasing the slope increases. It is this slope which we probe in the experiment.
The remarkable feature of superfluid 3He, which makes NMR a useful tool for probing the order parameter, is the spin-orbit interaction in the Cooper pairs. In our case of the B phase and small tipping angles of the magnetization the energy of spin-orbit interaction is qballprl
| (3) |
where is the magnetic susceptibility, is the gyromagnetic ratio and is the Leggett frequency in the B phase. At small radii (and thus small ) the fourth-order term in the expression for can be neglected. Additionally , and thus has the shape of a harmonic potential well close to the axis of the sample. In alternative language one can say that the texture forms a nearly-harmonic trap for magnon excitations.
An analysis of the magnetization dynamics in the presence of such a potential vwspinwaves leads to the conclusion that there exist localized spin waves with frequencies which correspond to levels in the textural potential well:
| (4) |
where is the Larmor frequency, is the dipolar length and n is the quantum number. In the non-linear regime (when magnon filling of a level is sufficiently high) such a spin wave can also be called a Bose-Einstein condensate of magnons in a trap 20ybec . In this paper we use both languages interchangeably. Some similarities of such precessing states to the Q-balls of high energy physics were also suggested qballprl .
The frequencies of the trapped spin waves can be determined with NMR as described in the following section. As shown in Fig. 2 (right), these frequencies are a sensitive tool to probe the texture and thus the value of the vortex textural energy parameter . Note that for the spatially homogeneous rf field in a typical NMR experiment coupling exists only with spin wave states of even quantum number n.
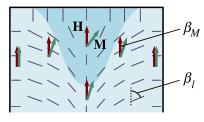
In our experiment the texture is actually not axially uniform, since the NMR pick-up coil is placed close to the top end plate of the sample cylinder. Moreover the inhomogeneity of the static NMR field can provide additional axial trapping in a local minimum of the field due to the Zeeman energy. As a result, the trap for magnons is modified and becomes 3-dimensional, as schematically shown in Fig. 3. Correspondingly the levels for the spin waves become
| (5) |
Here m is a new axial quantum number and the trapping frequency has some fixed value which is not under experimental control in this measurement. The radial trapping frequency is determined by the texture as before in Eq. (4). In our experiment .
Note that the precessing states discussed here represent coherent precession of the magnetization with the same phase over the whole volume, despite magnetic field and textural inhomogeneities. The amplitude of the precession , however, changes over the volume as prescribed by the wave function of the magnon condensate in the potential well since is proportional to the density of magnons .
3 CW NMR response
The 3He-B sample is installed in the rotating nuclear demagnetization cryostat, where it can be cooled to below in rotation with velocities up to 3.5 rad/s. The measurements have been done at the pressure bar at two values of the static magnetic NMR field which correspond to the Larmor frequencies MHz and 0.894 MHz. The NMR pick-up coil is part of a tuned tank circuit with a Q value above 5000. In the cw NMR measurement the rf excitation frequency is kept fixed at the resonance frequency of the tank circuit. The NMR spectra are measured as a function of the frequency shift by sweeping the magnetic field and thus the Larmor frequency . The temperature is measured from the damping of a quartz tuning fork oscillator fork , which is calibrated against a 3He melting-curve thermometer. More details on the experimental setup can be found in Ref. expsetup .
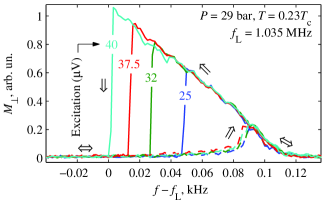
When the ground level in the textural potential well (corresponding to in Eq. (5)) is crossed during a downward sweep of frequency (upward sweep of magnetic field), the magnon condensate starts to build up, Fig. 4. The total transverse magnetization is related to the number of magnons in the condensate . For small (which is not always the case) . When the number of magnons in the condensate grows, the resonance frequency decreases due to magnon-magnon interactions. (This dependence is not included in Eq. (5).) The interaction comes from two effects: First, the negative fourth-order term in the spin-orbit interaction energy (3). Second, the texture is not rigid enough and yields under the influence from the precessing spin (owing to the spin-orbit interaction): It becomes flatter in the part of the sample close to the axis and decreases qballprl .
The dependence of the precession frequency on the number of magnons is a characteristic of a particular state. That is why in Fig. 4 does not depend on the amplitude of the rf excitation. This non-linearity is the reason why such a NMR state is created only in one direction of the NMR field (or frequency) sweep. To find the frequency of the ground level in the textural potential well which corresponds to the absence of magnons we fit a straight line to the lower part of the vs dependence and take its intersection with the baseline.
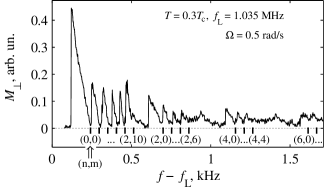
Other levels in the magnon trap can be identified in a similar way, as shown in Fig. 5. This example is measured in vortex-free rotation. The groups of peaks corresponding to different radial quantum numbers n are clearly visible. The closely spaced peaks within each group correspond to different axial quantum numbers m. The vertical lines below the axis represent fits to Eq. (5) with kHz and Hz. The plot shows that the trap is indeed nearly harmonic close to the bottom of the potential well.
By changing the rotation velocity one can verify that varies as expected owing to the texture changes while remains constant excbec . Later in this paper we are only interested in the dependence of on the rotation velocity, or more precisely, only in the shift with respect to its value without rotation. As can be seen from Eq. (5) this shift coincides with the shift of the ground-level peak , which is the quantity measured in the experiment.
4 Determination of the core contribution
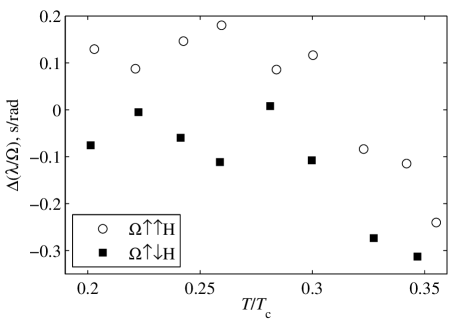
The measurement proceeds as follows: At a constant temperature below the rotation velocity is increased to more than 2 rad/s. This leads to vortex formation slowform and ultimately to the equilibrium vortex state. After that rotation is reduced in steps while the ground level spin wave resonance is continuously monitored. At any given rotation velocity we wait until the frequency of the level stops changing. After initial spin-up this may take more than an hour (see Sec. 5), but after smaller downward steps in the relaxation time is shorter. Finally we plot the shift of the ground-level resonance with respect to its position at versus , see Fig. 6 (left) for examples.
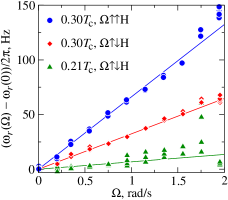
The shift is due to the vortex contribution to the textural energy. Two examples at for vortices which are parallel or antiparallel to the magnetic field direction show that such vortices exert clearly different effect on the texture, which proves the gyromagnetic effect. The third example at demonstrates that at low temperatures the effect from the vortices antiparallel to the magnetic field is small but still measurable.
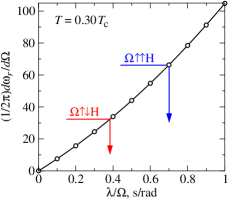
As can be seen from the figure, this shift is a linear function of at rotation velocities below 1 rad/s. The slope is converted to the corresponding value of in the following manner. For the conditions of the experiment (pressure, temperature, magnetic field) we numerically calculate the texture on a grid of and values. We use the calculation method and the 3He-B parameters from Ref. juhaprog . For each texture we determine the value using the slope at and Eq. (4). As in the experiment, turns out to be a linear function of at rad/s. The slope , as determined from numerical calculations for , is plotted in Fig. 6 (right) with circles. As one can see, this dependence is monotonic and smooth. We then use interpolation to convert the experimentally measured slopes to the corresponding values of .
All our results for for the two vortex orientations in the temperature range are collected in Fig. 7. Also included in the plot are data from Ref. HakonenJLTP at the pressure 29.3 bar and kHz. These data were measured also with the spin-wave resonance technique using comparison to texture calculations. The texture calculation techniques have significantly improved since publication of Ref. HakonenJLTP . Therefore we reanalyzed the measured spin-wave resonance frequencies from Ref. HakonenJLTP (Fig. 19a) using the same texture calculation program as for our measurements. This resulted in a slight upward correction for the values of . These corrected points are plotted at . The solid line in the plot shows the theoretical calculation of the flow-related contribution from Ref. Thuneberg .
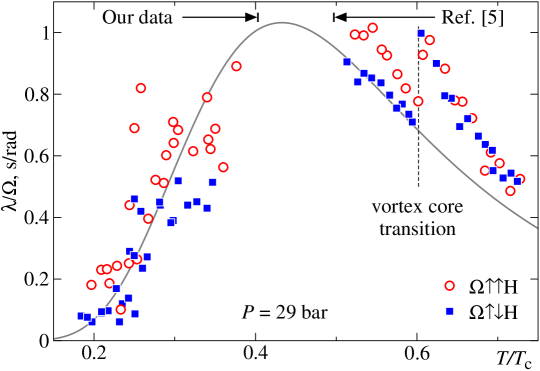
In general the agreement is good between old measurements at higher temperatures and our new measurements at lower temperatures. The theoretical curve also captures the overall trend and magnitude of well. Our data points exhibit rather large scatter. One possible cause for this scatter is the remaining disorder in the vortex cluster, when it is prepared at low temperatures. As explained in the next section, when vortex lines are not all perfectly aligned with the rotation axis, the effective value of (determined by the average effect of all vortex lines) may change. At low temperatures vortex formation proceeds typically through instabilities and interactions of the existing vortices, often in a localized turbulent burst expsetup . The vortex configuration created in such a process is far from the equilibrium one and its relaxation to the equilibrium state is impeded by the existence of many local energy minima in the vortex configurations. In addition the small value of the dissipative mutual friction parameter at low temperatures slows down the relaxation. One way to avoid such problems would be to prepare the vortex cluster at higher temperatures (above ) and cool it down in rotation to low temperatures before doing the measurement. Such measurements would require more time. Additionally in this way there is a chance to miss a transition in vortex core structure, if it is of first order and can be substantially supercooled.
The flow-related contribution to drops exponentially to zero as the temperature decreases since the superfluid density anisotropy vanishes at . Thus the finite value of in the limit signifies the contribution from the vortex cores. As can be seen from Fig. 7, indeed the measured values of approach a constant in the limit, which is different for the two vortex orientations. To demonstrate this more clearly we plot in Fig. 8 the experimental points averaged in narrow temperature bins and additionally we subtract the theoretical estimation of the flow contribution to . Indeed the resulting points are approximately temperature independent below . Unfortunately, the theoretical calculations of the flow contribution are not precise enough to determine the absolute value of the pure core contribution to . The best way to achieve this goal will be to extend measurements to temperatures of about where the flow contribution can be completely ignored.
The magnitude of the gyromagnetic effect can be found by comparing for the two vortex orientations. The average difference between for these orientations, i.e. , is found to be s/rad. This difference should increase with decreasing magnetic field inversely proportional to . Thus we can conclude that at about twice smaller magnetic field than used in the present experiment, the value of for orientation will become negative in limit. In fact, the measurements in Fig. 7 are done for two slightly different magnetic field magnitudes, but within the scatter the field dependence of is not observed.
An interesting question, which measurements of can answer, is whether on the way to zero temperature there are more transitions in the vortex core structure. The core of the low-temperature vortex still possesses 2-fold symmetry which in principle can be broken in other phase transitions. However, in our measurements we have not found clearly identifiable jumps in the temperature dependence of with an associated hysteresis which would indicate possible transitions in the vortex core structure.
Finally we note that the core contribution to should in fact have some temperature dependence in the limit owing to the existence of bound fermion states in the vortex core corefermions . The effect of the core-bound quasiparticles on has not been considered theoretically so far. From general principles this contribution should have a power-law temperature dependence (most probably volpriv ), since even the lowest experimental temperatures are much larger than the so-called minigap, the spacing between levels of the bound fermion states. This is unlike the situation in the bulk, where and the flow contribution to freezes out fast, as . Thus the contributions from the core-bound quasiparticles is expected to dominate the temperature dependence of in the limit. To observe it, though, one has to improve the accuracy of measurements from that in Fig. 8. One possible improvement is to repeat the measurements at zero pressure. Since the size of the vortex core increases towards lower pressure, the magnitude of the vortex core contribution to textural energy should increase.
5 Probing vortex dynamics
The techniques developed for the measurement of can also be used to study vortex dynamics. In typical measurements, which use linear NMR response, one can track the development of the global azimuthal flow in the sample using the so called counterflow peak in the NMR spectrum expsetup ; spinupdn . The global axial flow produced by the twisted vortex state affects the shape of the Larmor peak in the cw NMR spectrum twisted . Such techniques relies on the measurement of the order-parameter texture, which depends on the distribution of the global flow and vortices in the sample. The measurement of the texture using spin-wave resonances, as performed in this work, is a similar technique. However, its high sensitivity to the texture profile close to the axis of the sample makes it especially useful for the cases when the global flow is absent. Thus it can provide additional insight to the processes of establishing equilibrium and order in the vortex cluster after a perturbation, or to the loss of polarization and even turbulence when time-dependent rotation drive is applied.
When vortex lines are not completely polarized along the rotation axis, their effect on the texture is renormalized and the parameter in the textural energy is replaced by some effective parameter which depends on the particular vortex configuration. In Ref. juhalt the model of the equilibrium vortex cluster with superimposed fluctuations is considered. If the vorticity is decomposed as in an equilibrium part and a random part with , then
| (6) |
where and . Here the coordinate axis is directed along the rotation axis and the random vorticity is assumed isotropic in the plane perpendicular to rotation axis. As can be seen from Eq. (6), the value of can be larger than , if dominates, or it can be smaller than , or even of different sign than , if dominates.
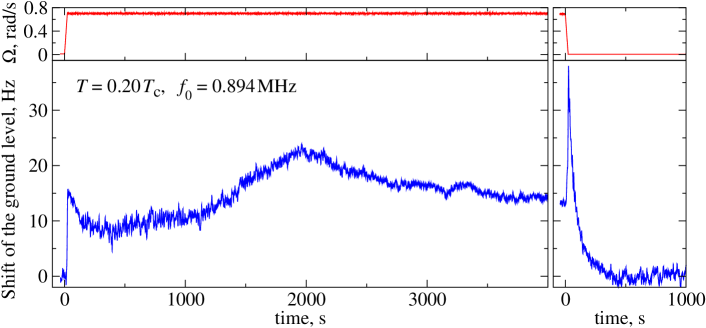
The time dependence of can be observed through the frequency shift of the ground magnon level in the textural potential well. In Fig. 9 we plot the responses to a rapid increase of the rotation velocity from rest (so-called spin-up) and to a rapid stop of rotation from the equilibrium vortex state (spin-down). These processes were studied previously at low temperatures from the linear NMR response of the counterflow peak spinupdn . The conclusion from these measurements was that the spin-down process is always laminar in the bulk volume, with a smoothly decreasing density of almost straight vortex lines. The spin-down response in Fig. 9 (right) agrees with this conclusion: Here the ground level resonance first moves to higher frequencies due to the build up of counterflow between the stationary normal component and superfluid component, which still rotates due to the presence of vortices. The relaxation of the vortex density to zero happens within a time which is in agreement with the measurements of Ref. spinupdn .
The response to spin-up in Fig. 9 (left) shows more features. Previous measurements slowform ; spinupdn demonstrated that the spin-up behaviour depends on the number and the configuration of the pre-existing vortices (at zero rotation), so-called dynamic remnants remnants , which act as seeds for the creation of new vortices. For the spin-up in Fig. 9 the waiting time at after the previous spin-down was 25 min and estimated number of remnants is of the order of hundred. The initial shift of the resonance peak to higher frequencies after the increase of is explained by the increase of the azimuthal counterflow velocity. As new vortices are formed the counterflow velocity and the frequency shift of the magnon level decrease. Eventually the vortex contribution to the textural energy becomes significant and the peak again moves to higher frequency. In a smooth laminar process the evolution of the frequency shift of the ground magnon level would have only one minimum between the values dominated by the counterflow and vortex cluster. The dependence in Fig. 9 has one extra maximum (at time around 2000 s). Thus the simple model of laminar spin-up is not applicable here and contribution from turbulent bursts, which can build component in Eq. (6), is possible.
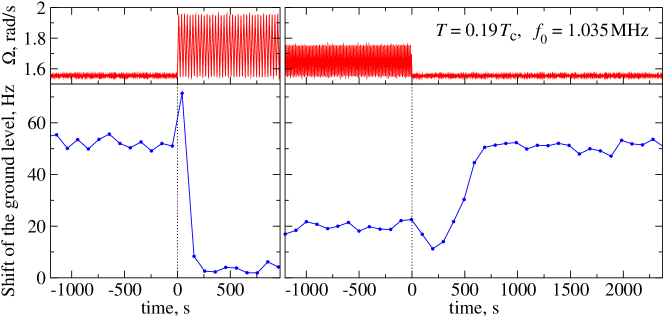
An extra vorticity in the horizontal plane, perpendicular to rotation velocity, leads to a decrease of the effective value of . Such vorticity appears, for example, in Kelvin-wave excitations of individual vortex lines or global oscillating modes of the vortex array bar . One can try to excite such modes with oscillating drives. Two examples of measurements are shown in Fig. 10. As can be seen from these plots, increasing the amplitude of the oscillating component in the drive indeed leads to a decreasing frequency shift of the ground state. Possible interpretation of this effect is that the effective value of decreases. One can make to be almost zero which would require the vortex line length in the horizontal plane to be comparable with the line length along the rotation axis. Unfortunately it is impossible to determine the exact vortex configuration from the measurement of the single parameter . More detailed studies of the transients, when the modulation is switched on and off, can in principle provide additional information.
6 Conclusions
The spin-wave resonance peaks in the cw NMR absorption spectrum of 3He-B provide sensitive probes of the order-parameter texture and useful tools to determine textural parameters. Previously they were used at temperatures above to measure, for example, the dipolar coherence length and the textural energy parameter for vortices. Recently a non-linear modification of such spin waves or, in alternative language, a Bose-Einstein condensate of magnons in a trap, created by the order-parameter texture, was discovered at low temperatures. We used this novel precessing state to extend the measurement of from to below . Earlier information on in this temperature range was only available from complicated and less reliable analysis of the overall shape of the linear NMR absorption spectrum.
We found that the main temperature dependence of in this temperature range comes from the flow circulating around vortex cores, in agreement with theoretical calculations. This contribution decreases exponentially to zero, when the temperature approaches zero. Thus from the measurements at the lowest temperatures the vortex core contribution to can be determined. The gyromagnetic effect, i.e. the difference between the values of for vortices parallel and antiparallel to the magnetic field, is clearly observed in the whole temperature range studied. No sign of another transition in the vortex core structure was found (in addition to the axial symmetry breaking at ).
Our preliminary measurements indicate that the magnon BEC can be a useful tool to probe vortex dynamics, in particular wave excitations on vortex lines.
Acknowledgements.
We thank Yu.M. Bunkov and G.E. Volovik for stimulating discussions and R.E. Solntsev for help with the experiment. This work was partially supported by the Academy of Finland and by the EU-funded Integrating Activity project MICROKELVIN.References
- (1) M.M. Salomaa and G.E. Volovik, Rev. Mod. Phys. 59, 533 (1987).
- (2) O.T. Ikkala, G.E. Volovik, P.J. Hakonen, Yu.M. Bunkov, S.T. Islander, and G.A. Kharadze, Pis’ma Zh. Eksp. Teor. Fiz. 35, 338 (1982) [JETP Lett. 35, 416 (1982)].
- (3) E.V. Thuneberg, J. Low Temp. Phys. 122, 657 (2001).
- (4) P.J. Hakonen, M. Krusius, M.M. Salomaa, J.T. Simola, Yu.M. Bunkov, V.P. Mineev and G. E. Volovik, Phys. Rev. Lett. 51, 1362 (1983).
- (5) P.J. Hakonen, M. Krusius, M.M. Salomaa, R.H. Salmelin, J.T. Simola, A.D. Gongadze, G.E. Vachnadze, and G.A. Kharadze, J. Low Temp. Phys. 76, 225 (1989).
- (6) Yu.M. Bunkov and G.E. Volovik, Phys. Rev. Lett. 98, 265302 (2007).
- (7) D. Vollhardt and P. Wölfle, The Superfluid Phases of Helium 3, pp. 387–388. Taylor & Francis, London (1990).
- (8) G.E. Volovik, J. Low Temp. Phys. 153, 266 (2008).
- (9) M. Blažková, M. Človečko, V.B. Eltsov, E. Gažo, R. de Graaf, J.J. Hosio, M. Krusius, D. Schmoranzer, W. Schoepe, L. Skrbek, P. Skyba, R.E. Solntsev, and W.F. Vinen, J. Low Temp. Phys. 150, 525 (2008).
- (10) R. de Graaf, R. Hänninen, T.V. Chagovets, V.B. Eltsov, M. Krusius, and R.E. Solntsev, J. Low Temp. Phys. 153, 197 (2008).
- (11) Yu.M. Bunkov, V.B. Eltsov, R. de Graaf, P.J. Heikkinen, J.J. Hosio, M. Krusius, and G.E. Volovik, arXiv:1002.1674.
- (12) A.P. Finne, V.B. Eltsov, G. Eska, R. Hänninen, J. Kopu, M. Krusius, E.V. Thuneberg, and M. Tsubota, Phys. Rev. Lett. 96, 085301 (2006).
- (13) J. Kopu, J. Low Temp. Phys. 146, 47 (2007).
- (14) N.B. Kopnin, and G.E. Volovik, Phys. Rev. B 57, 8526 (1998).
- (15) G.E. Volovik, private communication.
- (16) V.B. Eltsov, R. de Graaf, P.J. Heikkinen, J.J. Hosio, R. Hänninen, M. Krusius, and V.S. L’vov, arXiv:1005.0546.
- (17) V.B. Eltsov, A.P. Finne, R. Hänninen, J. Kopu, M. Krusius, M. Tsubota, and E.V. Thuneberg, Phys. Rev. Lett. 96, 215302 (2006).
- (18) J. Kopu, V.B. Eltsov, A.P. Finne, M. Krusius, and G.E. Volovik, AIP Conference Proceedings 850, 181 (2006).
- (19) R.E. Solntsev, R. de Graaf, V.B. Eltsov, R. Hänninen, and M. Krusius, J. Low Temp. Phys. 148, 311 (2007).
- (20) K.L. Henderson and C.F. Barenghi, Europhys. Lett. 67, 56 (2004).
- (21) M. Krusius, P.J. Hakonen, and J.T. Simola, Physica 126B, 22 (1984).
- (22) E.V. Thuneberg, Phys. Rev. B 36, 3853 (1987).