Lag-luminosity relation in gamma-ray burst X-ray flares
Abstract
In strict analogy to prompt pulses, X-ray flares observed by Swift-XRT in long Gamma-Ray Bursts define a lag-luminosity relation: . The lag-luminosity is proven to be a fundamental law extending 5 decades in time and 5 in energy. This is direct evidence that GRB X-ray flares and prompt gamma-ray pulses are produced by the same mechanism.
Keywords:
gamma-ray: bursts:
98.70.Rz1 Introduction
The presence of X-ray flares superimposed to Gamma-Ray Bursts (GRBs) X-ray afterglows is one of the major discovery of the Swift satellite. Flares are observed as episodic, large-scale amplitude variations in the light-curves with a typical . Their temporal properties (see Chincarini et al. (2010), Margutti et al. (2010) and Bernardini et al. (2010) for a recent compilation) make it difficult to interpret the observed emission in the framework of the external shock scenario. Instead, the flare emission is likely to be associated to episodes of internal engine activity due to the same source which powers the gamma-ray prompt pulses. It is therefore of particular interest to investigate the flares-prompt pulses connection from the observational point of view: do flares follow the entire set of empirical relations found from the analysis of prompt emission pulses?
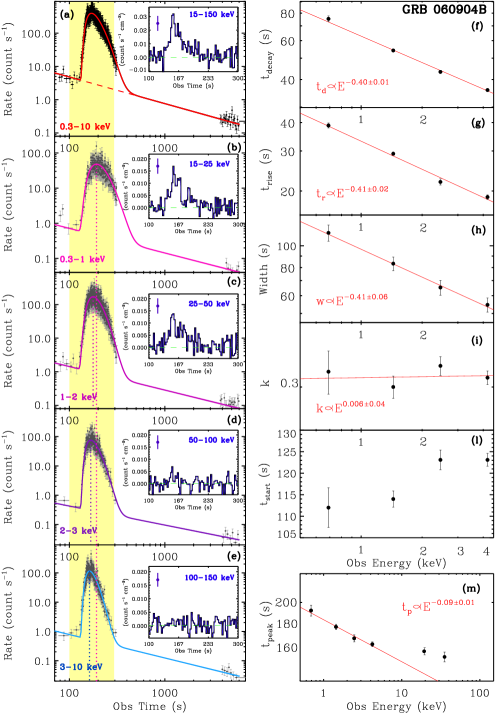
I address this question analysing a set of 9 bright X-ray flares in 4 different X-ray energy band inside the 0.3-10 keV of the X-ray telescope (XRT) on board Swift. Each flare profile in each energy band is modelled using a Norris 2005 profile Norris et al. (2005). Figure 1 shows the result for the flare detected in GRB 060904B taken as an example: a general trend can be seen for high energy flare profiles to rise faster, decay faster and peak before the low energy emission. The same behaviour is found in the case of prompt pulses (see e.g. Norris et al. (2005)). In particular, from Fig. 1 a tendency is apparent for the peak in the harder channel to lead that in the softer channel: this directly translates into a measurable, positive peak lag. In the following I concentrate on the analysis of the lag-luminosity relation in long GRB X-ray flares: I refer the reader to reference Margutti et al. (2010) for a detailed and comprehensive analysis of the temporal and spectral properties of bright X-ray flares.
2 Results and discussion
X-ray flares define a rather tight lag-luminosity relation:
| (1) |
where is the rest frame peak lag calculated as the difference in time between the flare peak times in the 0.3-1 keV and the 3-10 keV energy bands. The subscript reminds that the time lag is calculated in the X-ray regime. We properly account for the sample variance following the method outlined by D’Agostini (2005). Errors are provided at 90% c.l.
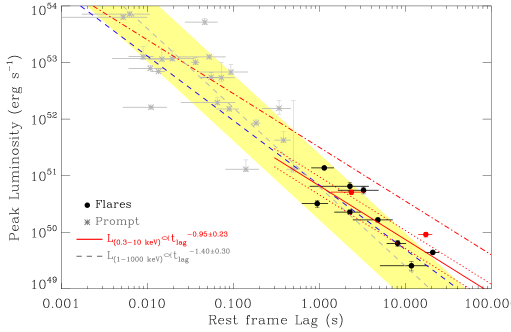
The lag-luminosity is one of the key relations which connects the GRB prompt temporal and spectral properties: discovered by Norris et al. (2000) as a time integrated property of each particular burst, the relation was conclusively demonstrated to reflect pulses rather than bursts properties by Hakkila et al. (2008). Figure 2 shows a direct comparison between the flare and the prompt properties in the lag-luminosity diagram: this is of particular interest since long and short bursts are known to occupy different regions of the plane (see e.g. Gehrels et al. (2006)). Flares in long GRB are consistent with the long GRBs lag-luminosity relation. However, we should consider that: first, in Fig. 2 the lag of the prompt data is calculated using the Cross Correlation Function (CCF) to the entire BAT light-curve and consequently reflects a time integrated property Ukwatta et al. (2010). Second: for the prompt data the lag is defined as the time difference between light-curve structures in the 50-100 keV and 100-200 keV channels. For the flares we calculated the peak lag between X-ray energy bands. In both cases the lag has been computed between band-passes around the event spectral peak energy. Third: the prompt peak luminosity is calculated in the 1-10000 keV rest frame energy band, while for the flares the peak luminosity is calculated from the 0.3-10 keV (observed) bandpass (which is expected to be a factor of 2-3 below the 1-10000 keV value).
With these caveats in mind, it is remarkable that the best fit slope of the flare lag-luminosity is consistent with the results based on BAT data and reported in Ukwatta et al. (2010): (red dot dashed line in Fig. 2). It is not surprising that this relation overestimates the flare luminosity which is computed in a narrower energy window by a factor . Only a marginal consistency can be quoted with Hakkila et al. (2008) who reported an index . Our findings are instead fully consistent with Norris et al. (2000) (both in normalization and index), with a power-law index 1.14 (blue dashed line in Fig. 2): these authors reported lags between BATSE energy bands 100-300 kev and 25-50 keV. The same is true if we consider the lag-luminosity power-law index by Schaefer (2007) who reported a value of 1.01.
This result strongly suggests that whatever is the mechanism at work in the GRB prompt emission, the same is also the source of the X-ray flare emission hundreds of seconds later. The lag-luminosity relation has been proven to be a fundamental law extending decades in energy and decades in time.
References
- Chincarini et al. (2010) G. Chincarini, J. Mao, R. Margutti, M. G. Bernardini, C. Guidorzi, F. Pasotti, D. Giannios, M. Della Valle, A. Moretti, P. Romano, P. D’Avanzo, G. Cusumano, and P. Giommi, MNRAS in press (2010), 1004.0901.
- Margutti et al. (2010) R. Margutti, C. Guidorzi, G. Chincarini, M. G. Bernardini, F. Genet, J. Mao, and F. Pasotti, MNRAS in press (2010), 1004.1568.
- Bernardini et al. (2010) M. G. Bernardini, R. Margutti, G. Chincarini, C. Guidorzi, J. Mao, and F. Pasotti, ArXiv e-prints (2010), 1004.3831.
- Norris et al. (2005) J. P. Norris, J. T. Bonnell, D. Kazanas, J. D. Scargle, J. Hakkila, and T. W. Giblin, ApJ 627, 324–345 (2005), arXiv:astro-ph/0503383.
- Ukwatta et al. (2010) T. N. Ukwatta, M. Stamatikos, K. S. Dhuga, T. Sakamoto, S. D. Barthelmy, A. Eskandarian, N. Gehrels, L. C. Maximon, J. P. Norris, and W. C. Parke, ApJ 711, 1073–1086 (2010).
- Norris et al. (2000) J. P. Norris, G. F. Marani, and J. T. Bonnell, ApJ 534, 248–257 (2000).
- D’Agostini (2005) G. D’Agostini, ArXiv e-prints (2005), 0511182.
- Hakkila et al. (2008) J. Hakkila, T. W. Giblin, J. P. Norris, P. C. Fragile, and J. T. Bonnell, ApJL 677, L81–L84 (2008), 0803.1655.
- Gehrels et al. (2006) N. Gehrels, J. P. Norris, S. D. Barthelmy, J. Granot, Y. Kaneko, C. Kouveliotou, C. B. Markwardt, P. Mészáros, E. Nakar, J. A. Nousek, P. T. O’Brien, M. Page, D. M. Palmer, A. M. Parsons, P. W. A. Roming, T. Sakamoto, C. L. Sarazin, P. Schady, M. Stamatikos, and S. E. Woosley, Nat 444, 1044–1046 (2006), arXiv:astro-ph/0610635.
- Schaefer (2007) B. E. Schaefer, ApJ 660, 16–46 (2007), arXiv:astro-ph/0612285.