Signatures of a quantum Griffiths phase in a d-metal alloy close to its ferromagnetic quantum critical point
Abstract
We report magnetization () measurements close to the ferromagnetic quantum phase transition of the d-metal alloy Ni1-xVx at a vanadium concentration of . In the diluted regime (), the temperature () and magnetic field () dependencies of the magnetization are characterized by nonuniversal power laws and display scaling in a wide temperature and field range. The exponents vary strongly with and follow the predictions of a quantum Griffiths phase. We also discuss the deviations and limits of the quantum Griffiths phase as well as the phase boundaries due to bulk and cluster physics.
1 Introduction
Magnetic quantum phase transitions (QPT) have been studied in transition metal
alloys and in heavy-fermion compounds tuned, e.g., by pressure or chemical
substitution. They still offer challenges to theory and experiment
(see Ref. [1] for a recent review). Quantum critical behavior is
signified by singularities in thermodynamic and transport
properties. Usually, specific power laws with characteristic exponents have
been predicted at the quantum critical point (QCP) for “clean” homogeneous systems,
while “disordered” inhomogeneous systems, driven, e.g., by chemical substitution,
may show different behavior [2].
In the case of metallic (itinerant) Heisenberg magnets, a
strong-disorder renormalization group [3] predicts an
exotic infinite-randomness QCP accompanied by quantum Griffiths singularities
[4]. At such a QCP, thermodynamic observables are expected
to be singular not just at criticality but in a finite region around the QCP called the
quantum Griffiths phase (GP). This region features power laws
(e.g., in the magnetic susceptibility, , and the magnetization, )
characterized by a nonuniversal Griffiths exponent which varies with distance to the QCP.
Quantum Griffiths singularities have attracted a lot of attention. Many heavy fermion compounds
display anomalous power-laws in specific heat and [5];
and quantum Griffiths behavior was suggested as an explanation [6].
Recently, a more systematic variation of the exponents could be
found at the ferromagnetic QPT of CePd1-xRhx [7].
To avoid additional complications due to the Kondo effect and to study a larger energy scale we recently investigated the simple fcc transition metal alloy Ni1-xVx [8] as an example of an itinerant ferromagnet (FM) in which the transition temperature ( for pure Ni) can be tuned to zero by chemical substitution. As explained by Friedel [9] the “disorder” is introduced because the charge contrast of the replacing vanadium atoms creates large defects yielding an inhomogeneous magnetization density. In contrast, diluting Ni with isoelectronic Pd does not lead to a strongly disordered scenario: Ni1-xPdx remains ferromagnetic up to where it rather shows the signatures of a clean quantum critical point [10]. We showed in Ref. [11] that magnetization and susceptibility above the critical vanadium concentration where is suppressed to 0 indeed follow simple power laws with nonuniversal exponents that confirm the quantum Griffiths scenario over a wide temperature and magnetic field regime. At very low temperatures, deviations from the quantum Griffiths scenario hint at a cluster glass phase. Here, we provide additional details not shown in Ref. [11]. We demonstrate that -scaling holds for a wide concentration regime and show the scaling plots. In addition, we reveal how the impact of disorder is manifest in the original data close to , and we show the details of the determination of the phase boundaries in order to better distinguish bulk behavior from individual cluster physics in this inhomogeneous system.
2 Results
Magnetization and ac-susceptibility measurements were performed on polycrystalline Ni1-xVx samples with as described in Ref. [11].
An orbital contribution of has been subtracted from all data shown
().
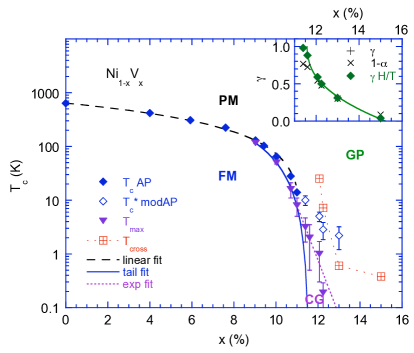
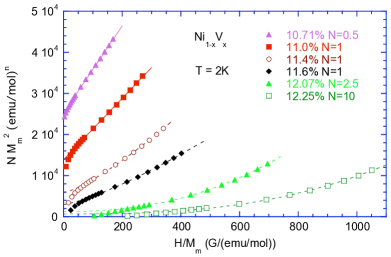
Figure 1 shows the temperature-concentration phase diagram. For , the critical temperature was determined by the standard Arrott analysis. Plots of vs. as in Fig. 2 show straight parallel isotherms which implies as is common for itinerant magnets (in Fig. 2, only low data are shown). is then extracted via the mean-field -dependencies of and susceptibility [12]. The resulting can be simply extrapolated linearly (dashed line) from the high of nickel down to 0 at [8].
For , the straightforward AP analysis does not longer work because the data in Fig. 2 are not described by straight lines. Introducing “exponents” as in a classical critical regime leads to a “modified” Arrott plot [13] implying the behavior . A good description for of the data in a wide regime (outside any critical regime) can be achieved with and [12], as indicated by the dotted fit line in Fig. 2. The resulting transition temperatures of these modified Arrott plots remain finite up to , while other extrapolations in Fig. 2 using smaller values would lead to smaller .
In addition to Arrott
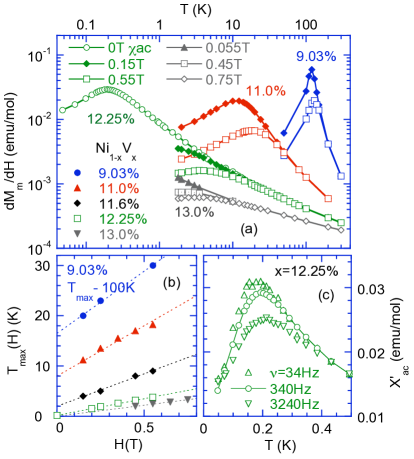
plots, we analyze field-dependent maxima at in the differential
susceptibility
indicating spin ordering or freezing as shown in Fig. 3(a). Fig. 3(b) shows the linear
extrapolation of taken at 0.55T to 0.1T to determine .
In particular for a frequency dependent maximum at was determined by in zero field with which hints at the onset of a cluster glass [11]. increases by 0.018K per decade in frequency [11] as shown in Fig.3(c).
Although a detailed study of the evolution with dilution of the cluster growth and dynamics is still outstanding,
we can already note the qualitative effects of disorder on the ferromagnetic ordered state for .
As is obvious in Fig. 1, the high and low field extrapolation lead to different transition temperatures () hinting at cluster
freezing for .
The -dependence of in the accessible temperature region is better
described by an exponential (dotted line) rather than a power law. Also,
a “tail” fit to (, see [14]) rather than a power law serves as a good description of the onset of FM order for data
between about and leading to (solid line). The discrepancies between the various methods
and the spin-glass like features at the lowest temperatures suggest that the real QCP is masked at very
low by ordering of clusters.
Nonetheless, at sufficiently high temperatures (in the region ) cluster ordering does not seem to play a role, and various quantities display power laws. Figs. 4(a) and (b) present the and dependencies of the magnetization as for various . Fig. 4(b) shows essentially the susceptibility , since for low fields () and high (, ). While for the negative slope in the log-log plot increases with falling towards , for , follows a simple power law for . The exponent decreases from to . follows a power law for high . For , where nearly saturates, the exponent is close to 1, and therefore very different than . However, for , the high-field exponent matches the susceptibility exponent . The deviations from a power law at low fields in Fig. 4(a) are due to the finite limitations.
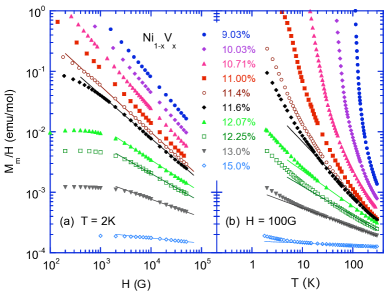
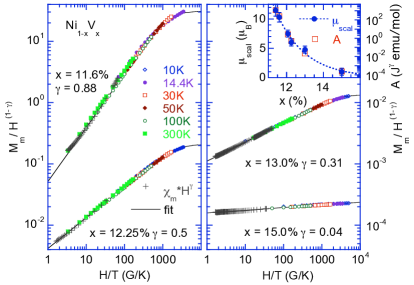
Since both the and show power laws with the same exponent, simple scaling is expected for . Fig. 5 shows the scaling plot using the form where is the scaling function and is a scaling moment for several . All data for collapse, confirming scaling. The scaling function is well approximated by the form where is a constant. This phenomenological form arises from simply combining the two limiting power laws with the same exponent in the plane, . Close to , the quality of the collapse is less satisfactory. The resulting exponent (which matches that obtained by a fit of for all between 11.4% and 15%) is shown in the inset of Fig. 1. The scaling moment and amplitude are shown in the inset of Fig. 5, demonstrating the growth of the typical cluster size and number with .
The consistent power laws, and in particular, the scaling of are in excellent agreement with the predictions
for a quantum Griffiths phase with Griffiths
exponent . A critical concentration of can be identified from the condition
(neglecting logarithmic terms).
Fitting to power law as predicted by theory [3]
yields with as shown in the upper
inset in Fig. 1. This value is in close agreement with the “tail” fit of .
3 Conclusions
On the one hand, our results confirm that Ni1-xVx follows the scenario of an infinite-randomness QCP
with a quantum Griffiths phase, as expected in an itinerant Heisenberg magnet [3, 4].
The QCP at has been estimated by extrapolations from outside
the critical region, where the cluster ordering is less disturbing (through and ).
On the other hand, we see clear signs of cluster ordering towards , in particular deviations from scaling
at lower temperatures (such as the upturns in Fig. 4(a) as well as model dependent transition temperatures for .
As discussed in Ref. [11], the magnetization for can be well described by an additional “Curie term” due
to frozen clusters which exceeds the term due to the fluctuating (Griffiths) clusters below (see Fig. 1). Such a change in low-temperature
behavior was predicted to occur in itinerant Heisenberg systems due to the RKKY interactions [15].
A Griffiths phase with nonuniversal power laws at higher (but below ) combined with a cluster glass (CG) (indicated by maxima in ) at very low has also been
observed in other diluted compounds (CePd1-xRhx [7], URu2-xRexSi2[16])
close to a ferromagnetic transition with much lower
and can be understood as a generic feature of this disordered itinerant QPT [14].
This work has been supported in part by the NSF under grant nos. DMR-0306766, DMR-0339147, and DMR-0906566 and by Research Corporation.
References
References
- [1] v Löhneysen H, Rosch A, Vojta M and Wölfle P 2007 Reviews of Modern Physics 79 1015
- [2] Vojta T 2006 J. Phys. A.: Math Gen. 39 R143
- [3] Hoyos J A, Kotabage C and Vojta T 2007 Phys. Rev. Lett. 99 230601; Vojta T, Kotabage C and Hoyos J A 2009 Phys. Rev. B 79 024401
- [4] Vojta T and Schmalian J 2005 Phys. Rev. B 72 045438
- [5] Stewart G R 2001 Rev. Mod. Phys. 73 797; Stewart G R 2006 Rev. Mod. Phys. 78 743
- [6] Castro Neto A H and Jones B A 2000 Phys. Rev. B 62 14975
- [7] Westerkamp T, Deppe M, Küchler R, Brando M, Geibel C, Gegenwart P, Pikul A P and Steglich F 2009 Phys. Rev. Lett. 102 206404
- [8] Bölling F 1968 Phys. Kondens. Mater. 7 162
- [9] Friedel J 1958 Nuovo Cimento 7 287
- [10] Nicklas M, Brando M, Knebel G, Mayr F, Trinkl F and Loidl A 1999 Phys. Rev. Lett. 82 4268
- [11] Ubaid-Kassis S, Vojta T and Schroeder A 2010 Phys. Rev. Lett. 104 066402
- [12] Ubaid-Kassis S and Schroeder A 2008 Physica B 403 1325
- [13] Arrott A and Noakes J E 1967 Phys. Rev. Lett. 19 786
- [14] Vojta T 2010 J. Low Temp. Phys. 161 299
- [15] Dobrosavljević V and Miranda E 2005 Phys. Rev. Lett. 94 187203
- [16] Bauer E D, Zapf V S, Ho P C, Butch N P, Freeman E J, Sirvent C and Maple M B 2005 Phys. Rev. Lett. 94 046401