Quasiparticle and Optical Properties of Rutile and Anatase TiO2
Abstract
Quasiparticle excitation energies and optical properties of TiO2 in the rutile and anatase structures are calculated using many-body perturbation theory methods. Calculations are performed for a frozen crystal lattice; electron-phonon coupling is not explicitly considered. In the GW method, several approximations are compared and it is found that inclusion of the full frequency dependence as well as explicit treatment of the Ti semicore states are essential for accurate calculation of the quasiparticle energy band gap. The calculated quasiparticle energies are in good agreement with available photoemission and inverse photoemission experiments. The results of the GW calculations, together with the calculated static screened Coulomb interaction, are utilized in the Bethe-Salpeter equation to calculate the dielectric function for both the rutile and anatase structures. The results are in good agreement with experimental observations, particularly the onset of the main absorption features around 4 eV. For comparison to low temperature optical absorption measurements that resolve individual excitonic transitions in rutile, the low-lying discrete excitonic energy levels are calculated with electronic screening only. The lowest energy exciton found in the energy gap of rutile has a binding energy of 0.13 eV. In agreement with experiment, it is not dipole allowed, but the calculated exciton energy exceeds that measured in absorption experiments by about 0.22 eV and the scale of the exciton binding energy is also too large. The quasiparticle energy alignment of rutile is calculated for non-polar (110) surfaces. In the GW approximation, the valence band maximum is 7.8 eV below the vacuum level, showing a small shift from density functional theory results.
pacs:
71.20.Nr 71.15.Qe 71.35.CcI introduction
Even after half a century of researchGrant (1959); Diebold (2003), investigation of the fundamental properties of titanium dioxide (TiO2) crystal phases remains important and fruitful, in part due to the role they have in concepts to effectively utilize solar energy. For example, TiO2 structures form the photoactive component in heterogeneous photo-catalysts which, by absorbing energy from the sunlight, degrade environmentally hazard materials Fox and Dulay (1993); Hoffmann et al. (1995) and split water into H2 and O2 Fujishima and Honda (1972). Scintered anatase TiO2 nanoparticles provide the backbone for electron transport and the substrate for organic chromophores in the Grätzel photovoltaic solar cells Oregan and Gratzel (1991). In addition to that, TiO2 has been widely used in various areas from optical coatings to pigments Diebold (2003). Fundamental to all of these applications are the relative alignments of essential energy levels near the valence and conduction band edges of TiO2 crystal phases and the corresponding optical transition energies. If predictive computational methods are going to have impact on the understanding and design of heterogeneous photocatalytic systems based on TiO2, we must first establish that these methods can predict the basic properties of the crystal phases, providing a coherent framework for all the experimental facts.
Rutile and anatase are two common crystal structures in which TiO2 is found. In both phases, each Ti atom in the crystal is surrounded by a slightly distorted octahedron formed by six oxygen atoms. The distinct phases exhibit a different connection between the distorted octahedra (TiO6). In the rutile phase each octahedron shares two edges with its neighbors, while in the anatase phase each octahedron shares four Pauling (1929). In the rutile form, the crystal has a simple-tetragonal structure Abrahams and Bernstein (1971) with a = b = 0.45936 nm and c = 0.29587 nm. The symmetry of the lattice is described by the space group with the only internal parameter = 0.30479. In the anatase form the crystal structure is body-centered tetragonal Horn et al. (1972); Fahmi et al. (1993) and belongs to space group . The three sides of the conventional cell are a = b = 0.3784 nm and c = 0.9515 nm respectively. The internal parameter is 0.208 Horn et al. (1972); Fahmi et al. (1993). The measurements quoted were done at room temperature; the change in lattice parameters upon reducing the temperature to 15 K is less than 0.001 nm Burdett et al. (1987).
Most of the early first-principles calculations of the properties of TiO2 were based on the local density approximation (LDA) in a Density Functional Theory (DFT) based approach Hohenberg and Kohn (1964); Kohn and Sham (1965). The crystal structures and ground-state properties were accurately reproduced Glassford and Chelikowsky (1992a); Mo and Ching (1995); Mikami et al. (2000); Asahi et al. (2000). However, as has been more generally observed for semiconductors and insulators, the energy gaps pertaining to optical properties were found to be too small. The minimum energy gap in the LDA band structure underestimated the band gap observed in optical experiments Pascual et al. (1977); Tang et al. (1993) by about 40% Mikami et al. (2000). Calculations based on Hartree-Fock theory have been performed, giving accurate structural properties for rutile and anatase, but with a minimum energy gap that exceeded 10 eV Fahmi et al. (1993). A hybrid approach, admixing a fraction of the bare exchange from Hartree-Fock, also showed accurate structural properties for rutile Zhang et al. (2005), with a band gap that is closer to experiment (3.4 eV) Muscat et al. (2001). A more economical approach, approximately accounting for explicit Coulomb interactions through a U parameter acting on the Ti 3d electrons in a DFT+U approach, overestimated the lattice parameters while still showing a band gap that was smaller than experiment Nolan et al. (2008).
A direct approach to calculate electronic excitation energies based on the Green’s function approach of many-body perturbation theory (MBPT), specifically utilizing the GW approximation for the electron self energy Hedin (1965), has proven to be relatively accurate for a broad array of materials Hybertsen and Louie (1986); Aryasetiawan and Gunnarsson (1998); Aulbur et al. (1999); Onida et al. (2002). Several calculations have been reported for TiO2 with different implementations of the GW method Oshikiri et al. (2003); van Schilfgaarde et al. (2006); Thulin and Guerra (2008); Mowbray et al. (2009). However, the band gap was significantly overestimated in all these reports.
The frequency dependent macroscopic dielectric function probed in optical measurements has been extensively studied within the framework of DFT for TiO2 crystal phases Glassford and Chelikowsky (1992b, a); Mo and Ching (1995); Asahi et al. (2000). Using the independent particle approach of Ehrenreich and Cohen Ehrenreich and Cohen (1959), the underestimate of the fundamental band gap immediately gives an error in the optical threshold and the overall shape of the dielectric function calculated in this way was quite different from the experimental measurements Cardona and Harbeke (1965); Hosaka et al. (1997). In the framework of MBPT, the GW-based results for the electronic excitation energies are input to a direct treatment of neutral excitations through solution of the two-particle Bethe-Salpeter equation (BSE), an approach that has provided a satisfactory description of the optical properties of a number of systems Rohlfing and Louie (2000); Onida et al. (2002). An application of the BSE approach for rutile and anatase TiO2 has only recently appeared in the literature Lawler et al. (2008). The shape of the spectra are in much better agreement with experiment as compared to the independent particle approach.
In this article, we critically assess the application of MBPT methods to calculate the electronic and optical excitations for TiO2 in the rutile and anatase crystal phases. To treat the electronic excitation energies, we use the GW method without self consistency or inclusion of vertex corrections. Empirically, this approach is often relatively accurate, although a full understanding of cancellations between self consistency and vertex corrections remains an open area of research Shirley (1996); Holm and von Barth (1998); Ku and Eguiluz (2002); Bruneval et al. (2006a); Kotani et al. (2007); Shishkin et al. (2007); Shishkin and Kresse (2007). Several different approximations to handle the frequency dependence of the screened Coulomb interaction in the GW method are compared. We find that use of plasmon pole models Hybertsen and Louie (1986); von der Linden and Horsch (1988) results in significant overestimation of the band gap. When the full frequency dependence of the screening is included, together with explicit treatment of the Ti semicore states, the calculated electronic excitation spectrum is found to be in good agreement with photoemission and inverse photoemission spectra Tezuka et al. (1994); See and Bartynski (1994). Interestingly, the calculated fundamental gap (3.34 eV and 3.56 eV for rutile and anatase respectively), is still larger than the measured minimum gap from optical absorption (3.03 eV for rutile Pascual et al. (1977) and estimated to be 3.3 eV for anatase Tang et al. (1993)). As a first step towards application to heterogeneous photocatalytic systems, we discuss the alignment of the valence and conduction band edges at non-polar vacuum-solid (110) interface of TiO2. We find that the GW method implies only very small corrections relative to the LDA for the valence band position, with the most of the band gap error going to shift the conduction band edge upwards.
To explore the role of electron-hole interactions and excitonic binding energy, we have used the results from the GW based calculations as input to the BSE approach. Similar to the recent results of Lawler Lawler et al. (2008), the calculated frequency dependent dielectric function accurately reproduces the main onset of absorption near 4 eV and gives a good account of the frequency dependence for both rutile and anatase. We also solve the BSE for the low-lying, bound exciton states for rutile. The deepest exciton binding energy is calculated to be about 0.13 eV. The dipole-forbidden character of the lowest exciton agrees with low temperature measurements Pascual et al. (1977), although the predicted exciton energy (3.25 eV) is still 0.22 eV larger than experiments. Also, the magnitude of the exciton binding energy is larger. While the discrepancy for the exciton energy could very reasonably be regarded as within the expected errors of the MBPT methods used here, it may suggest an important role for electron-phonon coupling in screening and in further renormalizing the energy gap in TiO2.
The rest of the article is organized as follows: In Sec. II, the methodologies used in the DFT, electronic excitation and optical excitation calculations are briefly summarized, the key approximations are discussed and the numerical details are provided. In Sec. III, we present the main results for the electronic and optical excitations in rutile and anatase TiO2 and discuss them in comparison to available experiments. Finally, we conclude the article in Sec. IV with a short discussion, including the role of coupling to phonons.
II Methodology and Numerical Details
II.1 DFT Calculations
The LDA eigenvalues and eigenvectors of TiO2 are calculated with a plane-wave basis set using norm-conserving pseudopotentials. Unless indicated otherwise, the LDA calculations are carried out using the ABINIT packageGonze et al. (2002, 2005). In TiO2 the Ti is nominally ionized to [Ti4+] and the low lying conduction band states are of predominantly character. As we show below, artificially dividing the n=3 shell of Ti into frozen core ( and ) and valence () contributions introduces a significant error to the energy band gap. The pseudopotential of Ti which includes semicore electrons is generated using the OPIUM package opi in the Troullier-Martins scheme Troullier and Martins (1991) with an initial configuration of . The outermost five orbitals are included and the cutoff radii (in Bohr) are 0.9, 0.9, 1.0, 0.9, and 0.9 respectively. Other pseudopotentials are taken from the ABINIT pseudopotential database generated using the FHI99PP package Fuchs and Scheffler (1999).
In all calculations, the Perdew-Wang representation Perdew and Wang (1992) of Ceperly-Alder exchange-correlation potential Ceperley and Alder (1980) is used. When including the Ti semicore states, a kinetic energy cutoff of 200 Ry is used to ensure the convergence of the LDA results, as suggested by previous calculationsMikami et al. (2000); Vast et al. (2002). To examine the accuracy of the pseudopotentials, we calculate the optimized lattice constants for rutile, finding 4.5484 Å(4.5936 Å), 0.6414 (0.64409) and 0.3040 (0.30479), agreeing with the experimental values noted in parentheses Abrahams and Bernstein (1971) to the accuracy generally expected for LDA calculations. We also compare our LDA calculations with results obtained using the VASP package Kresse and Furthmüller (1996, 1996) with the recommended projector augmented-wave (PAW) pseudopotentials Blöchl (1994). The difference between the two LDA calculations is within 0.5% for lattice parameters and less than 0.05 eV for bandgaps. In the GW and BSE calculations described below, the geometrical parameters of the unit cell for both rutile and anatase phases are taken from experimental measurementsAbrahams and Bernstein (1971); Cromer and Herrington (1955); Fahmi et al. (1993); Horn et al. (1972).
II.2 GW Method
In MBPT, the evolution of the electrons in a material is described by the one-particle Green’s function, with the effect of electron-electron interactions represented by an electron self energy operator. Well defined electronic excitations appear as peaks in the corresponding spectral function. Excitations with single particle character, namely quasiparticles, can be obtained as solutions of a Schrodinger-like equation Hedin and Lundqvist (1969)
| (1) |
where is the kinetic energy, is the external potential, and is the average Hartree potential. is the self energy of the electrons and the indices refer to Bloch states n, k. It includes all the exchange-correlation effects contributed by surrounding electrons. Since is generally non-Hermitian, is complex with the real part giving the quasiparticle energy and the imaginary part corresponding to the width of the quasiparticle peak in the spectral function, i.e. the quasiparticle lifetime.
A practical approximation to calculate has proven to be the so-called GW approximation of Hedin Hedin (1965), in which the self energy is formally written as
| (2) |
Here is the Green’s function of the electrons and is the dynamically screened Coulomb interaction determined by the inverse dielectric matrix , and is a positive infinitesimal time. The and in Eq. (2) refer to the fully interacting Green’s function. However, in practice, using an initial LDA calculation to determine the screening through linear response calculations (not including the exchange-correlation kernel) and to provide an initial, independent-particle Green’s function has often proven to be sufficiently accurate. There are specific examples where the LDA orbital character can be wrong, e.g. in some late transition metal compoundsAryasetiawan and Gunnarsson (1995); Faleev et al. (2004); Bruneval et al. (2006b). However, in TiO2, the Ti is almost empty and the valence band edge region is predominantly O character with minimal admixture of Ti . The TiO2 case should be similar to the vast majority of semiconductors and insulators in this regard. Also, the LDA wavefunctions are sufficiently accurate that a first order estimate of the self energy correction to the LDA eigenvalues is adequate. The quasiparticle energy correction to a LDA orbital is obtained through a reduced form of Eq. (1) as
| (3) |
where is the exchange-correlation potential and is the renormalization factor of the orbital defined as .
The frequency dependence of the screened Coulomb interaction () can often be addressed using a generalized plasmon-pole (GPP) model Hybertsen and Louie (1986); von der Linden and Horsch (1988), with substantial advantages in computational efficiency. The GPP models have proven to be relatively accurate for many semiconductors and insulators, including ionic crystals such as LiCl Hybertsen and Louie (1985) and MgO Shirley (1998). However, as discussed below, we find that use of the GPP leads to a gap that is substantially too large for TiO2. Several approaches to include the full frequency-dependent dielectric matrix have been implemented and described in the literature: (1) an analytical continuation method Rojas et al. (1995); Rieger et al. (1999), (2) a direct method which carries out the integration in Eq. (2) along the real axis Marini et al. (2002a, b); Shishkin and Kresse (2006), and (3) a contour deformation (CD) method which deforms the integration in Eq. (2) along the imaginary axis Lebègue et al. (2003). We adopt the contour deformation method to carry out the calculations, which is particularly efficient for evaluating self energy for states near the gap region.
In the CD method, the correlation contribution of the self energy is written as the sum of two terms Lebègue et al. (2003); Bruneval (2005)
where , is the Fermi energy, is a small damping amplitude and is a Heaviside function. The first term in Eq. (LABEL:eq:5) comes from the integration along the imaginary axis. As W is now smooth along the imaginary axis, a sparse sampling of is sufficient to converge the integration. The second term is the residual contribution of poles near the real axis. It is non-zero only while or . For any close to the Fermi surface, only for have non-vanished contributions to in the second term. This makes the calculation more computational efficient; is a smooth function of around 0, due to the band gap, and only relatively low frequencies need to be sampled.
We implement the contour deformation approach based on a private branch of the YAMBO package Marini et al. (2009). The integration along the imaginary axis in Eq. (LABEL:eq:5) is performed with a non-uniform mesh of points according to
| (5) |
which maps the integration along the imaginary axis to an integration on the [0, 1) interval. The energy provides a scale for the overall density of the samples on the imaginary axis. Half of the mesh spans the energy scale from zero up to while the other half sample the higher energies. For TiO2, a mesh of 50 points and an energy scale of 1 Ry were enough to keep the numerical error of the integration within 1 meV. on the real axis is uniformly sampled with an energy increment of 0.1 eV and values between mesh points are linearly interpolated. The special case in Eq. (LABEL:eq:5) for must be handled with care. A consistent treatment, that avoids the apparent divergence and properly handles all the terms in Eq. (LABEL:eq:5), is to add a small positive energy to (say Ry) when necessary. A very similar contour deformation approach has been implemented in ABINIT Bruneval (2005), and we have carefully compared the results for test cases. The ABINIT package has also been used for the GPP model calculations.
For all the GW calculations, the energy cutoff is 60 Ry for the evaluation of the bare Coulomb exchange contribution , and 20 Ry for the correlation part . A total of 160 bands are used for the calculation of both dielectric matrices and self-energies. An unshifted Monkhost-Pack (MP) meshMonkhorst and Pack (1976) is used to sample the Brillouin zone (BZ) of rutile, while for anatase an unshifted MP mesh is used.
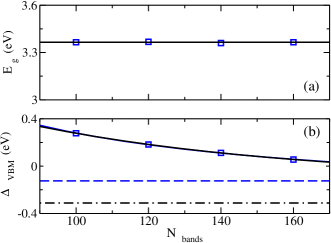
A test of the convergence with respect to the number of bands included is shown in Fig. 1 for the final full-frequency approach with Ti semicore electrons treated explicitly as valence electrons in the pseudopotential. In order to characterize the fully converged values, the data were fit with two different empirical forms, , and . We first check the validity of the fitting forms for the case of bulk silicon. The exponential form closely represents the band edge and band gap energies as a function of the number of included conduction bands, yielding extrapolated results in excellent agreement with those obtained via methods suggested by Bruneval and GonzeBruneval and Gonze (2008). For rutile, the fitting curves displayed in Fig. 1 are indistinguishable, but predict slightly different results for the absolute shift of the valence band edge, as indicated by the horizontal dashed lines in Fig. 1(b). In particular, the fit for the quasiparticle energy gap indicates a converged quasiparticle energy of 3.37 eV for N=160. For the absolute shift of the valence band edge, the convergence is somewhat slower, with extrapolated values of -0.12 eV and -0.31 eV. This suggests that the valence band edge in the final results is 0.2 to 0.4 eV lower than the N=160 value.
II.3 Bethe-Salpeter Equation and Optical Properties
A detailed description of the BSE method is given in the literatureOnida et al. (2002); Rohlfing and Louie (2000). We use the implementation in the public branch of the YAMBO package Marini et al. (2009). With the Tamm-Dancoff approximation Fetter and Walecka (1971) and the use of a static screened Coulomb interaction, the BSE is simplified to a generalized eigenvalue equation . The effective Hamiltonian has an explicit form of
| (6) |
where the quasiparticle energies (taken from the GW calculations) enter on the diagonal, , and the indices refer to the occupied valence and empty conduction band states. For brevity, the explicit reference to Bloch wavevector for each state is suppressed. The effective Hamiltonian in Eq. (6) is explicitly written for the spin singlet excitations which are directly probed in optical measurements. For the spin triplet excitations, the effective Hamiltonian is modified by dropping the so-called exchange term . In terms of and , the macroscopic dielectric function , including local field effects Rohlfing and Louie (2000); Onida et al. (2002), is expressed as
| (7) |
In YAMBO, we use the option to evaluate the response function recursively Benedict and Shirley (1999); Marini et al. (2009). In order to study specific, low energy exciton states, we also directly diagonalize the generalized eigenvalue equation.
Calculations of optical properties via BSE are more expensive computationally. For both phases, the static dielectric matrices are calculated with 80 bands and a damping coefficient of 0.1 eV. The dielectric function is calculated on an MP mesh for rutile and on an MP mesh for anatase. For both cases, electron-hole pairs within 15 eV are taken in to build up the BSE kernel, in which the energy cutoff is 10 Ry for and 3.5 Ry for . To calculate the excitonic binding energy of rutile, we restrict the basis set for the effective Hamiltonian to one conduction band and one valence band. The exciton binding energy converges relatively slowly with BZ sampling. The final results are reported based on a MP mesh to sample the BZ. The energy cutoff is larger in this calculation for a more accurate representation of the BSE kernel, 14 Ry for and 6 Ry for .
| Method | SC | VBM | CBM | E | |||||||||||||||||||||||||||||||||||||||||
|---|---|---|---|---|---|---|---|---|---|---|---|---|---|---|---|---|---|---|---|---|---|---|---|---|---|---|---|---|---|---|---|---|---|---|---|---|---|---|---|---|---|---|---|---|---|
| in PP | Vxc | Z | Vxc | Z | LDA | GW | |||||||||||||||||||||||||||||||||||||||
| GPP(HL) | n | -19.97 | -24.59 | 3.94 | 0.82 | -11.48 | -3.57 | -5.69 | 0.84 | 2.08 | 4.48 | ||||||||||||||||||||||||||||||||||
| GPP(VDLH) | n | -19.97 | -24.59 | 4.37 | 0.82 | -11.48 | -3.57 | -6.35 | 0.85 | 2.08 | 3.60 | ||||||||||||||||||||||||||||||||||
| FF(CD) | n | -19.97 | -24.59 | 4.50 | 0.71 | -11.47 | -3.57 | -5.78 | 0.73 | 2.08 | 3.73 | ||||||||||||||||||||||||||||||||||
| GPP(HL) | y | -20.21 | -24.67 | 4.09 | 0.83 | -20.37 | -12.13 | -5.64 | 0.85 | 1.75 | 4.27 | ||||||||||||||||||||||||||||||||||
| GPP(VDLH) | y | -20.21 | -24.67 | 4.41 | 0.83 | -20.37 | -12.13 | -5.99 | 0.85 | 1.75 | 3.70 | ||||||||||||||||||||||||||||||||||
| FF(CD) | y | -20.21 | -24.67 | 4.56 | 0.70 | -20.37 | -12.12 | -5.88 | 0.72 | 1.75 | 3.38 | ||||||||||||||||||||||||||||||||||
III Results
III.1 Electronic Excitation Energies in TiO2
The calculated electronic excitation energies in titanium oxides are found to be sensitive to technical factors in the GW calculations. We illustrate that here for the case of TiO2 in the rutile phase (Table 1). First, explicit, self consistent treatment of the semicore electrons ( and ) on the Ti in the calculations for the solid affects the calculated energy gaps. As discussed in the literature, although the and levels are well separated from the states energetically, there is significant spatial overlap Marini et al. (2002b). The effect for TiO2 is already evident at the LDA level, where the gap is reduced by more than 0.3 eV upon explicit inclusion of the semicore electrons relative to freezing the semicore electrons in the pseudopotential.
Depending on the approximation used to treat the electron self energy in the GW method, the net influence of the semicore electrons varies. Focusing on the influence of the semicore electrons for the most accurate, full-frequency method (FF), the change is greater than 0.3 eV. A more detailed view of the contributions of the LDA exchange-correlation potential , the exchange and the correlation part of the self energy are also displayed Table 1. The valence band maximum (VBM) orbitals are largely composed of oxygen -states. They are spatially separated from the Ti semicore electrons, so the changes are relatively small. Explicit treatment of the semicore electrons as valence electrons only reduces by 0.24 eV. The reduction in is partially compensated by the decrease of (0.08 eV) and (0.04 – 0.15 eV). Consequently the overall change of is less than 0.1 eV. On the other hand, the conduction band minimum (CBM) orbital is almost purely of Ti character with substantial overlap to the semicore electrons. The expectation value of () changes by about 9 eV. Of course, there is a corresponding, large change in the pseudopotential between these two cases. The bare exchange term in the electron self energy operator changes by a similar amount. Their combined contribution to is only about -0.34 eV. The changes in the correlation part of the self energy of the CBM orbital is sensitive to the GW method. For the full-frequency method, is decreased by only 0.1 eV when semicore electrons are included in the PP, so we find that most of the net effect on the band gap comes from the difference between LDA and bare exchange interactions with the semicore electrons.
In Table 1 the results of using different methods to address the frequency dependence of W are shown. These affect the correlation part of the electron self energy and the renormalization factor . The results obtained with the full-frequency dependent dielectric function, evaluated using the contour deformation method are the reference results, designated FF(CD) in the table. For comparison, results from two different generalized plasmon pole models are shown. In the Hybertsen-Louie approachHybertsen and Louie (1986), designated GPP(HL), sum rules are applied to each individual dielectric matrix element to develop a plasmon-pole model for its frequency dependence. As shown in the lower part of Table 1, when the semicore electrons of Ti were explicitly included in the pseudopotential, the calculated energy gap is almost 1 eV too large. In the approach of von der Linden and Horschvon der Linden and Horsch (1988), designated GPP(VDLH), each dielectric matrix is first transformed to the basis of eigenpotentials and then sum rules are applied to develop a plasmon pole model for each eigenpotential. This model also overestimates the energy gap, but by a smaller amount. The renormalization factor , in addition to entering the evaluation of the quasiparticle energies in Eq. (3), indicates the degree of dynamical admixture of collective excitations into the quasiparticle. Larger deviations from unity indicate more admixture. Compared with the FF results, the value of indicates that the degree of admixture is substantially underestimated by both GPP models.
We have also tested the GPP(HL) approximation for anatase TiO2 as well as two other titanates, SrTiO3 and BaTiO3. In all three cases, the GPP(HL) approximation leads to minimum band gaps that are too large by 0.7-0.8 eV. A similar deviation for the renormalization constant, , is also observed. These results suggest that the quantitative issues with the plasmon pole model extend more generally to titanates. In previous calculations of the loss function Vast et al. (2002) and the finite wavevector dynamical scattering factor Gurtubay et al. (2004) for rutile TiO2, substantial structure is seen in the frequency dependence, well beyond what could be easily accounted for by a single pole model. These effects trace to an interplay between strong local field effects and the Ti semicore p- to empty d-shell excitation. However, further analysis of the frequency dependence of the screening in Si and LiCl shows that deviations from a pole model for a range of frequencies around the plasmon energy is not sufficient to predict the performance of the GPP model as it is used to evaluate the GW expression. The dynamical screening at larger frequencies only enters in an integrated fashion, resulting in substantial cancellations internally. In the case of titanates, we find that the full frequency dependence is essential for quantitative results. Similar conclusions were drawn for the case of metallic Cu Marini et al. (2002b).
| Rutile | Anatase | ||||||||||||||||||
|---|---|---|---|---|---|---|---|---|---|---|---|---|---|---|---|---|---|---|---|
| K-points | |||||||||||||||||||
| 0.00 | -1.06 | -1.04 | -0.48 | -0.05 | |||||||||||||||
| 0.00 | -1.15 | -1.12 | -0.58 | -0.06 | |||||||||||||||
| 1.75 | 1.80 | 1.78 | 1.96 | 3.22 | |||||||||||||||
| 3.38 | 3.40 | 3.34 | 3.56 | 4.89 | |||||||||||||||
| 3.38 | 4.55 | 4.45 | 4.14 | 4.95 | |||||||||||||||
| 3.34 () | 3.56 () | ||||||||||||||||||
The quasiparticle energy levels of rutile and anatase from the highest valence band and the lowest conduction band at selected high symmetry k-points are displayed in Table 2. While the energy gap of rutile is found to be a direct gap (at ) in the LDA, our FF GW calculations indicate it as indirect (). However, the energy difference between the direct and indirect gap is small. The energy of CBM at is only 0.04 eV higher than the energy at .
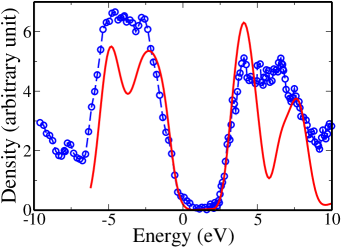
The calculated quasiparticle energies can be directly compared to spectroscopic measurements for electron removal or addition to the solid. The calculated value of the quasiparticle energy gap, 3.34 eV, agrees well with electron spectroscopy measurements, photo-emission and inverse photo-emission measurements Tezuka et al. (1994); See and Bartynski (1994). In Fig. 2, the density of states (DOS) of rutile derived from FF GW calculations is plotted together with the experimental spectra measured using x-ray photoemission and bremsstrahlung isochromat spectroscopyTezuka et al. (1994), which yielded a band gap of 3.3 0.5 eV. Overall, the shape of the calculated DOS matches the shape of the experimental spectra, especially around the band gap. The experimental spectra measured using ultraviolet photoemission and inverse photoemission spectroscopy See and Bartynski (1994) show very similar results with the inferred minimum energy gap about 0.2 eV smaller.
The LDA calculations show that the top of the valence band of anatase lies in the direction, somewhere about 0.88 times of the distance from to . The energy at this k-point is 0.05 eV higher than the energy of the VBM at . Subtracting the energy difference as a perturbation from the quasiparticle energy gap between and , which is 3.62 eV from Table 2, the quasiparticle energy gap of anatase is found to be 3.56 eV. The photoemission data available for anatase show an overall occupied band with the oxygen p-bands Sanjinés et al. (1994). That is similar to rutile. To our knowledge, there is no inverse photoemission data available for anatase, so the calculations can not be compared to a direct measurement of the quasiparticle energy gap.
III.2 Optical Excitation Energies in TiO2
More precise measurements of the minimum energy gap rely on optical absorption. This introduces the extra complication that the observed threshold for absorption will be altered by interactions between the photoexcited electron and hole, the formation of bound exciton states. For rutile, the BSE calculation shows a series of singlet bound excitonic states at . The lowest two show -state symmetry in the electron-hole envelope. They have a binding energy of 0.13 eV and 0.06 eV respectively. They are not dipole-allowed. The third and forth are degenerate, with electron-hole envelope showing symmetry, and have a binding energy of 26 meV. They are weakly dipole allowed for the electric vector perpendicular to the c-axis. Together with the calculated direct quasiparticle gap energy from above, we obtain the lowest energy singlet exciton at with energy 3.25 eV and the first dipole allowed singlet exciton with energy of 3.35 eV. High resolution, low temperature optical absorption measurements for rutile resolve several separate features Pascual et al. (1977). A very weak, but sharp exciton feature at 3.031 eV is identified as the 1s exciton which is electric quadrapole allowed. A stronger, but still relatively weak, dipole allowed 2p exciton feature starts at 3.034 eV. Finally, phonon-assisted features are also identified that correspond to an indirect gap of 3.049 eV.
There are several important points of comparison. First, the calculated lowest exciton energy at is about 0.22 eV higher than measured. Broadly, this error is comparable to those encountered when using the GW approximation for other semiconductors Aryasetiawan and Gunnarsson (1998); Aulbur et al. (1999); Onida et al. (2002). However, it is important to be clear that the calculation is performed for a frozen lattice with no account given for electron-phonon interactions. In general, the electron-phonon interaction will reduce the zero-temperature quasiparticle gap Cardona and Thewalt (2005). Second, the present GW calculation gives the conduction band minimum at the R point instead of being at , as suggested by the optical measurements. The energy differences are small; the calculated conduction band at R is 0.04 eV lower than at . In the analysis of the absorption data, the indirect gap is found to be 0.01 eV higher than the direct gap Pascual et al. (1977), albeit including what ever role excitonic effects may have. The difference between theory and experiment is too subtle to be resolved in these calculations, particularly without the influence of electron-phonon interactions. Third, the symmetry of the excitonic states from the calculation agrees with the interpretation of the experiments. However, the scale of the excitonic effects that we calculate using the static dielectric matrix, and only including the electronic polarizability, is substantially larger than suggested by the experiment. Our calculated long-wavelength dielectric constant ( 8) is slightly higher than the measured ( 7) Cardona and Harbeke (1965), but similar to previous calculations Vast et al. (2002). The lattice contribution is quite large, with = 111 Pascual et al. (1977). This again points to the importance of the electron-phonon interaction.
The measured optical absorption in single crystal anatase at low temperature does not resolve any significant structure Tang et al. (1995). The energy dependence near the onset of absorption is consistent with an Urbach tail. Analysis of the temperature dependence leads to an estimate for the band gap for extended states of 3.42 eV Tang et al. (1995). This exceeds the measured optical threshold in rutile by about 0.4 eV. Since the measured absorption edge in anatase is featureless, another way to characterize the absorption edge and make comparison to rutile is to consider the energy at which the low temperature absorption is 50 for electric vector perpendicular to the c-axis. In rutile, this occurs at 3.04 eV while it occurs at 3.30 eV in anatase Tang et al. (1995). This suggests a more modest 0.26 eV difference between the minimum energy gap of anatase and rutile. Our calculated quasiparticle minimum energy gap in anatase is 3.56 eV, modestly larger than the value deduced from the absorption measurements. The calculated difference in gaps between anatase and rutile is 0.22 eV, similar to the measured difference.
So far, the calculated quasiparticle energies for TiO2 have been found to agree well with electron spectroscopy, but the minimum energy gaps, including excitonic effects, are larger compared to the measured absorption threshold. Furthermore, the strength of the calculated exciton binding energy is larger than implied by the interpretation of the optical spectrum near threshold. To get additional perspective, we calculate the macroscopic dielectric function over a broad energy range, including the correlations induced by electron-hole interactions.
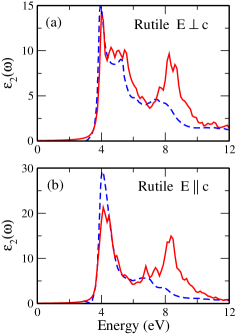
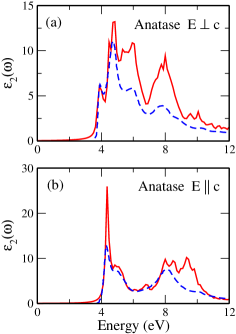
In Fig. 3, we show the imaginary part of the dielectric function of rutile for polarizations both perpendicular and parallel to the tetragonal axis c. The solid curves are calculated from the BSE, while the dashed curves are derived from optical reflectivity measurements at room temperature Cardona and Harbeke (1965). For both polarizations, the theoretical spectra are close to experiment up to about 6 eV. In particular, the first strong peak at 4 eV for both polarizations is reproduced very well by the BSE results. Above 6 eV, the overall magnitude and prominence of the peaks in theoretical spectra are distinct from experiment. The of anatase is displayed in Fig. 4, where the experimental data Hosaka et al. (1997) were measured at 100 K. Similar to the rutile case, the theoretical calculations capture the features around the onset of major absorption at 4 eV. For perpendicular polarization, the calculated oscillator strength is systematically too large starting at about 5 eV. The calculated results are very similar to the previous calculation for rutile TiO2 Lawler et al. (2008). For anatase, the calculated peak heights near 4 eV appear less intense in their spectra, but this is largely due to their choice of a larger damping parameter, as is evident from the broadening on the low energy side of their spectra. In particular, we have analyzed the integrated oscillator strength (i.e. the contribution to the f-sum rule) from the first peak in the anatase spectrum for parallel polarization. We find that our oscillator strength is essentially the same as theirs, but that both calculations show more oscillator strength than is found in the experimental spectra by about 30%.
The systematic overestimation of oscillator strength at higher energy appears to be a more general issue. For example, a recent BSE study for several alkaline earth metal monoxides shows some similar excess oscillator strength at higher photon energies Schleife et al. (2009). This may well trace to more fundamental assumptions in the methodology. Two key issues are the use of the Tamm-Dancoff approximation, which has been identified recently as the main source of errors in the calculations of a confined system Grüning et al. (2009), and the assumption of a statically screened Coulomb interaction Rohlfing and Louie (2000); Marini and Del Sole (2003). Also, as noted by Lawler and coworkers, the f-sum rule for the oscillator strength converges very slowly in the titanates and the experimental analysis that relies on Kramers-Kronig transformations may have systematic errors as well Lawler et al. (2008).
III.3 External Energy Level Alignment: TiO2(110) Surface
The energetic position of the quasiparticle VBM with respect to the vacuum level in the rutile phase for the (110) surface was calculated in several steps. First at the LDA level, analogous to the determination of work function for metals, the electrostatic potential change between the bulk like region and the vacuum region was determined Zhang et al. (1988); Baldereschi et al. (1988); Fall et al. (1999); Shaltaf et al. (2008). Then in a second step, the bulk VBM position relative to the electrostatic potential is determined. Previous calculations of work functions based on metal slabs based on the DFT Fermi energy were in fairly good agreements with experimental measurements Fall et al. (1998, 2000). In the third step, we will apply the perturbative correction to the LDA exchange-correlation potential to determine the alignment in the GW approximation Zhang et al. (1988); Shaltaf et al. (2008).
For semiconductors and insulators the Fermi level is separated from the VBM, and the position of VBM varies as the surface structure changes. To calculate the energetic alignment of rutile with respect to the vacuum from the (110) surface, a stoichiometric slab of six layers of Ti atoms is cut from the bulk structure with geometrical parameters described in Sec. I. A vacuum space of the same thickness of the slab is used to buffer the two surfaces of the slab. The surface is cleaved as a (11), unreconstructed surface as observed in experiments Diebold (2003). The k-point mesh is . After the slab is fully relaxed with the atomic positions of the central two layers fixed, the electrostatic potential inside the slab with respect to the vacuum is measured as -12.65 eV. The energy difference between the VBM (from the LDA calculation) and the electrostatic potential inside the material is 5.05 eV, which is determined in a separate bulk calculation to prevent the quantum size effects Fall et al. (1998). Accordingly, the LDA value for the VBM relative to vacuum is 7.60 eV. Previous LDA and gradient corrected calculations for give 7.16 eV (LDA, three Ti layer slab) Vogtenhuber et al. (2002), 7.2 eV (PBE, 11 Ti layer slab) Kiejna et al. (2006) and 7.6 eV (PW91, 11 Ti layer slab) Kiejna et al. (2006). In light of variations at the 0.2 eV level with number of layers in the slab model Kiejna et al. (2006), the overall agreement is satisfactory.
The GW correction for the VBM calculated with FF model and 160 bands is 0.07 eV. However, as noted in Sect. IIC, extrapolation to full convergence with respect to the total number of bands will drive this 0.2 to 0.4 eV lower. We therefore suggest a GW correction of -0.2 eV, with about 0.1 eV uncertainty. The final prediction from GW for the VBM alignment to vacuum at the clean rutile TiO2 (110) surface is 7.8 eV.
In order to deduce the VBM alignment form experiment, two results must be combined: (1) the work function which fixes the Fermi energy relative to the vacuum; (2) the position of the VBM relative to the Fermi energy. Experimental measurements of the work function of rutile from the (110) surface Onda et al. (2004); Schierbaum et al. (1996) vary from 4.7 eV to 5.8 eV depending on the structure of the surface which is strongly influenced by treatment (annealing, exposure to oxygen, etc.). In addition, the position of the VBM relative to the Fermi energy also depends on surface treatment Wendt et al. (2008). Therefore, it is crucial to compare with data in which both values are measured on the same sample. To our knowledge, this is relatively rare. Based on UPS measurements with (=21.2 eV), a work function of 5.2 eV and a relative VBM position of 3 eV were measured for TiO2(110) Schierbaum et al. (1996), which implies the VBM position relative to vacuum falls at 8.2 eV. Similar measurements for TiO2(100) yield a work function of 4.9 eV and a relative VBM position of 3.1 eV respectively Xiong et al. (2007), yielding the VBM position at 8.0 eV. The difference in workfunction between these measurements is consistent with a separate Auger Microprobe study of facet dependence Imanishi et al. (2007).
Based on this limited data set, the GW based prediction for the VBM alignment is off by about 0.4 eV. There are at least 0.1 eV uncertainties in both the theory and the experiment. Since both the work function and position of Fermi level are sensitive to the surface properties, the deviation between the theoretical calculation and experimental measurements may well reflect the complexity of the TiO2 surfaces. For example, recent studies suggest that the commonly employed strategy of cleaning followed by annealing in oxygen may not result in the ideal surface envisioned (e.g. with no oxygen related defects) Wendt et al. (2008). In particular, the physical origin of the widely observed defect states around 1 eV below the CBM remains a point of vigorous discussionDi Valentin et al. (2006); Wendt et al. (2008).
IV Concluding Remarks
We have presented a numerically well converged MBPT study of the electronic and optical excitation energies in rutile and anatase crystals of TiO2. The calculations are carried out in the approximation of a frozen lattice, without consideration of electron-phonon coupling. In most respects, the agreement with experiment is well within the expected accuracy of this approach. In particular, the calculated quasiparticle gap agrees with electron spectroscopy measurements (photoemission and inverse photoemission), the change in the minimum gap between rutile and anatase crystal structures is reproduced, and the main features of the optical spectrum agree with ellipsometry measurements. The qualitative features of the zone center bound excitons calculated for rutile agree well with low temperature absorption measurements. However, the scale of the exciton binding energy is larger than that estimated from experiment by about a factor of 10 and the calculated exciton energy is about 0.2 eV larger than measured.
The key theoretical assumptions in our application of MBPT include evaluation of the electron self energy in the GW approximation without iterating to self consistency or considering vertex corrections. Self consistency would certainly increase the calculated energy gap through the reduction in the screening van Schilfgaarde et al. (2006); Shishkin and Kresse (2007). Recent results for a set of other semiconductors and insulators shows that approximate inclusion of vertex corrections in screening leads to a partially compensating reduction of the calculated energy gapShishkin et al. (2007). However, a fully consistent approach to include vertex corrections remains subject of current research in the field. Because the Ti electrons are almost completely ionized, TiO2 should not be subject to the sorts of systematic errors found in non-selfconsistent calculations for some late transition metal compoundsAryasetiawan and Gunnarsson (1995); Faleev et al. (2004); Bruneval et al. (2006b) The accurate results found for the key optical transition energies contributing to the absorption (Figs. 3 and 4) support this, and contrast to the case of Cu2O where non-selfconsistent calculations showed substantial discrepenciesBruneval et al. (2006b). In the solution of the BSE, the calculated static (electronic) dielectric matrix has been used and the equations were simplified through the Tamm-Dancoff approximation. These approximations are part of the standard MBPT treatment of optical spectra and the low energy excitons are expected to be treated wellRohlfing and Louie (2000); Onida et al. (2002). However, they may affect higher energy features in the spectraMarini and Del Sole (2003).
On physical grounds, we suggest that the most significant open issue concerns the role of electron-phonon coupling. In general, the electron-phonon self energy will both lead to a smaller zero-temperature quasiparticle gap and make a significant contribution to the temperature dependence of the energy gap Cardona and Thewalt (2005). As noted in the text, there is a very large difference between the electronic dielectric constant and the low frequency dielectric constant including lattice polarization for TiO2. This suggests a relatively strong electron-phonon interaction and there is a long standing debate over the polaronic character of charge excitations in TiO2 PNo .
Based on the usual form of the Frohlich interaction, the dimensionless coupling constant characterizing electronic coupling to the most important polar optic mode for rutile (with mode energy about 0.1 eV) is given by where is the bare band mass and is the free electron mass. Using our DFT band dispersions to have estimates, the electron (hole) band mass is about 0.6 (1.8) along or and 1.6 (3.1) along . This suggests coupling constants of for electrons and for holes which would fall in the weak to intermediate coupling regime. Using the usual weak coupling expression, the electron and hole renormalization would be eV and eV respectively, both of which act to reduce the quasiparticle energy gap. For anatase , essentially the same as rutile, based on the mode energy and dielectric constants Gonzalez et al. (1997). The electron (hole) band mass is about 0.4 (1.8) along or and 3.9(1.0) along , suggesting slightly different coupling constants of for electrons and for holes with corresponding (weak coupling) electron and hole renormalization of 0.1-0.3 eV and 0.2 eV respectively. In weak coupling, the electron-phonon self energy is added to the results obtained here based on the GW approximation. For the analysis of the optical absorption edge, a more detailed calculation is required because in the exciton-phonon coupling, the exciton is neutral and the electron and hole distortions of the lattice will partially cancel Schmitt-Rink et al. (1987); Rudin et al. (1990). Taken together, if the large polaron regime is physically correct, these rough estimates suggest that the effect of the electron-phonon coupling could account for some of the differences between the present GW/BSE results for the frozen lattice and experiment. Firmer conclusions require a more extensive set of calculations, beyond the scope of this article Cardona and Thewalt (2005); Marini (2008); Bechstedt et al. (2005); Vidal et al. (2010). In particular, it may be that a more complete consideration of self-consistency and vertex corrections in the electron-electron contribution to the electron self energy will need to be combined with an analysis of the electron-phonon contribution. The two contributions should be treated in a fully consistent theory. In more empirical terms, an overstimate of the band gap based on selfconsistent treatment of the electron-electron interactions alone may be compensated by the electron-phonon contributions.
It may well be the case that the large polaron regime is not applicable for TiO2. A recent THz spectroscopy study of rutile gave a direct measurement of the electron scattering rate Hendry et al. (2004). This data was analyzed with a Frohlich form for the electron-phonon interaction, but regarding the coupling constant as a free parameter. Using the Feynman approach Feynman (1955); Schultz (1959) to handle intermediate to strong coupling, the analysis showed coupling constants for electrons depending on field orientation Hendry et al. (2004). The inferred electron mobilities were consistent with earlier electron transport measurements Yagi et al. (1996). These values suggest a substantially larger value for the electron self energy of eV Schultz (1959). An older estimate based on small polaron theory also suggested 0.7 eV Eagles (1964). A recent DFT+U based study suggested that an excess electron in rutile is indeed self trapped Deskins and Dupuis (2007). Although the binding energy was not presented, the barrier for polaron hopping was estimated to be 0.3 eV. A similar study for an excess hole in rutile suggested barriers of 0.5 - 0.6 eV Deskins and Dupuis (2009). Taken together, if the small polaron regime is found to be physically relevant, then the quasiparticle and excitonic energies will need to be fully reanalyzed. For strong electron-phonon coupling a perturbative approach to combine the electron-electron and electron-phonon self energies is no longer justified. Furthermore, the electron-phonon coupling enters into the spectroscopic measurements in distinct ways. The (inverse) photoemission and optical absorption would each need to be properly analyzed.
Acknowledgements.
We thank Dr. A. Marini for access to the private branch of the Yambo code. W. K. thanks Dr. D. Prezzi for insightfull discussions on BSE. Work performed under the auspices of the U.S. Department of Energy under Contract No. DEAC02- 98CH1-886. This research utilized resources at the New York Center for Computational Sciences at Stony Brook University/Brookhaven National Laboratory which is supported by the U.S. Department of Energy under Contract No. DE-AC02-98CH10886 and by the State of New York.References
- Grant (1959) F. A. Grant, Rev. Mod. Phys. 31, 646 (1959).
- Diebold (2003) U. Diebold, Surf. Sci. Rep. 48, 53 (2003).
- Fox and Dulay (1993) M. A. Fox and M. T. Dulay, Chem. Rev. 93, 341 (1993).
- Hoffmann et al. (1995) M. R. Hoffmann, S. T. Martin, W. Choi, and D. W. Bahnemann, Chem. Rev. 95, 69 (1995).
- Fujishima and Honda (1972) A. Fujishima and K. Honda, Nature 238, 37 (1972).
- Oregan and Gratzel (1991) B. Oregan and M. Gratzel, Nature 353, 737 (1991).
- Pauling (1929) L. Pauling, J. Am. Chem. Soc. 51, 1010 (1929).
- Abrahams and Bernstein (1971) S. C. Abrahams and J. L. Bernstein, J. Chem. Phys. 55, 3206 (1971).
- Horn et al. (1972) M. Horn, C. F. Schwerdtfeger, and E. P. Meagher, Z. Kristallogr. 136, 273 (1972), as cited in Fahmi et al. (1993).
- Fahmi et al. (1993) A. Fahmi, C. Minot, B. Silvi, and M. Causá, Phys. Rev. B 47, 11717 (1993).
- Burdett et al. (1987) J. K. Burdett, T. Hughbanks, G. J. Miller, J. W. Richardson, and J. V. Smith, J. Am. Chem. Soc. 109, 3639 (1987).
- Hohenberg and Kohn (1964) P. Hohenberg and W. Kohn, Phys. Rev. 136, B864 (1964).
- Kohn and Sham (1965) W. Kohn and L. J. Sham, Phys. Rev. 140, A1133 (1965).
- Glassford and Chelikowsky (1992a) K. M. Glassford and J. R. Chelikowsky, Phys. Rev. B 46, 1284 (1992a).
- Mo and Ching (1995) S.-D. Mo and W. Y. Ching, Phys. Rev. B 51, 13023 (1995).
- Mikami et al. (2000) M. Mikami, S. Nakamura, O. Kitao, H. Arakawa, and X. Gonze, Jpn. J. Appl. Phys. 39, L847 (2000).
- Asahi et al. (2000) R. Asahi, Y. Taga, W. Mannstadt, and A. J. Freeman, Phys. Rev. B 61, 7459 (2000).
- Pascual et al. (1977) J. Pascual, J. Camassel, and H. Mathieu, Phys. Rev. Lett. 39, 1490 (1977).
- Tang et al. (1993) H. Tang, H. Berger, P. Schmid, F. Lévy, and G. Burri, Solid State Commun. 87, 847 (1993).
- Zhang et al. (2005) Y.-f. Zhang, W. Lin, Y. Li, K.-n. Ding, and J.-q. Li, J. Phys. Chem. B 109, 19270 (2005).
- Muscat et al. (2001) J. Muscat, A. Wander, and N. M. Harrison, Chem. Phys. Lett. 342, 397 (2001).
- Nolan et al. (2008) M. Nolan, S. D. Elliott, J. S. Mulley, R. A. Bennett, M. Basham, and P. Mulheran, Phys. Rev. B 77, 235424 (2008).
- Hedin (1965) L. Hedin, Phys. Rev. 139, A796 (1965).
- Hybertsen and Louie (1986) M. S. Hybertsen and S. G. Louie, Phys. Rev. B 34, 5390 (1986).
- Aryasetiawan and Gunnarsson (1998) F. Aryasetiawan and O. Gunnarsson, Rep. Prog. Phys. 61, 237 (1998).
- Aulbur et al. (1999) W. G. Aulbur, L. Jönsson, and J. W. Wilkins, Solid State Phys. 54, 1 (1999).
- Onida et al. (2002) G. Onida, L. Reining, and A. Rubio, Rev. Mod. Phys. 74, 601 (2002).
- Oshikiri et al. (2003) M. Oshikiri, M. Boero, J. Ye, F. Aryasetiawan, and G. Kido, Thin Solid Films 445, 168 (2003).
- van Schilfgaarde et al. (2006) M. van Schilfgaarde, T. Kotani, and S. Faleev, Phys. Rev. Lett. 96, 226402 (2006).
- Thulin and Guerra (2008) L. Thulin and J. Guerra, Phys. Rev. B 77, 195112 (2008).
- Mowbray et al. (2009) D. J. Mowbray, J. I. Martinez, J. M. García Lastra, K. S. Thygesen, and K. W. Jacobsen, J. Phys. Chem. C 113, 12301 (2009).
- Glassford and Chelikowsky (1992b) K. M. Glassford and J. R. Chelikowsky, Phys. Rev. B 45, 3874 (1992b).
- Ehrenreich and Cohen (1959) H. Ehrenreich and M. H. Cohen, Phys. Rev. 115, 786 (1959).
- Cardona and Harbeke (1965) M. Cardona and G. Harbeke, Phys. Rev. 137, A1467 (1965).
- Hosaka et al. (1997) N. Hosaka, T. Sekiya, C. Satoko, and S. Kurita, J. Phys. Soc. Jpn. 66, 877 (1997).
- Rohlfing and Louie (2000) M. Rohlfing and S. G. Louie, Phys. Rev. B 62, 4927 (2000).
- Lawler et al. (2008) H. M. Lawler, J. J. Rehr, F. Vila, S. D. Dalosto, E. L. Shirley, and Z. H. Levine, Phys. Rev. B 78, 205108 (2008).
- Shirley (1996) E. L. Shirley, Phys. Rev. B 54, 7758 (1996).
- Holm and von Barth (1998) B. Holm and U. von Barth, Phys. Rev. B 57, 2108 (1998).
- Ku and Eguiluz (2002) W. Ku and A. G. Eguiluz, Phys. Rev. Lett. 89, 126401 (2002).
- Bruneval et al. (2006a) F. Bruneval, N. Vast, and L. Reining, Phys. Rev. B 74, 045102 (2006a).
- Kotani et al. (2007) T. Kotani, M. van Schilfgaarde, and S. V. Faleev, Phys. Rev. B 76, 165106 (2007).
- Shishkin et al. (2007) M. Shishkin, M. Marsman, and G. Kresse, Phys. Rev. Lett. 99, 246403 (2007).
- Shishkin and Kresse (2007) M. Shishkin and G. Kresse, Phys. Rev. B 75, 235102 (2007).
- von der Linden and Horsch (1988) W. von der Linden and P. Horsch, Phys. Rev. B 37, 8351 (1988).
- Tezuka et al. (1994) Y. Tezuka, S. Shin, T. Ishii, T. Ejima, S. Suzuki, and S. Sato, J. Phys. Soc. Jpn. 63, 347 (1994).
- See and Bartynski (1994) A. K. See and R. A. Bartynski, Phys. Rev. B 50, 12064 (1994).
- Gonze et al. (2002) X. Gonze, J. M. Beuken, R. Caracas, F. Detraux, M. Fuchs, G. M. Rignanese, L. Sindic, M. Verstraete, G. Zerah, F. Jollet, et al., Comput. Mater. Sci. 25, 478 (2002).
- Gonze et al. (2005) X. Gonze, G. M. Rignanese, M. Verstraete, J. M. Beuken, Y. Pouillon, R. Caracas, F. Jollet, M. Torrent, G. Zerah, M. Mikami, et al., Zeitschrift Fur Kristallographie 220, 558 (2005).
- (50) URL http://opium.sourceforge.net/.
- Troullier and Martins (1991) N. Troullier and J. L. Martins, Phys. Rev. B 43, 1993 (1991).
- Fuchs and Scheffler (1999) M. Fuchs and M. Scheffler, Comput. Phys. Commun. 119, 67 (1999).
- Perdew and Wang (1992) J. P. Perdew and Y. Wang, Phys. Rev. B 45, 13244 (1992).
- Ceperley and Alder (1980) D. M. Ceperley and B. J. Alder, Phys. Rev. Lett. 45, 566 (1980).
- Vast et al. (2002) N. Vast, L. Reining, V. Olevano, P. Schattschneider, and B. Jouffrey, Phys. Rev. Lett. 88, 037601 (2002).
- Kresse and Furthmüller (1996) G. Kresse and J. Furthmüller, Comput. Mater. Sci. 6, 15 (1996).
- Kresse and Furthmüller (1996) G. Kresse and J. Furthmüller, Phys. Rev. B 54, 11169 (1996).
- Blöchl (1994) P. E. Blöchl, Phys. Rev. B 50, 17953 (1994).
- Cromer and Herrington (1955) D. T. Cromer and K. Herrington, J. Am. Chem. Soc. 77, 4708 (1955).
- Hedin and Lundqvist (1969) L. Hedin and S. Lundqvist, Solid State Phys. 23, 1 (1969).
- Aryasetiawan and Gunnarsson (1995) F. Aryasetiawan and O. Gunnarsson, Phys. Rev. Lett. 74, 3221 (1995).
- Faleev et al. (2004) S. V. Faleev, M. van Schilfgaarde, and T. Kotani, Phys. Rev. Lett. 93, 126406 (2004).
- Bruneval et al. (2006b) F. Bruneval, N. Vast, L. Reining, M. Izquierdo, F. Sirotti, and N. Barrett, Phys. Rev. Lett. 97, 267601 (2006b).
- Hybertsen and Louie (1985) M. S. Hybertsen and S. G. Louie, Phys. Rev. B 32, 7005 (1985).
- Shirley (1998) E. L. Shirley, Phys. Rev. B 58, 9579 (1998).
- Rojas et al. (1995) H. N. Rojas, R. W. Godby, and R. J. Needs, Phys. Rev. Lett. 74, 1827 (1995).
- Rieger et al. (1999) M. M. Rieger, L. Steinbeck, I. White, H. Rojas, and R. Godby, Comput. Phys. Commun. 117, 211 (1999).
- Marini et al. (2002a) A. Marini, R. D. Sole, A. Rubio, and G. Onida, Phys. Rev. B 66, 161104(R) (2002a).
- Marini et al. (2002b) A. Marini, G. Onida, and R. D. Sole, Phys. Rev. Lett. 88, 016403 (2002b).
- Shishkin and Kresse (2006) M. Shishkin and G. Kresse, Phys. Rev. B 74, 035101 (2006).
- Lebègue et al. (2003) S. Lebègue, B. Arnaud, M. Alouani, and P. E. Bloechl, Phys. Rev. B 67, 155208 (2003).
- Bruneval (2005) F. Bruneval, Ph.D. thesis, Ecole Polytechnique, Palaiseau, France (2005), URL http://theory.lsi.polytechnique.fr/people/bruneval/bruneval_t%heses.pdf.
- Marini et al. (2009) A. Marini, C. Hogan, M. Grüning, and D. Varsano, Comput. Phys. Commun. 180, 1392 (2009).
- Monkhorst and Pack (1976) H. J. Monkhorst and J. D. Pack, Phys. Rev. B 13, 5188 (1976).
- Bruneval and Gonze (2008) F. Bruneval and X. Gonze, Phys. Rev. B 78, 085125 (2008).
- Fetter and Walecka (1971) A. L. Fetter and J. D. Walecka, Quantum Theory of Many-Particle Systems (McGraw-Hill, 1971).
- Benedict and Shirley (1999) L. X. Benedict and E. L. Shirley, Phys. Rev. B 59, 5441 (1999).
- Gurtubay et al. (2004) I. G. Gurtubay, W. Ku, J. M. Pitarke, A. G. Eguiluz, B. C. Larson, J. Tischler, and P. Zschack, Phys. Rev. B 70, 201201 (2004).
- Sanjinés et al. (1994) R. Sanjinés, H. Tang, H. Berger, F. Gozzo, G. Margaritondo, and F. Lévy, J. Appl. Phys. 75, 2945 (1994).
- Cardona and Thewalt (2005) M. Cardona and M. L. W. Thewalt, Rev. Mod. Phys. 77, 1173 (2005).
- Tang et al. (1995) H. Tang, F. Lévy, H. Berger, and P. E. Schmid, Phys. Rev. B 52, 7771 (1995).
- Schleife et al. (2009) A. Schleife, C. Rodl, F. Fuchs, J. Furthmuller, and F. Bechstedt, Phys. Rev. B 80, 035112 (2009).
- Grüning et al. (2009) M. Grüning, A. Marini, and X. Gonze, Nano Lett. 9, 2820 (2009).
- Marini and Del Sole (2003) A. Marini and R. Del Sole, Phys. Rev. Lett. 91, 176402 (2003).
- Zhang et al. (1988) S. B. Zhang, D. Tomanek, S. G. Louie, M. L. Cohen, and M. S. Hybertsen, Solid State Commun. 66, 585 (1988).
- Baldereschi et al. (1988) A. Baldereschi, S. Baroni, and R. Resta, Phys. Rev. Lett. 61, 734 (1988).
- Fall et al. (1999) C. J. Fall, N. Binggeli, and A. Baldereschi, J. Phys.: Condens. Matter 11, 2689 (1999).
- Shaltaf et al. (2008) R. Shaltaf, G. M. Rignanese, X. Gonze, F. Giustino, and A. Pasquarello, Phys. Rev. Lett. 100, 186401 (2008).
- Fall et al. (1998) C. J. Fall, N. Binggeli, and A. Baldereschi, Phys. Rev. B 58, R7544 (1998).
- Fall et al. (2000) C. J. Fall, N. Binggeli, and A. Baldereschi, Phys. Rev. B 61, 8489 (2000).
- Vogtenhuber et al. (2002) D. Vogtenhuber, R. Podloucky, J. Redinger, E. L. D. Hebenstreit, W. Hebenstreit, and U. Diebold, Phys. Rev. B 65, 125411 (2002).
- Kiejna et al. (2006) A. Kiejna, T. Pabisiak, and S. W. Gao, J. Phys.: Condens. Matter 18, 4207 (2006), and reference herein.
- Onda et al. (2004) K. Onda, B. Li, and H. Petek, Phys. Rev. B 70, 045415 (2004).
- Schierbaum et al. (1996) K. D. Schierbaum, S. Fischer, M. C. Torquemada, J. L. de Segovia, E. Román, and J. A. Martín-Gago, Surf. Sci. 345, 261 (1996).
- Wendt et al. (2008) S. Wendt, P. T. Sprunger, E. Lira, G. K. H. Madsen, Z. Li, J. O. Hansen, J. Matthiesen, A. Blekinge-Rasmussen, E. Laegsgaard, B. Hammer, et al., Science 320, 1755 (2008).
- Xiong et al. (2007) G. Xiong, R. Shao, T. Droubay, A. Joly, K. Beck, S. Chambers, and W. Hess, Adv. Funct. Mater. 17, 2133 (2007).
- Imanishi et al. (2007) A. Imanishi, E. Tsuji, and Y. Nakato, J. Phys. Chem. C 111, 2128 (2007).
- Di Valentin et al. (2006) C. Di Valentin, G. Pacchioni, and A. Selloni, Phys. Rev. Lett. 97, 166803 (2006).
- (99) Detailed references can be found in the papers cited below Eagles (1964); Hendry et al. (2004); Yagi et al. (1996); Deskins and Dupuis (2007, 2009).
- Gonzalez et al. (1997) R. J. Gonzalez, R. Zallen, and H. Berger, Phys. Rev. B 55, 7014 (1997).
- Schmitt-Rink et al. (1987) S. Schmitt-Rink, D. A. B. Miller, and D. S. Chemla, Phys. Rev. B 35, 8113 (1987).
- Rudin et al. (1990) S. Rudin, T. L. Reinecke, and B. Segall, Phys. Rev. B 42, 11218 (1990).
- Marini (2008) A. Marini, Phys. Rev. Lett. 101, 106405 (2008).
- Bechstedt et al. (2005) F. Bechstedt, K. Seino, P. H. Hahn, and W. G. Schmidt, Phys. Rev. B 72, 245114 (2005).
- Vidal et al. (2010) J. Vidal, F. Trani, F. Bruneval, M. A. L. Marques, and S. Botti, Phys. Rev. Lett. 104, 136401 (2010).
- Hendry et al. (2004) E. Hendry, F. Wang, J. Shan, T. F. Heinz, and M. Bonn, Phys. Rev. B 69, 081101 (2004).
- Feynman (1955) R. P. Feynman, Phys. Rev. 97, 660 (1955).
- Schultz (1959) T. D. Schultz, Phys. Rev. 116, 526 (1959).
- Yagi et al. (1996) E. Yagi, R. R. Hasiguti, and M. Aono, Phys. Rev. B 54, 7945 (1996).
- Eagles (1964) D. Eagles, J. Phys. Chem. Solids 25, 1243 (1964).
- Deskins and Dupuis (2007) N. A. Deskins and M. Dupuis, Phys. Rev. B 75, 195212 (2007).
- Deskins and Dupuis (2009) N. A. Deskins and M. Dupuis, J. Phys. Chem. C 113, 346 (2009).