Monte-Carlo Simulations of Thermal Comptonization Process in a Two Component Accretion Flow Around a Black Hole in presence of an Outflow
Abstract
A black hole accretion may have both the Keplerian and the sub-Keplerian components. The Keplerian component supplies low-energy (soft) photons while the sub-Keplerian component supplies hot electrons which exchange their energy with the soft photons through Comptonization or inverse Comptonization processes. In the sub-Keplerian flow, a shock is generally produced due to the centrifugal force. The post-shock region is known as the CENtrifugal pressure supported BOundary Layer or CENBOL. We compute the effects of the thermal and the bulk motion Comptonization on the soft photons emitted from a Keplerian disk by the CENBOL, the pre-shock sub-Keplerian disk and the outflowing jet. We study the emerging spectrum when both the converging inflow and the diverging outflow (generated from the CENBOL) are simultaneously present. From the strength of the shock, we calculate the percentage of matter being carried away by the outflow and determined how the emerging spectrum depends on the the outflow rate. The pre-shock sub-Keplerian flow was also found to Comptonize the soft photons significantly. The interplay among the up-scattering and down-scattering effects determines the effective shape of the emerging spectrum. By simulating several cases with various inflow parameters, we conclude that whether the pre-shock flow, or the post-shock CENBOL or the emerging jet is dominant in shaping the emerging spectrum, strongly depends on the geometry of the flow and the strength of the shock in the sub-Keplerian flow.
keywords:
accretion disk, black hole physics, shock waves, radiative processes, Monte-Carlo simulationsManaging Editor
1 Introduction
It is well known (Chakrabarti 1990, hereafter C90) that the flow velocity is the same as the velocity of light as the matter enters through the event horizon. However, the sound speed is never so high. Thus the incoming flow on a black hole is always supersonic and thus these solutions are likely to be most relevant in the study of the physical processes around black holes. As the flow begins its journey sub-sonically very far away, and becomes supersonic on the horizon, the flow is also known as a transonic flow. In the context of the spherical flows, Bondi (1952) solution of accretion and Parker (1959) solution of winds are clear examples of transonic flows. But they have only one sonic points. In presence of angular momenta, the flow may have two saddle type sonic points with a shock in between (C90, Chakrabarti, 1996). The solutions with shocks have been extensively studied in both the accretion and the winds even when rotation, heating, cooling etc. are included (Chakrabarti, 1990, 1996). The study demonstrates that the accretion and the winds are inter-related – the outflows are generated from the post-shock region. Subsequently, in Chakrabarti (1999, hereafter C99), Das & Chakrabarti (1999) and Das et al. (2001), the mass outflow rate was computed as a function of the shock strength and other flow parameters. Meanwhile, in the so-called two component advective flow (TCAF) model of Chakrabarti & Titarchuk (1995) and Chakrabarti (1997), the spectral states were shown to depend on the location and strength of the shock. Thus, C99 for the first time, brought out the relationship between the jets and outflows with the presence or absence of shocks, and therefore with the spectral states of a black hole candidates. This paves the way to study the relative importance between the Compton cloud and the outflow as far as emerging spectrum is concerned.
Computation of the spectral characteristics have so far concentrated only on the advective accretion flows (Chakrabarti & Titarchuk, 1995; Chakrabarti & Mandal, 2006) and the outflow or the base of the jet was not included. In the Monte-Carlo simulations of Laurent & Titarchuk (2007) outflows in isolation were used, but not in conjunction with inflows. In Ghosh, Chakrabarti & Laurent (2009, hereafter Paper I), the results of Monte-Carlo simulations in a setup similar to that of Chakrabarti & Titarchuk (1995) was presented. In the present paper, we improve this and obtain the outgoing spectrum in presence of both inflows and outflows. We also include a Keplerian disk inside an advective flow which is the source of soft photons. We show how the spectrum depends on the flow parameters of the inflow, such as the accretion rates of the two components and the shock strength. The post-shock region being denser and hotter, it behaves like the so-called ’Compton cloud’ in the classical model of Sunyaev and Titarchuk (1980). This region is known as the CENtrifugal pressure supported BOundary Layer or CENBOL. Since the shock location and its strength depends on the inflow parameters, the variation of the size of the Compton cloud, and then the basic Comptonized component of the spectrum is thus a function of the basic parameters of the flow, such as the specific energy, the accretion rate and the specific angular momentum. Since the intensity of soft photons determines the Compton cloud temperature, the result depends on the accretion rate of the Keplerian component also. In our result, we see the effects of the bulk motion Comptonization (Chakrabarti & Titarchuk, 1995) because of which even a cooler CENBOL produces a harder spectrum. At the same time, the effect of down-scattering due the outflowing electrons is also seen, because of which even a hotter CENBOL causes the disk-jet system to emit lesser energetic photons. Thus, the net spectrum is a combination of all these effects.
In the next section, we discuss the geometry of the soft photon source and the Compton cloud in our Monte-Carlo simulations. In §3, we present the variation of the thermodynamic quantities and other vital parameters inside the Keplerian disk and the Compton cloud which are required for the Monte-Carlo simulations. In §4, we describe the simulation procedure and in §5, we present the results of our simulations. Finally in §6, we make concluding remarks.
2 Geometry of the electron cloud and the soft photon source
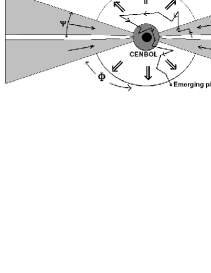
The problem at hand is very complex and thus we need to simplify the geometry of the inflow-outflow configuration without sacrificing the salient features. In Fig. 1, we present a cartoon diagram of our simulation set up. The components of the hot electron clouds, namely, the CENBOL, the outflow and the sub-Keplerian flow, intercept the soft photons emerging out of the Keplerian disk and reprocess them via inverse Compton scattering. An injected photon may undergo a single, multiple or no scattering at all with the hot electrons in between its emergence from the Keplerian disk and its detection by the telescope at a large distance. The photons which enter the black holes are absorbed. The CENBOL, though toroidal in nature, is chosen to be of spherical shape for simplicity. The sub-Keplerian inflow in the pre-shock region is assumed to be of wedge shape of a constant angle . The outflow, which emerges from the CENBOL in this picture is also assumed to be of constant conical angle . In reality, inflow and outflow both could have somewhat different shapes, depending on the balance of the force components. However, the final result is not expected to be sensitive to such assumptions.
2.1 Distribution of temperature and density inside the Compton cloud
We assume the black hole to be non-rotating and we use the pseudo-Newtonian potential (Paczyński & Wiita, 1980) to describe the geometry around a black hole. This potential is (Here, is in the unit of Schwarzschild radius ). Velocities and angular momenta are measured are in units of , the velocity of light and respectively. For simplicity, we chose the Bondi accretion solution in pseudo-Newtonian geometry to describe both the accretion and winds. The equation of motion of the sub-Keplerian matter around the black hole in the steady state is assumed to be given by,
Integrating this equation, we get the expression of the conserved specific energy as,
| (1) |
Here is the thermal pressure and is the adiabatic sound speed, given by , being the adiabatic index and is equal to in our case. The conserved mass flux equation, as obtained from the continuity equation, is given by
| (2) |
where, is the density of the matter and is the solid angle subtended by the flow. For an inflowing matter, is given by,
where, is the half-angle of the conical inflow. For the outgoing matter, the solid angle is given by,
where is the half-angle of the conical outflow. From Eqn. 2, we get
| (3) |
The quantity is the Chakrabarti rate (Chakrabarti, 1989, C90, 1996) which includes the entropy, being the constant measuring the entropy of the flow, and is called the polytropic index. We take derivative of equations (1) and (3) with respect to and eliminating from both the equations, we get the gradient of the velocity as,
| (4) |
From this, we obtain the Bondi accretion and wind solutions in the usual manner (C90). Solving these equations we obtain, , and finally the temperature profile of the electron cloud () using , where is the mean molecular weight, is the proton mass and is the Boltzmann constant. Using Eq. (2), we calculate the mass density , and hence, the number density variation of electrons inside the Compton cloud. We ignore the electron-positron pair formation inside the cloud.
The flow is supersonic in the pre-shock region and sub-sonic in the post-shock (CENBOL) region. We chose this surface at a location where the pre-shock Mach number . This location depends on the specific energy (C90). In our simulation, we have chosen so that we get . We simulated a total of six cases. For Cases 1(a-c), we chose , and for Cases 2(a-c), the values are listed in Table 2. The velocity variation of the sub-Keplerian flow is the inflowing Bondi solution (pre-sonic point). The density and the temperature of this flow have been calculated according to the above mentioned formulas. Inside the CENBOL, both the Keplerian and the sub-Keplerian components are mixed together. The velocity variation of the matter inside the CENBOL is assumed to be the same as the Bondi accretion flow solution reduced by the compression ratio due to the shock. The compression ratio (i.e., the ratio between the post-shock and pre-shock densities) is also used to compute the density and the temperature profile has been calculated accordingly. When the outflow is adiabatic, the ratio of the outflow to the inflow rate is (Das et al. 2001) given by,
| (5) |
here, we have used for a relativistic flow. From this, and the velocity variation obtained from the outflow branch of Bondi solution, we compute the density variation inside the jet. In our simulation, we have used and . Fig. 2 shows the variation of the percentage of matter in the outflow for these particular parameters.

2.2 Keplerian disk
The soft photons are produced from a Keplerian disk whose inner edge coincides with CENBOL surface, while the outer edge is located at . The source of soft photons have a multi-color blackbody spectrum coming from a standard (Shakura & Sunyaev, 1973, hereafter SS73) disk. We assume the disk to be optically thick and the opacity due to free-free absorption is more important than the opacity due to scattering. The emission is black body type with the local surface temperature (SS73):
| (6) |
The total number of photons emitted from the disk surface is obtained by integrating over all frequencies () and is given by,
| (7) |
The disk between radius to injects number of soft photons.
| (8) |
where, is the half height of the disk given by:
| (9) |
The soft photons are generated isotropically between the inner and outer edge of the Keplerian disk but their positions are randomized using the above distribution function (Eq. 8) of black body temperature . All the results of the simulations presented here have used the number of injected photons to be . In the above equations, the mass of the black hole is measured in units of the mass of the Sun (), the disk accretion rate is in units of gm/s. We chose and .
2.3 Simulation Procedure
In a given simulation, we assume a given Keplerian rate and a given sub-Keplerian halo rate. The specific energy of the halo provides hydrodynamic properties (such as number density of the electrons and the velocity variation) and the thermal properties of matter. Since we chose the Paczynski-Wiita (1980) potential, the radial velocity is not exactly unity at , the horizon, but it becomes unity just outside. In order not to over estimate the effects of bulk motion Comptonization which is due to the momentum transfer of the moving electrons to the horizon, we shift the horizon just outsize where the velocity is unity. The shock location of the CENBOL is chosen where the Mach number for simplicity and the compression ratio at the shock is assumed to be a free parameter. These simplifying assumptions are not expected to affect our conclusions. Photons are generated from the Keplerian disk according to the prescription in SS73 as mentioned before and are injected into the sub-Keplerian halo, the CENBOL and the outflowing jet.
In a simulation, we randomly generated a soft photon out of the Keplerian disk. The energy of the soft photon at radiation temperature are calculated using the Planck’s distribution formula, where the number density of the photons () having an energy is expressed by
| (10) |
where ; is the Riemann zeta function.
Using another set of random numbers we obtained the direction of the injected photons and with yet another random number we obtained a target optical depth at which the scattering takes place. The photon was followed within the CENBOL till the optical depth () reached . The increase in optical depth () during its traveling of a path of length inside the electron cloud is given by: , where is the electron number density.
The total scattering cross section is given by Klein-Nishina formula:
| (11) |
where, is given by,
| (12) |
is the classical electron radius and is the mass of the electron.
We have assumed here that a photon of energy and momentum is scattered by an electron of energy and momentum , with and . At this point a scattering is allowed to take place. The photon selects an electron and the energy exchange is computed through Compton or inverse Compton scattering formula. The electrons are assumed to obey relativistic Maxwell distribution inside the CENBOL. The number of Maxwellian electrons having momentum between to is expressed by,
| (13) |
Generally, the same procedure as in Paper I was used, except that we are now focusing on those photons also photons which were scattered at least once by the outflow. We are especially choosing the cases when the jet could play a major role in shaping the spectrum.
3 Results and Discussions
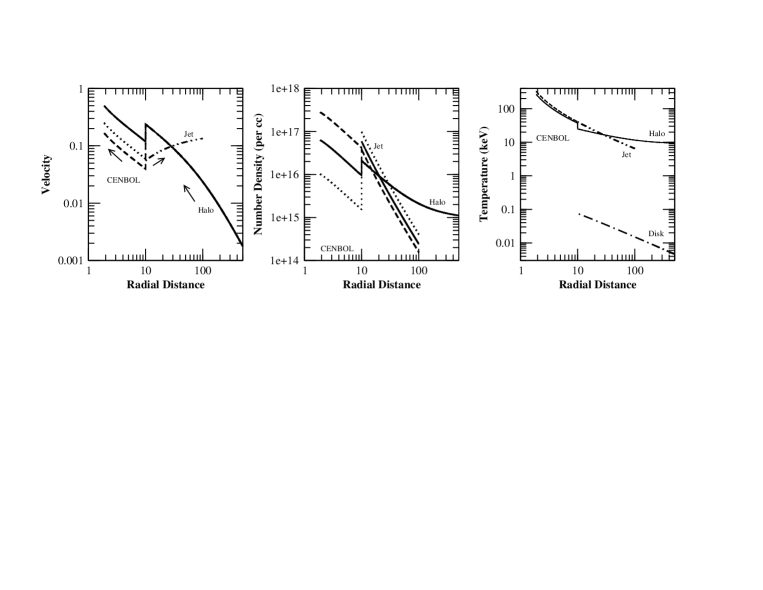
In Fig. 3(a-c) we present the velocity, electron number density and temperature variations as a function of the radial distance from the black hole for specific energy . and were chosen. Three cases were run by varying the compression ratio . These are given in Col. 2 of Table 1. The corresponding percentage of matter going in the outflow is also given in Col. 2. In the left panel, the bulk velocity variation is shown. The solid, dotted and dashed curves are the same for (Case 1a), (Case 1b) and (Case 1c) respectively. The same line style is used in other panels. The velocity variation within the jet does not change with , but the density (in the unit of ) does (middle panel). The doubledot-dashed line gives the velocity variation of the matter within the jet for all the above cases. The arrows show the direction of the bulk velocity (radial direction in accretion, vertical direction in jets). The last panel gives the temperature (in keV) of the electron cloud in the CENBOL, jet, sub-Keplerian and Keplerian disk. Big dash-dotted line gives the temperature profile inside the Keplerian disk.
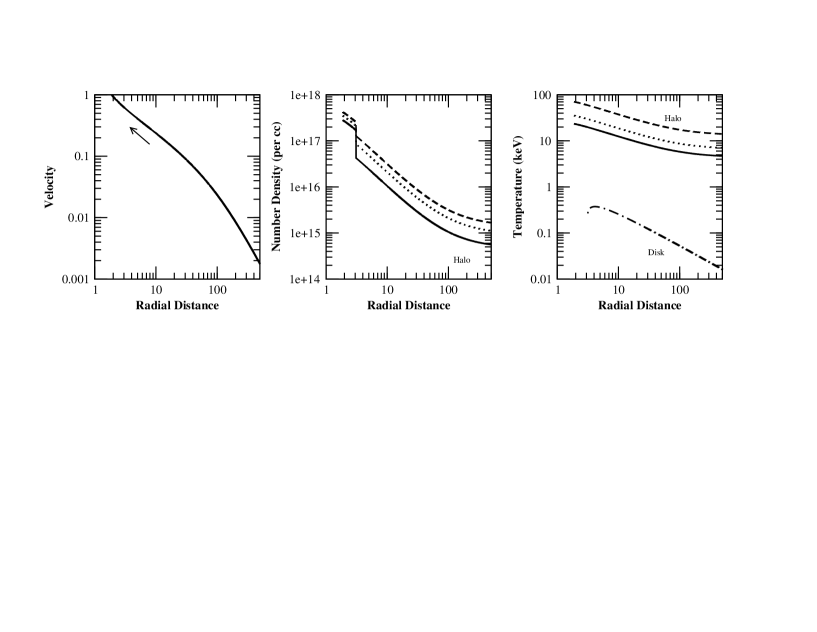
In Figs. 4(a-c), we show the velocity (left), number density of electrons (middle) and temperature (right) profiles of Cases 2(a-c) as described in Table 2. Here we have fixed and is varied: (solid), (dotted) and (dashed). No jet is present in this case (). To study the effects of bulk motion Comptonization, the temperature of the electron cloud has been kept low for these cases. The temperature profile in the different cases has been chosen according to the Fig. 3b of CT95. The temperature profile of the Keplerian disk for the above cases has been marked as ‘Disk’ .
| Table 1 | |||||||||
|---|---|---|---|---|---|---|---|---|---|
| Case | R, | ||||||||
| 1a | 2, 58 | 2.7E+08 | 4.03E+08 | 1.35E+07 | 7.48E+07 | 8.39E+08 | 3.35E+05 | 63 | 0.43 |
| 1b | 4, 97 | 2.7E+08 | 4.14E+08 | 2.39E+06 | 1.28E+08 | 8.58E+08 | 3.27E+05 | 65 | 1.05 |
| 1c | 6, 37 | 2.7E+08 | 3.98E+08 | 5.35E+07 | 4.75E+07 | 8.26E+08 | 3.07E+05 | 62 | -0.4 |
In Table 1, we summarize the details of all the Cases results of which were depicted in Fig. 3(a-c). In Col. 1, various Cases are marked. In Col. 2, the compression ratio () and percentage of the total matter that is going out as outflow (see, Fig. 2) are listed. In Col. 3, we show the total number of photons (out of the total injection of ) intercepted by the CENBOL and jet () combined. Column 4 gives the number of photons () that have suffered Compton scattering inside the flow. Columns 5, 6 and 7 show the number of scatterings which took place in the CENBOL (), in the jet () and in the pre-shock sub-Keplerian halo () respectively. A comparison of them will give the relative importance of these three sub-components of the sub-Keplerian disk. The number of photons captured () by the black hole is given in Col. 8. In Col. 9, we give the percentage of the total injected photons that have suffered scattering through CENBOL and the jet. In Col. 10, we present the energy spectral index () obtained from our simulations.
| Table 2 | ||||||||
|---|---|---|---|---|---|---|---|---|
| Case | , | |||||||
| 2a | 0.5, 1.5 | 1.08E+06 | 2.13E+08 | 7.41E+05 | 3.13E+08 | 1.66E+05 | 33.34 | -0.09, 0.4 |
| 2b | 1.0, 1.5 | 1.22E+06 | 3.37E+08 | 1.01E+06 | 6.82E+08 | 2.03E+05 | 52.72 | -0.13, 0.75 |
| 2c | 1.5, 1.5 | 1.34E+06 | 4.15E+08 | 1.26E+06 | 1.11E+09 | 2.29E+05 | 64.87 | -0.13, 1.3 |
In Table 2, we summarize the results of simulations where we have varied , for a fixed value of . In all of these cases no jet comes out of the CENBOL (i.e., ). In the last column, we listed two spectral slopes (from to keV) and (due to the bulk motion Comptonization). Here, represents the photons that have suffered scattering between and the horizon of the black hole.
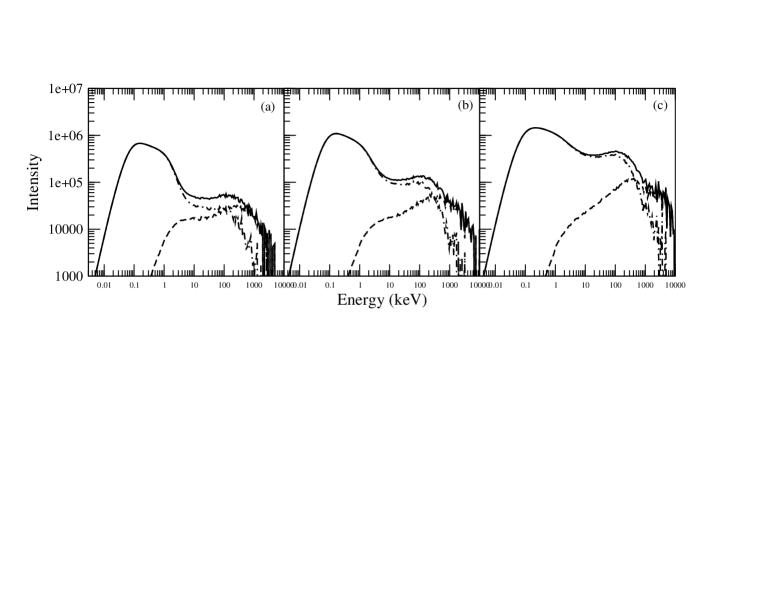
In Fig. 5, we show the variation of the spectrum in the three simulations presented in Fig. 3(a-c). The dashed, dash-dotted and doubledot-dashed lines are for (Case 1a), (Case 1b) and (Case 1c) respectively. The solid curve gives the spectrum of the injected photons. Since the density, velocity and temperature profiles of the pre-shock, sub-Keplerian region and the Keplerian flow are the same in all these cases, we find that the difference in the spectrum is mainly due to the CENBOL and the jet. In the case of the strongest shock (compression ratio ), only of the total injected matter goes out as the jet. At the same time, due to the shock, the density of the post-shock region increases by a factor of . Out of the three cases, the effective density of the matter inside CENBOL is the highest and that inside the jet is the lowest in this case. Again, due to the shock, the temperature increases inside the CENBOL and hence the spectrum is the hardest. Similar effects are seen for moderate shock () and to a lesser extent, the low strength shock () also. When , the density of the post-shock region increases by the factor of while almost of total injected matter (Fig. 2) goes out as the jet reducing the matter density of the CENBOL significantly. From Table 1 we find that the is the lowest and is the highest in this case (Case 1b). This decreases the up-scattering and increases the down-scattering of the photons. This explains why the spectrum is the softest in this case. In the case of low strength shock (), of the inflowing matter goes out as jet, but due to the shock the density increases by factor of in the post-shock region. This makes the density similar to a non-shock case as far as the density is concerned, but with a little higher temperature of the CENBOL due to the shock. So the spectrum with the shock would be harder than when the shock is not present. The disk and the halo accretion rates used for these cases are and .
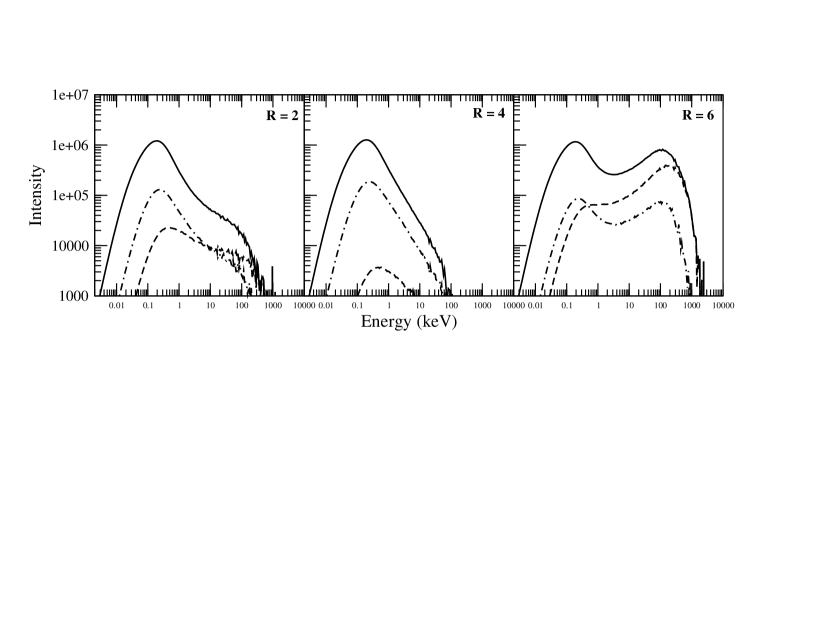
In Fig. 6, we show the components of the emerging spectrum for all the three cases presented in Fig. 5. The solid curve is the intensity of all the photons which suffered at least one scattering. The dashed curve corresponds to the photons emerging from the CENBOL region and the dash-dotted curve is for the photons coming out of the jet region. We find that the spectrum from the jet region is softer than the spectrum from the CENBOL. As increases and decreases, the spectrum from the jet becomes softer because of two reasons. First, the temperature of the jet is lesser than that of the CENBOL, so the photons get lesser amount of energy from thermal Comptonization making the spectrum softer. Second, the photons are down-scattered by the outflowing jet which eventually make the spectrum softer. We note that a larger number of photons are present in the spectrum from the jet than the spectrum from the CENBOL, which shows the photons have actually been down-scattered. The effect of down-scattering is larger when . For also there is significant amount of down scattered photons. But this number is very small for the case as is much larger than so most of the photons get up-scattered. The difference between total (solid) and the sum of the other two regions gives an idea of the contribution from the sub-Keplerian halo located in the pre-shock region. In our choice of geometry (half angles of the disk and the jet), the contribution of the pre-shock flow is significant. In general it could be much less. This is especially true when the CENBOL is farther out.
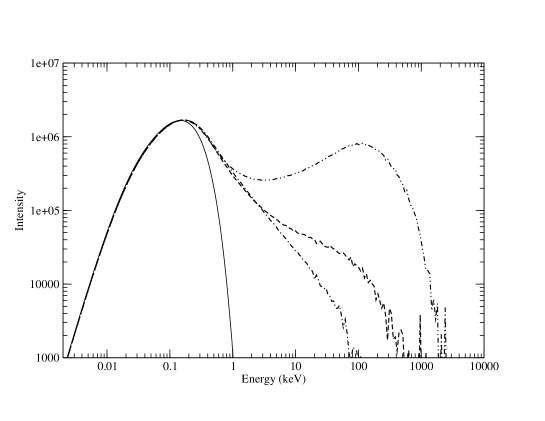
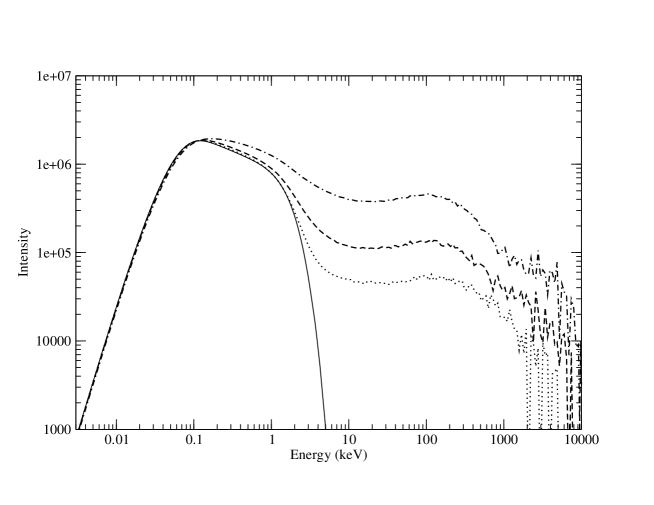
In Fig. 7, the emerging spectra due to the bulk motion Comptonization when the halo rate is varied. The solid curve is the injected spectrum (modified black body). The dotted, dashed, and dash-dotted curves are for and respectively. for all the cases. The Keplerian disk extends up to . Table 2 summarizes the parameter used and the results of the simulation. As the halo rate increases, the density of the CENBOL also increases causing a larger number of scattering. From Fig. 4a, we noticed that the bulk velocity variation of the electron cloud is the same for all the four cases. Hence, the case where the density is maximum, the photons got energized to a very high value due to repeated scatterings with that high velocity cold matter. As a result, there is a hump in the spectrum around 100 keV energy for all the cases. We find the signature of two power-law regions in the higher energy part of the spectrum. The spectral indices are given in Table 2. It is to be noted that increases with and becomes softer for high . Our geometry here at the inner edge is conical which is more realistic, unlike a sphere (perhaps nonphysically so) in Laurent & Titarchuk (2001). This may be the reason why our slope is not the same as in Laurent & Titarchuk (2001) where . In Fig. 8, we present the components of the emerging spectra. As in Fig. 6, solid curves are the spectra of all the photons that have suffered scattering. The dashed and dash-dotted curves are the spectra of photons emitted from inside and outside of the marginally stable orbit () respectively. The photons from inside the marginally stable radius are Comptonized by the bulk motion of the converging infalling matter and produces the power-law tail whose spectral index is given by (Table 2).
4 Concluding remarks
In this paper, we extended the results of our previous work on Monte-Carlo simulations (Paper I). We included the outflow in conjunction with the inflow. The outflow rate was self-consistently computed from the inflow rate using well-known considerations present in the literature (Das et al. 2001 and references therein). We compute the effects of the thermal and the bulk motion Comptonization on the soft photons emitted from a Keplerian disk around a black hole by the post-shock region of a sub-Keplerian flow which surrounds the Keplerian disk. A shock in the inflow increases the CENBOL temperature, increases the electron number density and reduces the bulk velocity. Thermal Comptonization and bulk motion Comptonization inside the CENBOL increases photon energy. However, the CENBOL also generates the outflow of matter which down-scatters the photons to lower energy. We show that the thermal Comptonization and the bulk motion Comptonization were possible by both the accretion and the outflows. While the converging flow up-scatters the radiation, the outflow down-scatters. However, the net effect is not simple. The outflow parameters are strongly coupled to the inflow parameters and thus for a given inflow and outflow geometry, the strength of the shock can also determine whether the net scattering by the jets would be significant or not. Sometimes the spectrum may become very complex with two power-law indices, one from thermal and the other from the bulk motion Comptonization. Since the volume of the jet may be larger than that of the CENBOL, sometimes the number of scatterings suffered by softer photons from the electrons in the jet may be high. However, whether the CENBOL or the jet emerging from it will dominate in shaping the spectrum strongly depends on the geometry of the flow and the strength of the shock. We also found that the halo can Comptonize and harden the spectrum even without the CENBOL.
Acknowledgments
The work of HG is supported by a RESPOND project.
References
- [1] H. Bondi, MNRAS, 112 (1952) 195.
- [2] S. K. Chakrabarti, Astrophys. J. 347 (1989) 365.
- [3] S. K. Chakrabarti, Theory of Transonic Astrophysical Flows (World Scientific: Singapore, 1990).
- [4] S. K. Chakrabarti, Astrophys. J. 484 (1997) 313.
- [5] S. K. Chakrabarti, Astron. Astrophys. 351 (1999) 185.
- [6] S. K. Chakrabarti, L. Jin and W. D. Arnett, Astrophys. J. 313 (1987) 674.
- [7] S. K. Chakrabarti and S. Mandal, Astrophys. J. 642 (2006) L49.
- [8] S. K. Chakrabarti and L. G. Titarchuk, Astrophys. J. 455 (1995) 623.
- [9] S. K. Chakrabarti, L. G. Titarchuk, D. Kazanas and K. Ebisawa, Astron. Astrophys. Suppl. Ser. 120 (1996) 163.
- [10] T. K. Das and S. K. Chakrabarti, Classical and Quantum Gravity 16 (1999) 3879.
- [11] S. Das, I. Chattopadhyay, A. Nandi and S. K. Chakrabarti, Astron. Astrophys. 379 (2001) 683.
- [12] H. Ghosh, S. K. Chakrabarti and P. Laurent, Int. J. Mod. Phys. 18 (2009) 1693.
- [13] J. M. Hua and L. G. Titarchuk, Astrophys. J. 469 (1996) 280.
- [14] P. Laurent and L. G. Titarchuk, Astrophys. J. 511 (1999) 289.
- [15] P. Laurent and L. G. Titarchuk, Astrophys. J. 562 (2001) 67.
- [16] P. Laurent and L. Titarchuk, Astrophys. J. 656 (2007) 1056.
- [17] D. Molteni, G. Lanzafame and S. K. Chakrabarti, Astrophys. J. 425 (1994) 161.
- [18] D. Molteni, D. Ryu and S. K. Chakrabarti, Astrophys. J. 470 (1996) 460.
- [19] I. Novikov and K. S. Thorne, in Black Holes, eds. C. DeWitt and B. DeWitt (Gordon and Breach, New York, 1973), p. 343.
- [20] E. N. Parker, Astrophys. J. 129 (1959) 217.
- [21] L. A. Pozdnyakov, I. M. Sobol and R. A. Sunyaev, Astrophys. Space Sci. Rev. 2 (1983) 189.
- [22] B. Paczyński and P. J. Wiita, Astron. Astrophys. 88 (1980) 23.
- [23] M. J. Rees, M. C. Begelman, R. D. Blandford and E. S. Phinney, Nature 295 (1982) 17.
- [24] G. Rybicki and A. P. Lightman, Radiative Processes in Astrophysics (Wiley Interscience, New York, 1979).
- [25] N. I. Shakura and R. A. Sunyaev, Astron. Astrophys. 24 (1973) 337.
- [26] S. L. Shapiro and S. A. Teukolsky, Black Holes, White Dwarfs and Neutron Stars: The Physics of Compact Objects (John Wiley and Sons, New York, 1983).
- [27] R. A. Sunyaev and L. G. Titarchuk, Astron. Astrophys. 143 (1985) 374.
- [28] R. A. Sunyaev and L. G. Titarchuk, Astron. Astrophys. 86 (1980) 121.
- [29] L. Titarchuk, Astrophys. J. 434 (1994) 570.