Imaging nonequilibrium atomic vibrations with x-ray diffuse scattering
pacs:
For over a century, x-ray scattering has been the most powerful tool for determining the equilibrium structure of crystalline materials. Deviations from perfect periodicity, for example due to thermal motion of the atoms, reduces the intensity of the Bragg peaks as well as produces structure in the diffuse scattering background James (1954); Warren (1969). Analysis of the thermal diffuse scattering (TDS) had been used to determine interatomic force constants and phonon dispersion in relatively simple cases Joynson (1954); Jacobsen (1955); Cole (1953); Cole and Warren (1952) before inelastic neutron scattering became the preferred technique to study lattice dynamics Brockhouse and Stewart (1955). With the advent of intense synchrotron x-ray sources, there was a renewed interest in TDS for measuring phonon dispersion M. Holt et al. (1999). The relatively short x-ray pulses emanating from these sources also enables the measurement of phonon dynamics in the time domain. Prior experiments on nonequilibrium phonons were either limited by time-resolution McWhan et al. (1982); Chapman et al. (1984) and/or to relatively long wavelength excitations LeRoux et al. (1975); Reis and Lindenberg (2007); Trigo and Reis (2010). Here we present the first images of nonequilibrium phonons throughout the Brillouin zone in photoexcited III-V semiconductors, indium-phosphide (InP) and indium-antimonide (InSb), using picosecond time-resolved diffuse scattering. In each case, we find that the lattice remain out of equilibrium for several hundred picoseconds up to nanoseconds after laser excitation. The non-equilibrium population is dominated by transverse acoustic phonons which in InP are directed along high-symmetry directions. The results have wide implications for the detailed study of electron-phonon and phonon-phonon coupling in solids.
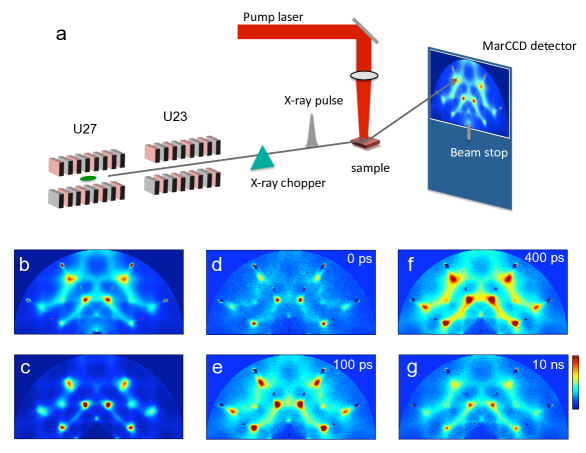
Experiments were performed at the BioCARS beamline of the Advanced Photon Source at Argonne National Laboratory. A dual undulator setup provided an x-ray photon flux at the sample of photons/pulse with photon energy of keV in a bandwidth. Single ps x-ray pulses were isolated by a high-speed chopper at a rate of Hz. A Ti:sapphire regenerative amplifier synchronized to the accelerator RF pumped an optical parametric amplifier to produce visible pulses ps in duration. The pulse energy at the sample was J focused on a mm spot. The samples were single crystals of InP and InSb with the direction perpendicular to the wafer surface. The crystals were oriented at grazing incidence so that the x-rays were incident primarily along the direction. Typical incidence angles of were used to match the laser excitation depth with the volume probed by the x-rays. A large area detector (MarCCD 165 mm diameter) placed mm behind the sample collects the x-rays with scattering angles of up to . In choosing the x-ray energy and crystal orientation, special care was taken to avoid Bragg reflections on the detector.
Figure 1 (b) shows a static TDS pattern from InP at room temperature taken with keV x-ray photons. The upper half of the image is shown, the lower half being blocked by the sample. The large area detector captures a solid angle of the Ewald sphere in reciprocal space projected onto a plane. Each pixel has associated a different scattering vector that depends on the x-ray energy and the sample-detector distance. The intensity pattern originates primarily from (inelastic) scattering from thermally activated phonons and shows structure that reflects the details of the phonon dispersion in the material and the phonon population at a given temperature Ruqing Xu and Tai C. Chiang (2005).
Ultrafast laser excitation of the material initially produces a non-equilibrium state where phonons may not be populated according to the Bose factor. This transient state eventually leads to a new equilibrium where the lattice is left at a higher temperature. These perturbations of the phonon population modify the equilibrium diffuse scattering pattern shown in Fig. 1 (b). As a function of laser-x-ray delay, , we record a frame with laser exposure, , and a dark frame, . Figures 1 show the change in the image upon laser excitation for several representative time delays [i.e. ]. Each data frame is obtained by averaging 100 individual images with 100 single-pulse exposures per image. Initially, the areas near the zone-centers brighten at ps (d) while the scattering keeps increasing several hundred ps after excitation (e) and (f), before decreasing after a few ns (g), eventually returning to equilibrium. The laser and x-rays are coincident at ps (d), however the initial increase in scattering takes ps to develop (e).
We consider the intensity of one-phonon thermal diffuse scattering given byRuqing Xu and Tai C. Chiang (2005)
| (1) |
where is the frequency of the phonon mode in branch with reduced wavevector , is the phonon population and is given by
| (2) |
In this expression, , , are the atomic scattering factor, the mass, and the Debye-Waller factor J. F. Vetelino et al. (1972) of atom at position , is the phonon polarization vector, and is the closest reciprocal lattice vector to , i.e. . In Eq. (1) we omitted additional slowly varying factors from the polarization dependence of the scattering as well as geometrical factors Ruqing Xu and Tai C. Chiang (2005).
In thermal equilibrium, , which, for the low frequency limit gives . This multiplied by the factor in Eq. (1) gives a strong contribution from acoustic modes near the center of the Brillouin zone where their frequency goes to zero. These low-frequency phonons give rise to the four brightest diffuse spots in Fig. 1 (b). Directions in reciprocal space where the dispersion relation is soft appear in Fig. 1 (b) as bright lines connecting the near-zone-center spots. The quantity in Eq. (2) has the form of a structure factor modified by the dot product , which selects phonon modes polarized along the scattering vector. A slight deviation from the four-fold symmetry of the crystal is expected between the vertical and horizontal directions due to the horizontally polarized x-rays. The eight small spots of a few pixels in diameter in Fig. 1 (b) are crystal surface truncation rods which appear due to the grazing incidence geometry and are well known from surface diffraction Robinson (1986).
Equations (1) and (2) can be used to compute the TDS if the phonon frequencies and eigenvectors are known. The inverse problem, i.e. obtaining and from can be done model-free only in simple cases Alexei Bosak and Dmitry Chernyshov (2008). To gain insight on the different phonon contributions we implemented a Born-von Kármán model of the lattice dynamics with force constants up to six nearest neighborsT. Soma and H. Matsuo Kagaya (1983); H.-M. Kagaya and T. Soma (1984). InP and InSb crystallize in the zincblende structure with two atoms per unit cell. Six phonon branches and eigen-displacements, three acoustic and three optical, are obtained. This model ignores the ionic component of the forces and thus does not reproduce the phonon dispersion with all detail, particularly it does not give a splitting of the LO and TO phonons at zone-center. However the insight gained is extremely valuable for understanding the static diffuse images particularly in separating the contributions from transverse (TA) and longitudinal (LA) acoustic phonons. Figure 1 (c) shows a calculated TDS intensity pattern using this force constant model. This calculation agrees well with the static measurements and reproduces the main features. More importantly, as we show later, it proves useful in understanding the time-resolved data.
To separate the different time-scales we performed singular value decomposition (SVD) of the time-resolved data. This method has been applied successfully to a wide set of problems from small angle scattering Shigeru Okamoto and Shinichi Sakurai (2003) and the analysis of spectroscopic data Eric R. Henry (1997) to time-resolved Laue diffraction of protein crystals Marius Schmidt et al. (2002). The procedure is as follows. We write each difference frame as a column vector and construct the matrix whose columns are the vectors . Thus, adjacent columns of correspond to consecutive frames in the time-delay series. The SVD states that , where is the diagonal matrix of singular values with , and and are orthogonal matrices whose columns, and , are the left and right singular vectors, respectively. The vectors represent time-independent “populations”, and form a complete orthonormal basis. The vectors contain the time-dependent information of each of the populations and also form an orthonormal basis. The singular values act as weight factors for these vectors and represent the amount of “signal” contained in each singular vector in the reconstructed data.
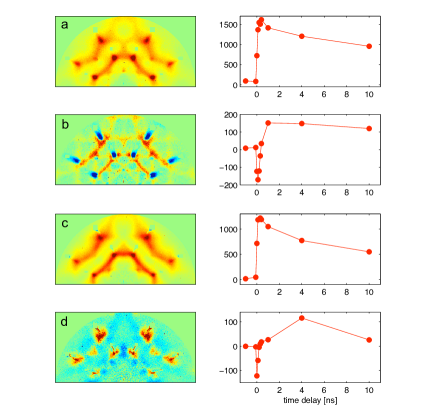
In Fig. 2 we summarize the results of the SVD analysis for both InP [(a) and (b)] and InSb [(c) and (d)]. The truncation rods were masked out to avoid artifacts from saturated pixels. Due to the larger lattice constant, the data for InSb were taken at keV to match the same reciprocal space covererage on the detector as InP at keV. On the left we show the (time-independent) left singular vectors (lSV) for the two most significant singular values (SV) with the corresponding (time-dependent) right singular vectors (rSV) scaled by the corresponding SV on the right. For both materials, much of the signal is contained in the first SV [Fig. 2 (a) and (c)], the time dependence of which consists of a sharp increase in the diffuse scattering that decays in few ns time scale (Fig. 2 (a) and (c) right panels). It is worth noting here the clear differences between InP and InSb, particularly the lack of scattering intensity in InSb near the top center of the first lSV in Fig. 2 (c), which is also present in the dark frame (not shown). This is due to the small structure factor for the (204) reflection in InSb, which is not small in InP due to the large difference in the atomic scattering factors. The shape of the image from this lSV resembles the equilibrium image, which suggests this lSV corresponds to lattice heating and diffusion that decays within a time-scale of few ns.
The second singular vectors however show a more complex behavior both in reciprocal space as well as in the time domain. In the case of InP, the lSV [Fig. 2 (b) (left)] shows sharp bright and dark areas indicating that parts of the image brighten while other areas decrease their scattering. The fact that the rSV [Fig. 2 (b) (right)] peaks at ps means that the image on the left continues increasing after the initial excitation which indicates that non-equilibrium transient dynamics lead to a delayed heating and cooling of different parts of the Brillouin-zone. The same delayed behavior is observed in InSb as seen in Fig. 2 (d) (right), which shows a peak at ns. We attribute this behavior to relaxation of non-equilibrium phonon populations. However, note that from the way the population and frequency enter in Eq. (1), it is difficult to distinguish a population increase from a softening of the phonon frequencies.
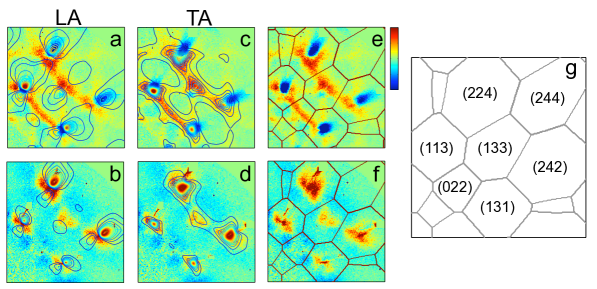
Although the (equilibrium) TDS distributions for InP and InSb are similar, as well as the first singular vector in Fig. 2 (a) and (c), which reflects similarities in the phonon dispersion, the difference in the second lSV is quite remarkable and cannot be explained by differences in the equilibrium phonon dispersion alone. It is instructive to separate the contribution from different phonon branches to the diffuse scattering. Each phonon branch contributes one term to Eq. (1), which we compute using the Born-von Kármán model described above. The top and bottom rows of Fig. 3 show a zoomed view of the second lSV in Fig. 2 (b) and (d), respectively. Superimposed, we show contour plots that represent the calculated contribution to Eq. (1) from the LA [(a) and (b)] and the TA [(c) and (d)] branches separately. As stated earlier, the largest contribution to the scattering comes from areas that are close to the center of the Brillouin-zone, where the contours lines are denser. This is further confirmed by superimposing the images with the corresponding Brillouin-zone boundaries as shown in (e) and (f).
From Fig. 3 we see that in InP the areas with strong contribution from TA phonons [Fig. 3 (c)] appear bright in the lSV, while areas with more contribution from the LA branch [Fig. 3 (a)] are dark. This lSV has the time-dependence shown in the right panel of Fig. 2 (b), which means that even at time-delays ps TA phonons are still populating while the LA branch decreases. In InSb the situation is different. The LA branch shows no appreciable decrease in scattering above the noise level [Fig. 3 (b)], while the TA branches populate delayed [Fig. 3 (d)]. To further identify which phonon modes are involved within the Brillouin-zone, we sketch in Fig. 3 (g) the Miller indices of selected Brillouin-zones for InSb at keV. Note that at this energy the number and size of Brillouin zones covered by the detector in InSb is similar to InP at keV. Using the diagram in Fig. 3 (g) we can assign the InP TA phonons in Fig. 3 (c) to modes along high-symmetry and or equivalent directions. InSb on the other hand shows a less directional scattering from the TA branches, indicating that the population is distributed more isotropically within the Brillouin-zone. We attribute this difference to the large gap between the optical and acoustic modes in InP, which leads to less available phonon decay channels Debernardi (1998).
In conclusion, we have shown that time-resolved non-thermal x-ray diffuse scattering yields heretofore inaccessible information of the non-equilibrium dynamics of solids under ultrafast excitation. InP and InSb show complex non-equilibrium redistributions of the scattered intensity throughout the Brillouin-zone that are clearly separated by singular value decomposition. This non-equilibrium lattice persists up to several hundred ps. This behavior is interpreted using a Born-von Kármán model which reveals that TA phonons populate several hundred ps after initial laser excitation and, in the case of InP, is very directional and appears concomitant with a decrease in the scattering by LA phonons. In the current study, we are limited to dynamics that occur on more than 100 ps time-scale due to the x-ray pulse duration. We note that measurements of the initial emission of hot phonons by the photoexcited carriers and their subsequent anharmonic decay will become possible with new x-ray sources such as the Linac Coherent Light Source at SLAC. As these new sources of ultra-bright femtosecond x-ray pulses come online, x-ray diffuse scattering becomes a promissing approach to explore the ultrafast dynamics of solids under laser excitation at the femtosecond time-scale.
We acknowledge S. Ghimire for experimental assistance and H. Dosch and T. C. Chiang for fruitful discussions. This research is supported through the PULSE Institute at the SLAC National Accelerator Laboratory by the U.S. Department of Energy, Office of Basic Energy Sciences.
References
- James (1954) R. James, Optical Principles of the Diffraction of X-Rays (G. Bell, London, 1954).
- Warren (1969) B. E. Warren, X-Ray Diffraction (Dover, New York, 1969).
- Joynson (1954) R. E. Joynson, Phys. Rev. 94, 851 (1954).
- Jacobsen (1955) E. H. Jacobsen, Phys. Rev. 97, 654 (1955).
- Cole (1953) H. Cole, Journal of Applied Physics 24, 482 (1953).
- Cole and Warren (1952) H. Cole and B. E. Warren, Journal of Applied Physics 23, 335 (1952).
- Brockhouse and Stewart (1955) B. N. Brockhouse and A. T. Stewart, Phys. Rev. 100, 756 (1955).
- M. Holt et al. (1999) M. Holt, Z. Wu, Hawoong Hong, P. Zschack, P. Jemian, J. Tischler, Haydn Chen, and T.-C. Chiang, Phys. Rev. Lett. 83, 3317 (1999).
- McWhan et al. (1982) D. B. McWhan, P. Hu, M. A. Chin, and V. Narayanamurti, Phys. Rev. B 26, 4774 (1982).
- Chapman et al. (1984) L. D. Chapman, S. M. Hsieh, and R. Colella, Phys. Rev. B 30, 1094 (1984).
- LeRoux et al. (1975) S. D. LeRoux, R. Colella, and R. Bray, Phys. Rev. Lett. 35, 230 (1975).
- Reis and Lindenberg (2007) D. A. Reis and A. M. Lindenberg, in Light Scattering in Solids IX, Topics in Applied Physics, edited by M. Cardona and R. Merlin (Springer, 2007), vol. 108, pp. 371–422.
- Trigo and Reis (2010) M. Trigo and D. Reis, MRS Bulletin 35 (2010).
- Ruqing Xu and Tai C. Chiang (2005) Ruqing Xu and Tai C. Chiang, Z. Kristallogr. 220, 1009 (2005).
- J. F. Vetelino et al. (1972) J. F. Vetelino, S. P. Gaur, and S. S. Mitra, Phys. Rev. B 5, 2360 (1972).
- Robinson (1986) I. K. Robinson, Phys. Rev. B 33, 3830 (1986).
- Alexei Bosak and Dmitry Chernyshov (2008) Alexei Bosak and Dmitry Chernyshov, Acta Cryst. A64, 598 (2008).
- T. Soma and H. Matsuo Kagaya (1983) T. Soma and H. Matsuo Kagaya, phys. stat. sol. (b) 118, 245 (1983).
- H.-M. Kagaya and T. Soma (1984) H.-M. Kagaya and T. Soma, phys. stat. sol. (b) 121, K113 (1984).
- Shigeru Okamoto and Shinichi Sakurai (2003) Shigeru Okamoto and Shinichi Sakurai, Journal of Applied Crystallography 36, 982 (2003).
- Eric R. Henry (1997) Eric R. Henry, Biophysics Journal 72, 652 (1997).
- Marius Schmidt et al. (2002) Marius Schmidt, Sudarshan Rajagopal, Zhong Ren, and K. Moffat, Biophysics Journal 84, 2112 (2002).
- Debernardi (1998) A. Debernardi, Phys. Rev. B 57, 12847 (1998).