Nano-scale mechanical probing of supported lipid bilayers with atomic force microscopy
Abstract
We present theory and experiments for the force-distance curve of an atomic force microscope (AFM) tip (radius ) indenting a supported fluid bilayer (thickness ). For realistic conditions the force is dominated by the area compressibility modulus of the bilayer, and, to an excellent approximation, given by . The experimental AFM force curves from coexisting liquid ordered and liquid disordered domains in 3-component lipid bilayers are well-described by our model, and provides in agreement with literature values. The liquid ordered phase has a yield-like response that we model as due to the breaking of hydrogen bonds.
pacs:
87.16.D-, 87.16.dm, 87.80.Ek, 68.37.PsI Introduction
Atomic Force Microscopy (AFM) binnig.AFM.86 has become a standard tool for imaging surfaces at high resolution and probing local mechanical properties butt.AFM.review.05 . Force-distance curves for indentation of AFM tips have been used to characterize the mechanical properties of biological membranes connell2006atomic ; voitchovsky.afm.purplemem.06 ; costa.afm.2006 , and the usual approach is to approximate the bilayer as an elastic solid undergoing a Hertzian contact sneddon.afm.65 ; chadwick.afm.forcecurve.02 ; cheng.afm.06 . However, at physiological conditions most biological membranes are in a fluid bilayer phase lipowski.mem.rev.91 , whose free energy is described by a bending modulus and the area compressibility modulus . These are experimentally accessible through, for example, micropipette aspiration experiments evans.micropipet.90 , which give the average value of the elastic moduli over the whole vesicle. However, biological membranes often have different local compositions, and thus different local mechanical properties and physiological functions.
Despite the growing use of AFM to study lipid bilayers, the flexibility of using it to measure local mechanical properties has not been fully exploited. An AFM tip can bend a freely suspended membrane, and compress a supported membrane. In recent work, Steltenkamp et al. steltenkamp06 showed how to extract the bending modulus of lipid bilayers from AFM force-distance curves for bilayers deposited over well defined sized holes (indentation of ‘nanodrums’), in which they could safely ignore area compression due to the lack of a supported surface. Another issue neglected in previous AFM studies is the double leaflet form of lipid bilayers, which is known to influence the dynamics of fluctuations seifert.memfluc.93 . Since an AFM tip induces an asymmetric response in a supported bilayer XingSM2009 , the distinction between the two leaflets will be important to accurately model the mechanical response.
In this paper we consider the force-distance curves obtained by indenting an AFM tip into a fluid bilayer supported on a solid substrate. The force-distance curves are calculated from a static analysis of the deformation of the two leaflets and differs from usual Hertzian result of the deformation of elastic bodies. We analyze experiments on a dioleoyl-phosphatidylcholine (DOPC) - egg sphingomyelin (SM) - cholesterol (CHOL) phase separated supported bilayer, which is a model mixture representative of typical in vivo membranes veatch.ternary.05 . For certain composition ratios of the components, this system spontaneously phase separates into coexisting liquid ordered (Lo, rich in SM and relatively thick because of strong nematic order in the acyl tails) and liquid disordered (Ld, rich is DOPC and relatively thin because of the more disordered tails) phases. We show how to determine the area compressibility moduli of the coexisting Lo and Ld phases of a single sample, and find values in agreement with literature values. To the best of our knowledge, this is the first time that the area compressibilities of the two coexisting compositions in fluid bilayers have been extracted directly. This technique should prove invaluable for studying the composition dependence of mechanical properties in lipid bilayers, and can be easily extended to consider more complex interactions between AFM tip and the bilayer.
II Theory
We consider a supported fluid lipid bilayer of thickness probed by an AFM tip of radius in contact mode, which measures the force as a function of the depth from the unperturbed surface of the layer (see Fig. 1(a)). At typical AFM speeds the viscous forces are negligible. We begin by assuming a hard contact interaction between the tip and the membrane. Electrostatic repulsion from the charged double layers and van der Waals attraction are included later in the paper when comparisons are made with experiments. Since the lipid bilayer is not anchored it remains tension free. We assume that the volume is conserved at the molecular level: as the tip penetrates the bilayer it occupies a volume , so that lipids are expelled into the surrounding bilayer. Here, is the area per lipid in the absence of the AFM tip. The surface area increases by , due to the curved spherical surface of the AFM tip, and the increase in area per head group is given by
| (1) |
This increased area induces an elastic cost due to the stretching elasticity of the lipid leaflets. We calculate this not by averaging over the entire spherical cap, but by considering small increases in radius , and evaluating at each (Fig. 1).
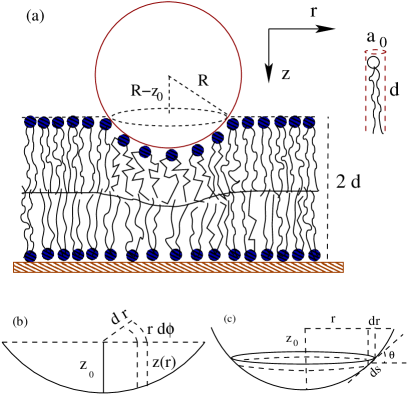
We assume that both leaflets have the same area per lipid and stretching modulus for lipid head groups on a flat surface. This should be valid in the absence of specific interaction of the lipid with the substrate, although experiments have shown that the surface often does have specific interactions XingSM2009 . The head groups in the top leaflet are forced to lie on a curved surface below the AFM tip. This affects both the area/lipid, and the stretching modulus for the lipids on the top leaflet. We model the local lipid free energy as a sum of a surface energy and a harmonic tail stretching, , where is a surface tension, penalizes tail stretching, and is the projected area for leaflet thickness . Here, (Fig. 1c) is the tilt angle of the lipid surface. Minimizing at fixed lipid volume leads to an effective stretching modulus and an effective area per lipid for the top leaflet.
Using the modifications due to the curved surface for the head-groups in the top leaflet, the excess free energy due to the increase in the area per lipid during indentation is
| (2) |
where and refers to the top and bottom leaflets and the integration extends over both leaflets. The lower leaflet will generally deform to accommodate the large energy change due to removing too many lipids from the upper leaflet. We let the lower and upper leaflets have thicknesses and respectively, with . The area changes at each radius are given by (Fig. 1)
| (3a) | |||||
| (3b) | |||||
The measure is . The dividing surface is determined by minimizing the free energy at each . For equal stretching moduli in both leaflets, an explicit solution for is possible for small tilt angle,
| (4) |
For realistic values nm, nm and nm, this approximation introduces less than error in for the entire range of . We use this approximation in the rest of the paper to derive analytic expressions for the free energy and force.
Using from Eq. 4, the free energy is
| (5) |
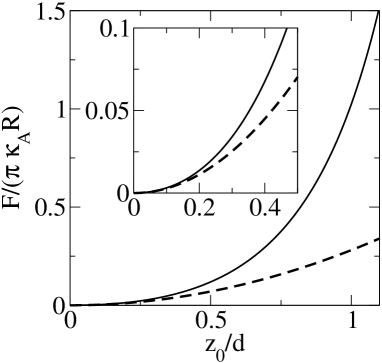
and the force on the AFM tip is given by . We use the numerical force derived from Eq. 2 when performing fits to the data. For small penetrations the force can be written as
| (6) |
A surprisingly simple function that fits the entire experimental range of forces, correct to within a few percent for and much better for larger , is
| (7) |
The force diverges as approaches because the area/lipid diverges in order to preserve molecular volume. The quadratic free energy (Eq. 2) is no longer valid there. Experimentally this divergence is preempted by pore formation (see below).
For comparison, the contact force between two solid (elastic) bodies much larger than the radius of contact (Hertzian contact) is landau.elasticity . More relevant for AFM experiments, the force to indent a finite elastic layer scales as if the layer is bonded to the substrate and if the layer can slip chadwick.afm.forcecurve.02 . The response of fluid bilayers in eqn. 6 scales differently than all of these scenarios, and force is proportional to the area compressibility modulus instead of the Young’s modulus. For realistic experimental values the region of validity for this quadratic behavior is limited, as shown in Fig. 2(b).
III Experiments
To test the theory we performed experiments on a supported bilayer comprising DOPC, SM and CHOL at overall molar ratios DOPC:SM:CHOL=40:40:20. At room temperature this system phase separates into coexisting DOPC-rich liquid disordered and SM-rich liquid ordered domains (Fig. 3). The hydrocarbon tails have large nematic order in the Lo phase, leading to a thicker bilayer and higher area compressibility modulus. In contrast, the tails have lower nematic order in the Ld phase with concomitant smaller thickness and lower moduli. DOPC, CHOL (purchased from Sigma) and egg SM (purchased from Avanti) were dissolved in chloroform, dried under a stream of argon for 30 minutes, and then vacuum desiccated for 30 minutes. The lipid was resuspended in PBS buffer at pH 7.4 to a concentration of 1 mg/ml by vortexing. To make small single unilamellar vesicles (SUVs), the cloudy lipid suspension was tip sonicated (IKA, U50) at less than for 25 mins (until the solution became clear). The mica (Agar Scientific Ltd.) surface was incubated with the SUVs at at 50∘ C and cooled down to room temperature in a incubator over 15 minutes. After 1h, the sample was gently rinsed with PBS buffer to remove any excess vesicles.
Force measurements were performed at in PBS buffer using a Nanoscope IV Mulitmode AFM (Veeco) equipped with a temperature control stage, using cantilevers (NP, Veeco) with nominal spring constants of 0.12 N/m. Spring constants were measured using the thermal noise method hutter.afmex.93 in air, and optical lever sensitivity determined against a clean mica surface.The force curves analysed in this paper were all taken from a single force-volume map of the phase separated bilayer shown in Figure. 4, and exported using Nanscope software v5.12r30.
Scanning electron microscopy (Camscan series III, FEG-SEM operating at 5 kV with magnification 160k) was used to measure the tip radius. Inset of Fig. 4 shows the tip image with dashed lines along the edges of the four pyramidal faces. The end of the tip can be approximated as spherical. The drawn circle (Fig. 4 inset) has a radius of 10 nm. The contrast of the image is poor. Consequently the uncertainty of the exact value of the radius is large. In our analysis we consider the tip radius to be .
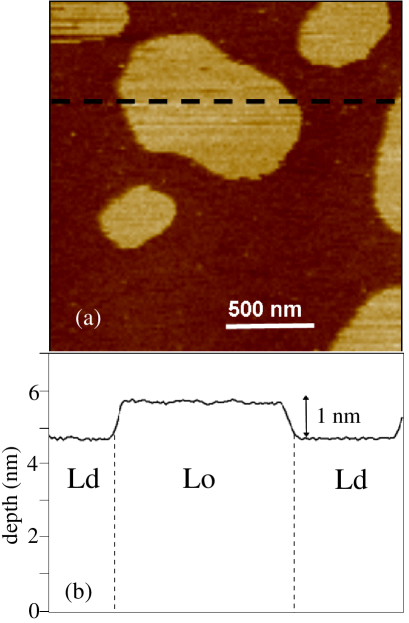
Fig. 3 shows a tapping mode image of the bilayer along with a one dimensional cross section. There is a thick Ld matrix enclosing thick Lo domains (The heights reported here include the thickness of any water layer between the bilayer and the mica surface). The composition of the two phases were determined by following the tie lines on the ternary phase diagram, which were calculated using Atomic Force Microscopy simon.ternary.08 :
| (8a) | |||||
| (8b) | |||||
Phase diagrams on similar ternary mixtures have been calculated using NMR, and the compositions of the liquid-disordered and liquid ordered phases are similar veatch06 . The uncertainty in the compositions from placement of the tie lines is estimated to be less than 2% of the quoted values. For both Lo and Ld phases, force curves from contact mode AFM were used from at least 10 different measurements from different points within different regions (‘patches’, as in Fig. 3) of the sample.
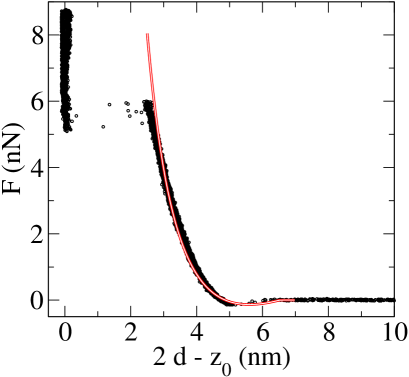
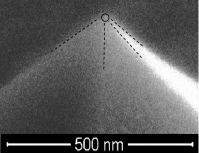
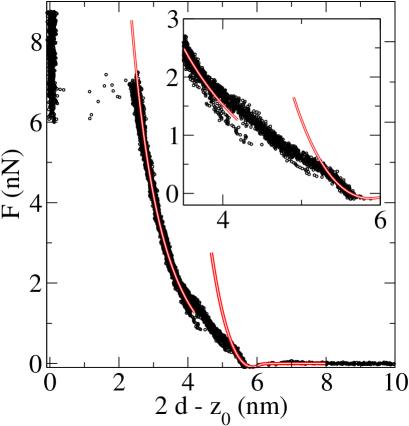
Fig. 4 (symbols) shows the force curve for the DOPC rich bilayer in the liquid disordered phase. Besides the stretching contribution considered so far, the tip experiences an attractive force due to van der Waals interaction and a short range repulsive force due to the electric double layers on the tip surface and the membrane top surface. In principle the van der Waals interaction can be calculated from a knowledge of the dielectric constants of the tip, membrane, and the PBS buffer israelachvili.book . Similarly, the repulsive interaction can be estimated by knowing the detailed charge distribution and solving Poisson-Boltzmann equation. Phenomenologically, we model the van der Waals attraction as an interaction energy of the form between volume elements of the tip and the membrane separated by a distance .
Since these forces are short-ranged, we consider the tip as a sphere and for the volume integration over the membrane, consider the membrane as infinitely thick. We further assume that the repulsive interaction is strong enough to avoid adsorption. As the tip approaches the bilayer, the bilayer deforms. The extent of the deformation is governed by the minimum of the stretching free energy and the long range interactions (van der Waals and screened Coulomb). We assume that the deformation can be modeled as hard interaction from a tip with radius larger than the physical tip radius . Although is poorly known and depends on the detailed dielectric properties of the membrane, its precise value only changes and controls the details of the force near contact. For deeper contact the force is overwhelmingly dominated by the stretching modulus , so that the force-distance curves yield the same , independent of .
The drawn line in Fig. 4 shows the fit from our theoretical analysis, using a downhill simplex method book.nr to minimize the mean square fractional deviation of the prediction from the experimental data over the fitted range. The best fit for the compressibility modulus for is . Because of the uncertainty in the tip radius, the range of for between and is between and , respectively. Our estimate compares well with the literature values from osmotic pressure measurements tristram-nagle.osmotic.dopc.98 and from micropipette aspiration of GUVs fa.guv.dopc.07 made of pure DOPC. Our model provides an excellent fit until , at which point the elastic energy of the deformed bilayer overcomes the cost of forming a hole butt.afm.02 and the tip abruptly penetrates the full bilayer.
IV Response of Liquid Ordered Domains
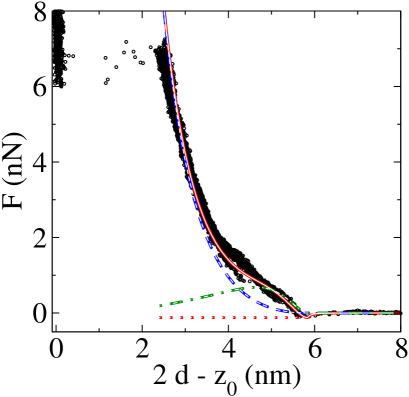
The AFM force curves for the SM rich liquid ordered phase are qualitatively different from those in the coexisting liquid disorded phase (Fig. 5). The initial deformation () shows a high modulus consistent with the tightly packed character of the Lo phase. Around the response shows a crossover to a much lower modulus. The symbols in Fig. 5 are from 12 separate force-distance measurements. While the experimental data fall on the same curves away from the crossover region, the transition from stiff to soft behavior occurs at different values of , which may be due to either the stochastic behaviour of an activated event or flucuations in composition from region to region.
We first attempt to model these force curves as due to an effective stretching modulus that differs for small and large penetrations far from the crossover region. Hence we fit the data at small penetration () and large penetration (), with effective stretching moduli according to Eq. (5). For , the small fit gives . Recent experiments on a bovine brain SM and CHOL equimolar mixture found rawicz.sm.areacomp.08 . Since egg SM (16:0 SM) has shorter fatty acid chains than does bovine SM (18:0 SM), and the current composition has comparatively smaller amounts of CHOL, we expect the membrane to be softer (smaller ), as found.
The large penetration () region has a stretching modulus , which is much closer to that of the Ld phase shown in Fig. 4 than the unperturbed Lo phase. The AFM tip forces the bilayer immediately below it to decrease in thickness, which thus destroys the strong nematic order of the Lo phase and induces a yielding or phase transition of the Lo phase into an Ld phase. It is likely that the composition of this induced Ld phase differs from that of the Ld phase that characterizes equilibrium coexistence far from the AFM tip (Eq. 8a), because of slow kinetics of composition changes under the AFM tip. Our separate fits to extract suffer from narrow available fit window () for small and the lack of small force data for the large fit. Also, this procedure does not elucidate the reason for two distinct elastic regions separated by a crossover.
To understand the qualitatively difference force responses of the Lo and Ld phases, we propose a microscopically-motivated model. SM has both hydrogen bond donor and acceptor groups and is known to form inter-SM hydrogen bonds mombelli.hbnd.03 ; rog.hbnd.06 . The free energy in the Ld phase, as represented in Eq. 2, is dominated by solvent and tail packing entropies. Hence, to describe the Lo phase we separately include the short range energy of hydrogen bond breaking through a simple Morse potential: , where is the separation between the donor and acceptor group and is the equilibrium separation. For typical hydrogen bonds the dissociation energy and the range gao.hbnd.84 ; thierry.hbnd.93 . For small changes in area/lipid and affine deformation the contribution to the free energy from distortion of hydrogen bonds is approximately
| (9) |
Here, is inter-lipid hydrogen bond dissociation energy per area and for hexagonal arrangement of the lipids. As before, the total free energy, now comprising contributions from Eqs. (5, IV), is minimized at each to find the dividing surface between the leaflets and the force is calculated from .
In the limit of small penetrations this model gives an effective stretching modulus in the Lo phase of
| (10) |
where is thus the stretching modulus of the Ld phase that is left after the Lo phase has been destabilized and there is no remaining hydrogen bond contribution. The fit to the data is shown in Fig. 6. The stochastic nature of the force curves near the rupture point (), limits the ability to obtain excellent fits. Our fit gives , and .
Assuming an area per lipid , the fitted value implies that the range of the Morse potential is . Simulations show about 0.5 hydrogen bonds per lipid in SM bilayer mombelli.hbnd.03 . Assuming an average hydrogen bond energy of , our value for give 0.4 hydrogen bonds broken per lipid. The initial deformation is dominated by the contribution from the hydrogen bonds, and the corresponding force curve leads to an area compressibility modulus .
V Discussion
We have assumed a static force response, despite typical tip velocities nm/s. We can estimate the correction due to finite tip velocity by considering the dissipation from two dimensional viscosity of the lipid layer. The dissipative force is found to be
| (11) |
The two dimensional shear viscosity for fluid bilayers is expected to be of the order of N-s/m sickert.viscosity.03 , leading to nN, much smaller than the elastic contributions. Hence our static approach is sufficient to describe the AFM force-distance curves on fluid lipid layers.
In our calculations we have assumed that the two leaflets have the same area compressibility and preferred area per head group. This may not always be the case, because of surface interactions XingSM2009 ; for example, supported bilayers often have different melting temperatures than their counterparts in giant unilamellar vesicles. Incorporation of asymmetric membranes into the model is straightforward, although more complex. We have also neglected splay or bending energies. Part of the elastic cost of this is already included in the increased area/lipid against the curved surface, in Eq. 2, but there may also be an additional negligible free energy cost due to the splay of the lipid tails, through the bending modulus of each leaflet.
In our analysis, the initial deformation for the Lo phase is described in terms of the stretching of hydrogen bonds. This can be explicitly tested by performing experiments with varying concentrations of SM or using chemicals that disrupt hydrogen bonds. However, this is beyond the scope of the present work.
Evidently, local applied pressure can melt the liquid ordered phase into the thinner Ld phase, which is not surprising. We have proposed an explicit microscopic mechanism in terms of breaking hydrogen bonds that are implicated in stabilizing Lo phase. An alternative and more general description could include a Landau theory for the free energy of the Lo-Ld phase transition, with local pressure added as an external field to destabilize the Lo phase, , where is an order parameter proportional to thickness whose value decreases upon a transformation to the Ld phase komura04 . The phase transformation would then occur first at constant composition, and then one may expect the composition to change slowly as the external force changes the local preference for the different lipid species. The subject of kinetics and composition as a function of applied pressure is interesting and important, and we leave this for further work.
In summary, we have presented, and validated by experiments, a theory for describing the force distance relationship for AFM experiments on fluid bilayers, which leads to a remarkably simple expression for , Eq. (7). This provides a method for finding the area compressibility modulus and the amount of inter-lipid hydrogen bonds of fluid bilayers. The agreement with the existing literature values for the area compressibility is excellent. The main uncertainty in our prediction is due to the uncertainty in the tip radius . However, the simple linear dependence on means that relative measurements taken with the same tip can be compared very accurately.
Acknowledgements.
The authors thank A. Ferrante, R. Marriot, M. Noro and B. Stidder for useful discussions. This work was supported by Yorkshire Forward through the grant YFRID Award B/302. CD acknowledges SoftComp EU Network of Excellence for financial support.References
- (1) G. Binnig, C. F. Quate, and C. Gerber, Phys. Rev. Lett. 56, 930 (1986).
- (2) H.-J. Butt, B. Cappella, and M. Kappl, Surface Science Reports 59, 1 (2005).
- (3) S. D. Connell and D. A. Smith, Mol. Memb. Biol. 23, 17 (2006).
- (4) K. Vo itchovsky, S. A. Contera, M. Kamihira, A. Watts, and J. F. Ryan, Biophys. J. 90, 2075 (2006).
- (5) K. D. Costa, A. J. Sim, and F. C. Yin, J. Biomech. Eng. Trans. ASME 128, 176 (2006).
- (6) I. N. Sneddon, Internat. J. Engin. Sci. 3, 47 (1965).
- (7) R. S. Chadwick, SIAM J. Appl. Math. 62, 1520 (2002).
- (8) Y. T. Cheng, W. Ni, and C.-M. Cheng, Phys. Rev. Lett. 97, 075506 (2006).
- (9) R. Lipowsky, Nature 349, 475 (1991).
- (10) E. Evans and W. Rawicz, Phys. Rev. Lett. 64, 2094 (1990).
- (11) S. Steltenkamp, M. M. M uller, M. Deserno, C. Hennesthal, C. Steinem, and A. Janshoff, Biophys. J. 91, 217 (2006).
- (12) U. Seifert and S. A. Langer, Europhys. Lett. 23, 71 (1993).
- (13) C. Xing, O. H. S. Ollila, I. Vattulainen, and R. Faller, Soft Matter 5, 3258 (2009).
- (14) S. L. Veatch and S. L. Keller, Phys. Rev. Lett. 94, 148101 (2005).
- (15) L. Landau and E. Lifshitz, Theory of elasticity (Butterworth-Heinemann, Oxford, 1986), p. 26, 3rd ed.
- (16) J. Hutter and J. Bechhoefer, Rev. Sci. Instrum. 64, 3342 (1993).
- (17) S. D. Connell, G. Li, P. D. Olmsted, N. M. Hooper, and D. A. Smith (2010), to be published.
- (18) S. L. Veatch, K. Gawrisch, and S. L. Keller, Biophys. J. 90, 4428 (2006).
- (19) J. Israelachvili, Intermolecular and surface forces (Academic Press, New York, 1992), 2nd ed.
- (20) W. H. Press, S. A. Teukolsky, W. T. Vetterling, and B. Flannery, Numerical Recipes (Cambridge university press, Cambridge, 1992), 2nd ed.
- (21) S. Tristram-Nagle, H. I. Petrache, and J. F. Nagle, Biophys. J. 75, 917 (1998).
- (22) N. Fa, L. Lins, P. Courtoy, Y. Dufrêne, P. van Der Smissen, R. Brasseur, D. Tyteca, and M.-P. Mingeot-Leclercq, BBA-Biomem 1768, 1830 (2007).
- (23) H.-J. Butt and V. Franz, Phys. Rev. E 66, 031601 (2002).
- (24) W. Rawicz, B. A. Smith, T. J. McIntosh, S. A. Simon, and E. Evans, Biophys. J. 94, 4725 (2008).
- (25) E. Mombelli, R. Morris, W. Taylor, and F. Fraternali, Biophys. J. 84, 1507 (2003).
- (26) T. Róg and M. Pasenkiewicz-Gierula, Biophys. J. 91, 3756 (2003).
- (27) Y. Gao, K. V. Devi-Prasad, and E. W. Prohofsky, J. Chem. Phys. 80, 6291 (1984).
- (28) D. Thierry, M. Peyrard, and A. R. Bishop, Phys. Rev. E 47, 684 (1993).
- (29) M. Sickert and F. Rondelez, Phys. Rev. Lett. 90, 126104 (2003).
- (30) S. Komura, H. Shirotori, P. D. Olmsted, and D. Andelman, Europhys. Lett. 67, 321 (2004).