Numerical generation of a vortex ring cascade in quantum turbulence
Abstract
A pair of perturbed anti-parallel vortices is simulated using the three-dimensional Gross-Pitaevski equations. The simulations show decay of the vortex line length along with the depletion of local kinetic energy in a manner analogous to the decay of kinetic energy in the viscous, Navier-Stokes equations, even though the governing equations are Hamiltonian and energy conserving. The stages of development include vortex line stretching, conversion of kinetic energy into of the interaction component, the generation of vortex waves, multiple reconnections along the waves leading to the creation of vortex rings, kinetic energy transfer to high wavenumbers, evidence for energy transfer into phonons and finally the emission of the vortex rings. Some of this has been seen before, but not in a single calculation, which demonstrates the existence of a mechanism for an energy cascade that does not rely on statistical arguments. A four vortex example is given to demonstrate that these steps might be general. The wave generation and reconnection steps all depend upon interactions between distinct vortices, unlike vortex wave models where self-interactions along the vortices generate these effects. A variety of additional cases are noted whose analysis is in progress. So far, none have generated the dynamics that vortex wave models require to generate a cascade. Further cases are being pursued.
pacs:
47.37.+q,47.27.De,47.32.C-,67.25.dkI Background
Despite the absence of viscosity, experiments have repeatedly shown that superfluids exhibit resistance and depletion of turbulent kinetic energy in a manner similar to the effects of turbulence in a classical fluid. Smith et al. (1993) made this quantitative, at relatively high temperatures, by finding that the vortex line density decays at a rate consistent with the kinetic energy decay of idealized classical turbulence (Kerr, 1981). This result has since been confirmed at lower temperatures where the possibility of coupling with the more classical, normal fluid component is removed. These experiments include 3He for (Bradley et al., 2005a), where mK, and more recent measurements in 4He at K (Walmsley and Golov, 2008). Besides the similarities to decay in classical fluids, superfluid spectral measurements yield classical power laws, both for velocity (Maurer and Tabeling, 1998) and for a signature of the vortex line density (Roche et al, 2007).
Why would an inviscid, Hamiltonian system behave in this manner? Unfortunately, our understanding of classical turbulent decay is so poor that little insight is provided from that quarter. We do not even know if the equations we all believe underlie classical turbulence, the Navier-Stokes equations, are well-posed. What is observed in high resolution numerical simulations of the Navier-Stokes equations is that the stretching of finite diameter vortices is crucial, there is a energy spectrum consistent with experiments and ultimately the kinetic energy is converted into heat by viscous dissipation. Most theories explaining the cascade are statistical and are not based directly upon either the Navier-Stokes equations, or the vorticity equation.
In this paper, a series of steps towards a quantum turbulent state with local kinetic energy depletion will be demonstrated in relatively modest three-dimensional numerical simulations of the Gross-Piteavskii equations, the nonlinear Schrödinger equation most relevant to quantum fluids.
| (I.1) |
Unlike in classical fluids, the velocity does not appear in these equations. Only through the Madelung transformation does velocity appear and can defects in the wave function be interpreted as the equivalent of fluid vortices. Crucial differences with classical vortices are that quantum vortices are infinitesimally thin and all have the same value of circulation. Unlike the Navier-Stokes equations, these equations are a Hamiltonian system and conserve their global energy and are regular for all time. That is, no higher-order derivative of the wave function can blow-up (have a singularity) in a finite time. Despite these difference, reconnection of vortices occurs in the inviscid Gross-Piteavskii equations, which in classical systems is a purely viscous effect.
The primary initial state to be discussed consists of two isolated, anti-parallel quantum vortices initially separated by several core diameters (the healing length) with symmetric three-dimensional perturbations. It is found that these vortices transform themselves into a flow consistent with most of the observed properties of quantum turbulence. In particular, the kinetic energy spectra increases in slope to be nearly -5/3 and kinetic energy is removed from the interaction region, such that locally it appears as if the energy is decaying. It is found that wave dynamics and stretching on the vortex lines play complementary roles in generating vortex reconnection. Neither by itself seems capable of generating the final state.
The most important new dynamics to be identified wil be a mechanism by which an energy cascade to small scales can be generated from the interaction of only two vortices. The required steps are:
-
•
Vortex stretching generates a vacuum between the points where the vortices are most strongly attracted.
-
•
There is an initial reconnection across this vacuum.
-
•
Curvature and torsion on the new vortex line created during the stretching process generates a second reconnection event and the release of a vortex ring.
-
*
During these phases, the vortex line length increases and kinetic energy is converted into interaction energy..
-
•
Waves form further out along the original vortex lines, then deepen.
-
•
There are further reconnections leading to a state dominated by vortex rings.
-
•
A kinetic energy spectrum forms at high wavenumbers in .
-
•
The interaction energy is released from the original interaction region, either by breaking down into phonons or by the rings propagating to the boundaries.
The paper will first present the equations, conservation properties, the numerical method and the initialization procedure. The discussion of the results will start by describing the evolution of the vortex topologies in physical space. Next the development of the high wavenumber spectra is discussed. Finally, the mechanism for the depletion of kinetic energy from the initial interaction region will be presented. Several other cases are presented, including a four ring case that support many aspects of the scenario suggested by the anti-parallel case.
I.1 Simulating superfluids
To simulate a nearly zero-temperature superfluid, the following properties must be satisfied.
-
•
Because a quantum fluid has no dissipation, its Hamiltonian, composed of gradient and interaction energies, should not decay in time except through additional physics or through interactions with the boundaries.
-
•
A quantum fluid is compressible, with a complex relation between the density and the pressure.
-
•
A quantum fluid is irrotational except along infinitely thin defects in the wave function known as quantum vortices and these all have the same quantum of circulation about their cores.
-
The differences with classical vortices are:
-
–
In a classical fluid, vorticity is distributed uniformly in space and the circulation about vortex cores depends on the initial condition.
-
–
For an ideal classical fluid, these values of the circulation are constant along Lagrangian trajectories. But in a viscous fluid the circulation changes in time.
-
–
Simulations of the Gross-Piteavskii equations with good numerics and adequate resolution should satisfy these properties. However, these equations must be discretized on a mesh and the numerical method must be remain accurate even if the density goes identically to zero in vortex cores. Until recently, the numerics seemed incapable of achieving these requirements. For this reason, vortex methods are often applied. However, vortex methods, whether Biot-Savart or the further reduced local induction approximation (LIA) have properties that might not be consistent with the Gross-Piteavskii equations. Foremost are:
-
•
In LIA vortices do not stretch, so the vortex line length cannot grow.
-
•
One expects, and these calculations confirm, that reconnection can lead to waves, twisting and further reconnections.
This will now be mentioned further to explain why these artifacts that do not appear in simulations of the Gross-Piteavskii equations nor in the experiments.
I.2 Why not use a filament approximation?
The first application of vortex methods to superfluids used the local induction approximation (LIA) (Schwarz, 1978). In this approach, long-range Biot-Savart interactions are ignored, leaving only local dynamics along the vortex line, that is between neighboring points. Along a single line these equations can be transformed into a 1D nonlinear Schrödinger equation (Hasimoto, 1972), which supports Kelvin waves and solitons. Both phenomena are observed in simulations of vortex lines, whether classical hydrodynamics, Biot-Savart filament calculations, along GP vortices, as will be shown here, and perhaps most dramatically the twists that go up and down tornadoes.
While LIA explains some dynamical features for an isolated filament, dynamics due to interactions between vortices are excluded, including stretching and reconnection.
II Equations, numerics and initial condition
The equations simulated are a form of the standard higher dimensional focusing nonlinear Schrödinger equation for a complex wave function with a cubic nonlinearity: The Gross-Pitaevskii equations (I.1). This is a hard-sphere approximation to the full equation of state:
| (II.1) |
Following Berloff (2004), the following choices are made: , the chemical potential and and are non-dimensionalized to be 1. While only an approximation for a superfluid, the hard-sphere approximation is believed to be valid for a Bose-Einstein condensate and is believed to qualitatively incorporate the most important physics for quantum turbulence in a very low temperature superfluid. Therefore, while idealized, it is physically relevant.
The outer boundary condition for a BEC in a trap would have the wave function and density go to zero at the boundaries, that is Dirichlet. For a superfluid in a container, it is better to use no-flux or Neumann boundary conditions, which is used here both as the outer boundary and as a way to generate symmetric initial conditions about the point of interest, as described below.
Applying the usual Madelung transformation for quantum wave functions, if then the velocity is
| (II.2) |
These equations conserve mass:
| (II.3) |
and a Hamiltonian
| (II.4) |
where is the complex conjugate of and
| (II.5) |
is the kinetic or gradient energy and is the interaction energy.
The advantage of considering only these two components of the energy is that this decomposition also applies in Fourier space and by examining the interaction terms in detail in Fourier space, one can more fully understand how a cascade might develop in that space. This is developed further in the section on spectral analysis and will be the subject of a subsequent paper.
II.1 Numerical method
The numerics is a standard semi-implicit spectral algorithm where the nonlinear terms are calculated in physical space, then transformed to Fourier space to calculate the linear terms. In Fourier space, the linear part of the complex equation is solved through integrating factors with the Fourier transformed nonlinearity added as a 3rd-order Runge-Kutta explicit forcing. The domain is imposed by using no-stress cosine transforms in all three directions.
This scheme has been used successfully for another ideal equation, the incompressible 3D Euler equations Bustamante and Kerr (2008) where the timestep can be chosen using the Courant condition and the kinetic energy is conserved to within machine accuracy. Because the velocity has no role in the integration of the GP equations and because the nonlinearity is cubic, not quadratic, it is not possible to choose the timestep in a similar way to conserve the total energy.
Instead, a resolution dependent constant timestep is used that is chosen to be small enough that the results converge in a manner consistent with the Runge-Kutta algorithm. A measure of the accuracy of the method is to track the Hamiltonian over time, which grows slightly with time, roughly as . Over the course of the highest resolution calculation reported here, with 20,000 time-steps, it grew by a factor of 0.01.
The boundary conditions serve two purposes. Because the initial condition has two symmetries, it incorporates those symmetries into the numerics at the appropriate boundaries. Secondly, on the other boundaries the cosine transforms provide impenetrable, stress-free or free-slip boundaries, which are a reasonable approximation to the true boundary conditions in a superfluid. If more realistic conditions were required at the outer boundaries, extra terms could be added that could extract energy from the system. However, the results presented here demonstrate that even for the ideal equation there are effects that can mimic dissipation without relying upon any additional dissipative terms.
II.2 Initial conditions
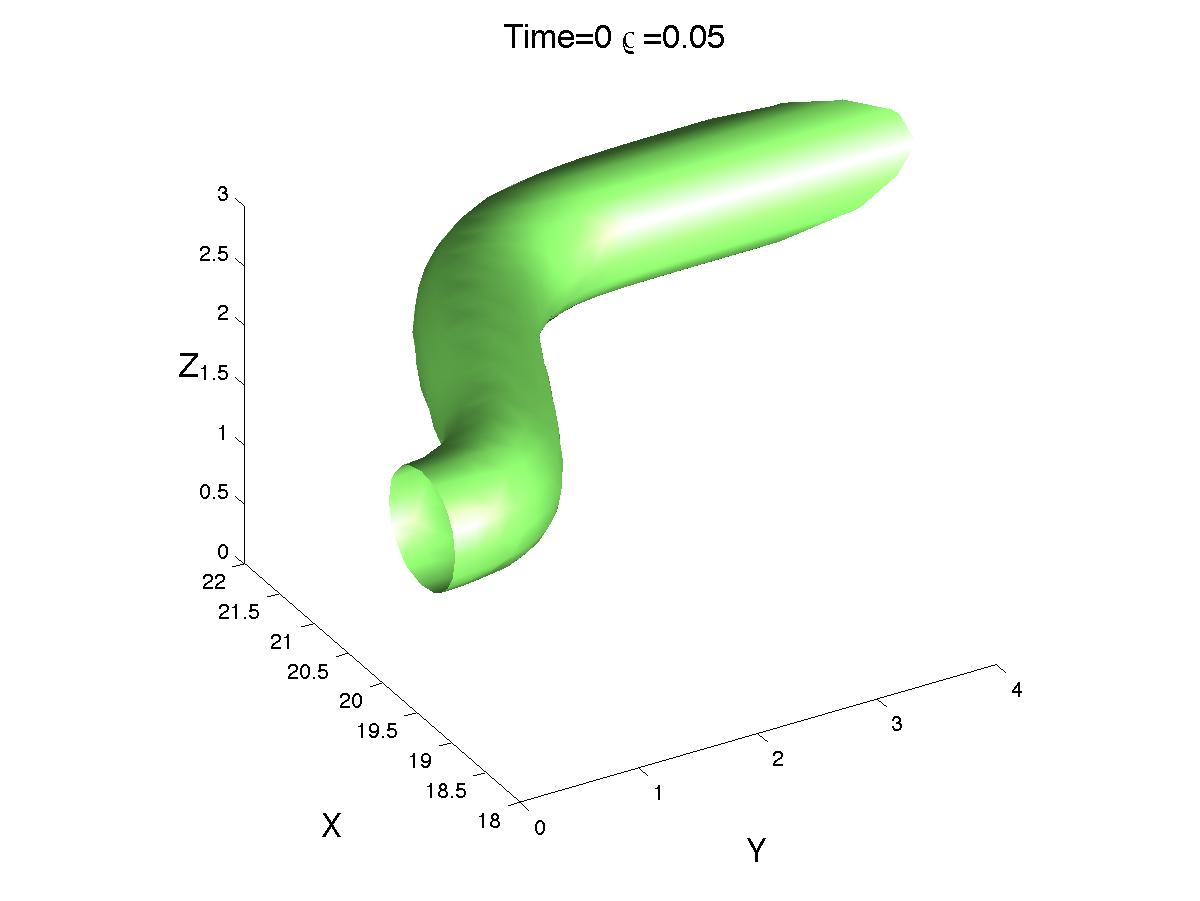
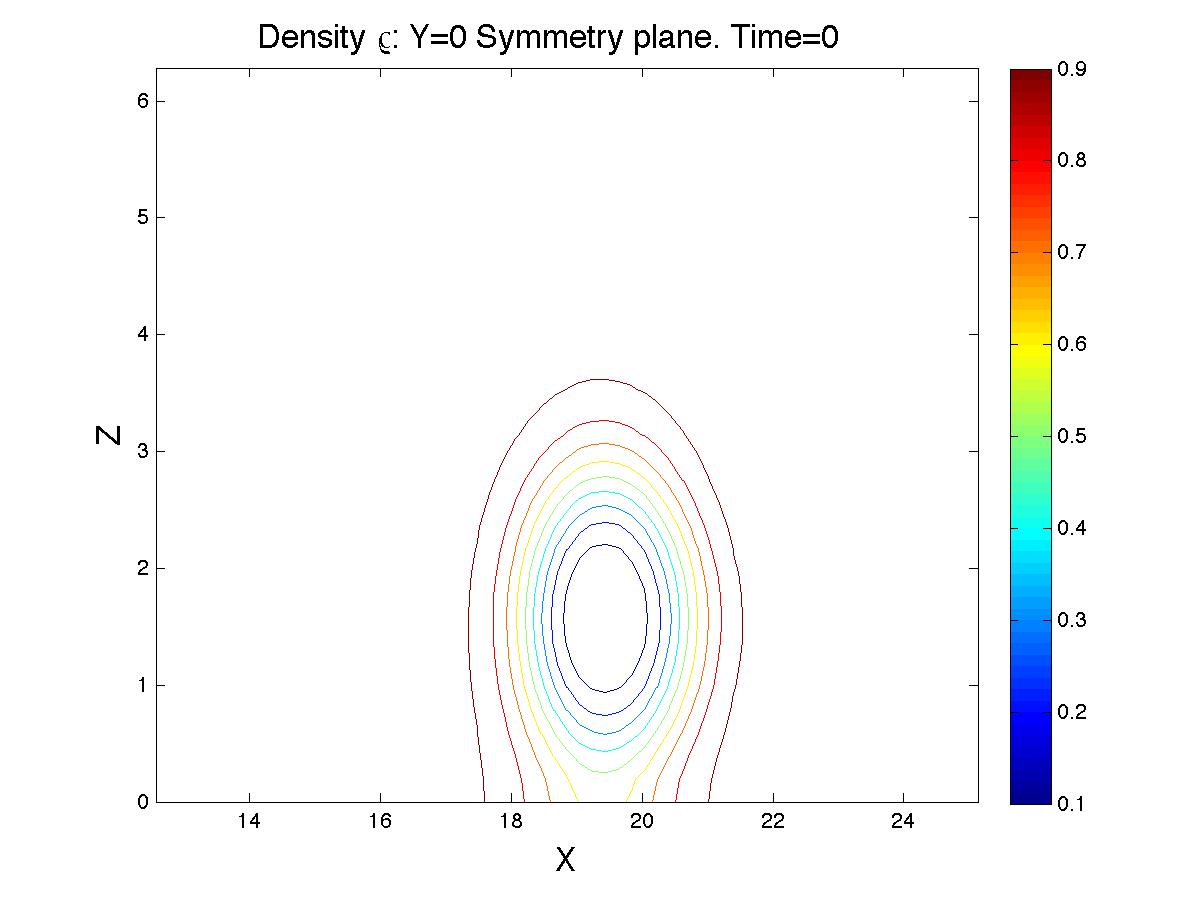
The goal for initialization is to provide a smooth initial condition along a curved vortex. Due to the symmetries imposed, one could initialize with only one vortex. However, it was soon realized that this resulted in discontinuities of higher-order derivatives of the wave function at the boundaries, and as soon as the cosine decomposition was imposed, waves appeared throughout the domain. These discontinuities were removed by using multiple images from outside the domain of the initial condition and a Fourier smoothing. Earlier work (Koplik and Levine, 1993) used three secondary images. In this work, 23 secondary images are used.
Another feature that is required for a smooth initial condition is that the density profile be both smooth and respects any expected analytic balance between centrifugal forces and pressure about vortices. The most singular part of the initialization procedure is around the vortex cores, so to be on the safe side the initialization in the vortex cores was chosen smoother than might have been necessary. The final step for obtaining a wave-free, smooth initialization is to filter the highest wavenumber with a filter. Following experience gained initializing for the incompressible Euler equations Kerr (1993), the final filter should be used only to remove any final extraneous noise, and not be the primary means by which inconsistencies are removed. A measure of how successful all the other steps are at generating a wave-free, smooth state is how small the filter is needed. when was found to be sufficient and in the worst test case reduced the pre-filter Hamiltonian by 2% and the density changed by .02%.
The basic density profile about the singularities in the vortex cores obeyed an analytic profile of the form
| (II.6) |
While it is based upon a Padé approximate to an ideal 2D quantum vortex (Berloff, 2004), which has and , for these calculations and was chosen to ensure that the wave function around the vortex singularities was as smooth as possible initially. Once the calculation started, this profile quickly adjusted to profile.
The initial profile function was applied approximately perpendicular to the trajectory of the vortex lines, and not perpendicular to the -axis as was done for an Euler calculation (Bustamante and Kerr, 2008). The reason for the change is that with the former procedure, there were large () variations in the density above the background of in the initial condition. Using the new method the maximum excess density peaks were reduced to .
Two other differences with the Euler simulations are the trajectory of the vortex and the size of the domain in the vortical direction. Both of these modifications were dictated by the formation of post-reconnection Kelvin waves on the vortices. For a smaller domain these would propagate to the -domain wall and reflect back by the time only one vortex ring had separated off. To see the multiple rings reported required that the domain wall be set back further, and that there be no perturbations to the initial anti-parallel trajectories beyond a short distance in . So rather than the nested cosine trajectory used for Euler (Kerr, 1993), the new trajectory path is:
| (II.7) |
with and in a domain on a mesh. The power 1.8 on the normalized position was chosen so as to localize the perturbation near the symmetry plane. This new trajectory assisted in minimizing the maximum excess density spots.
III Results: Stretching, reconnection, waves, rings
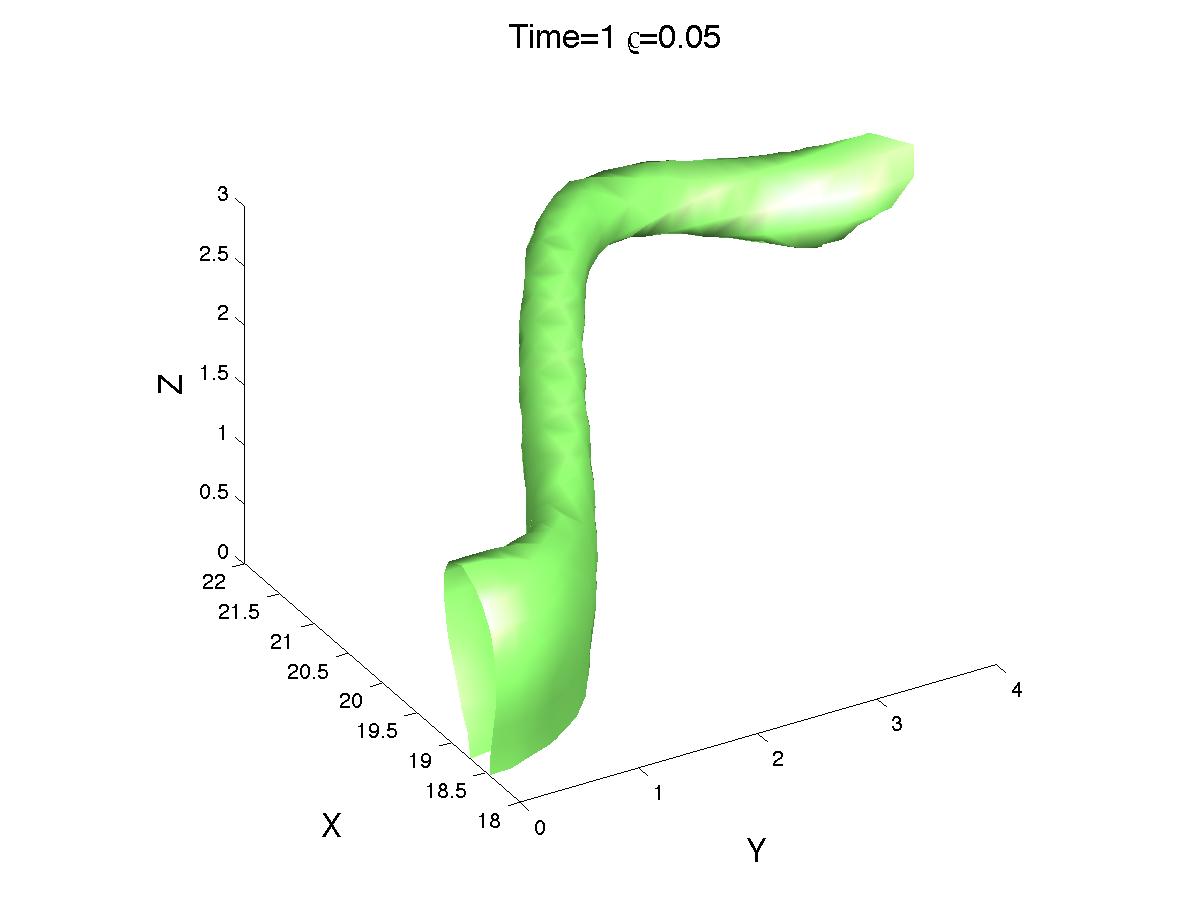
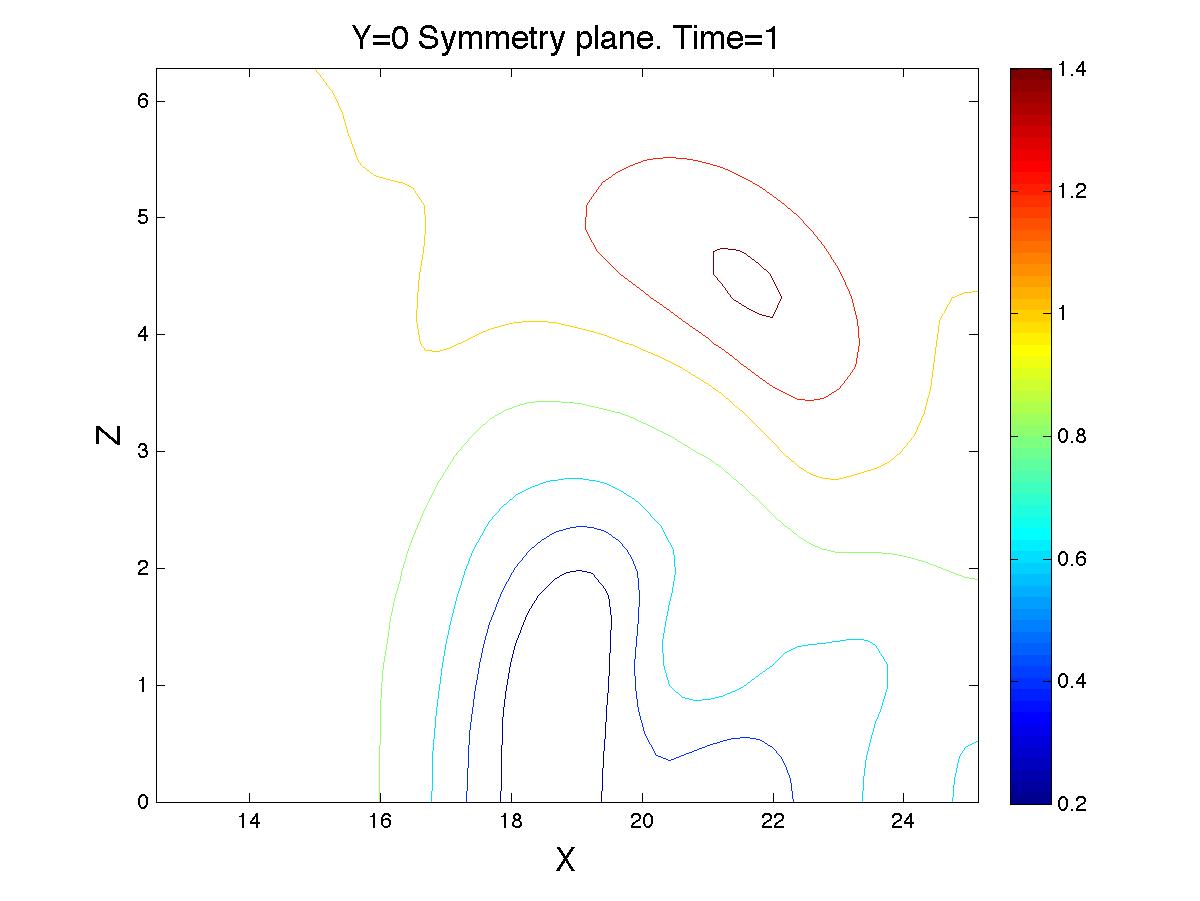
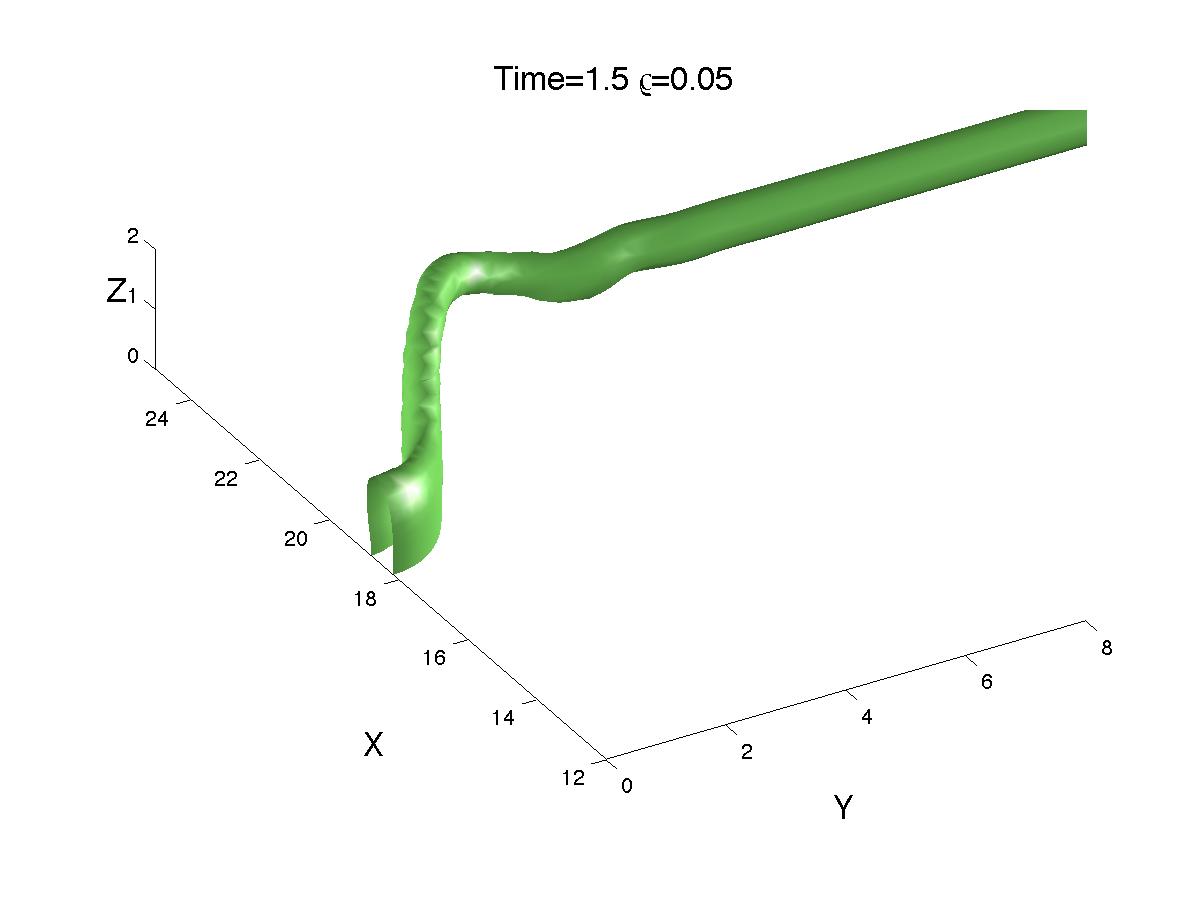
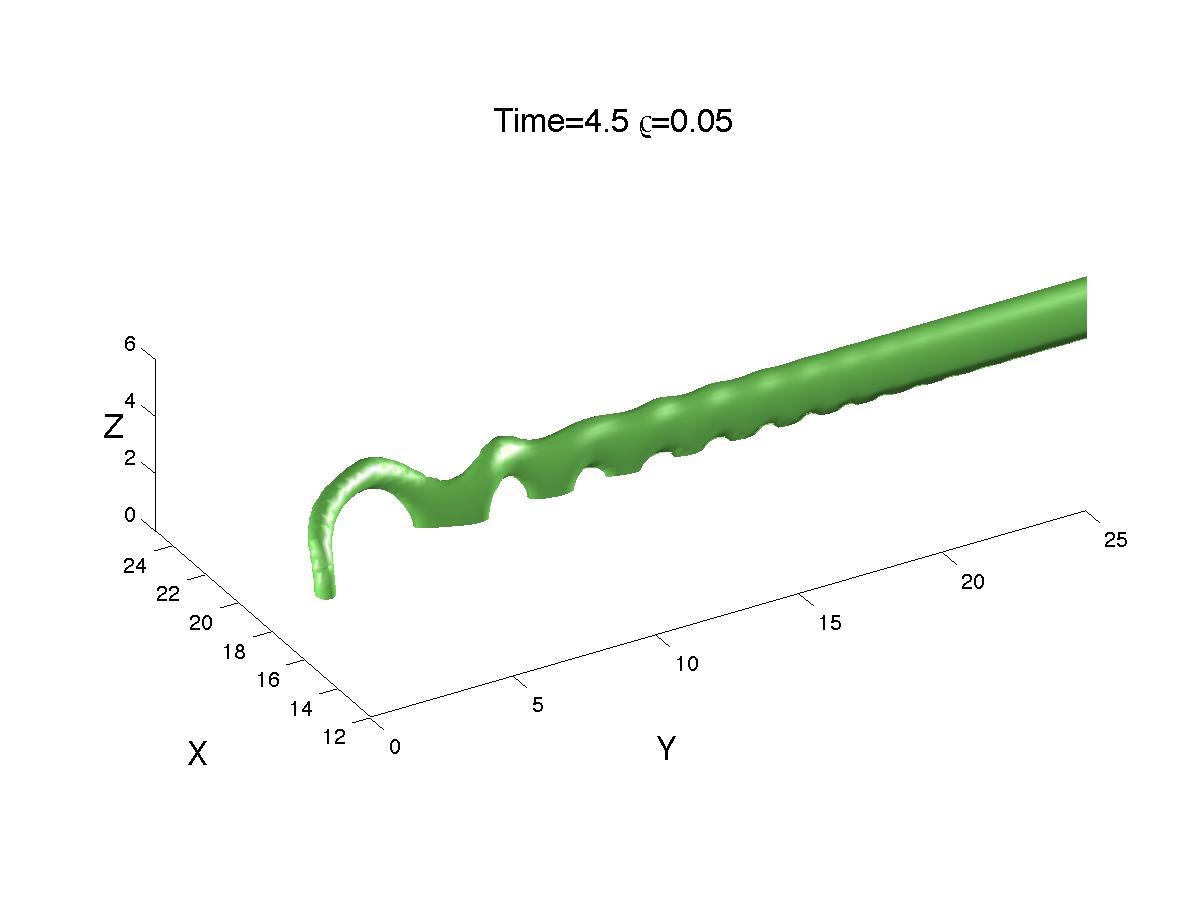
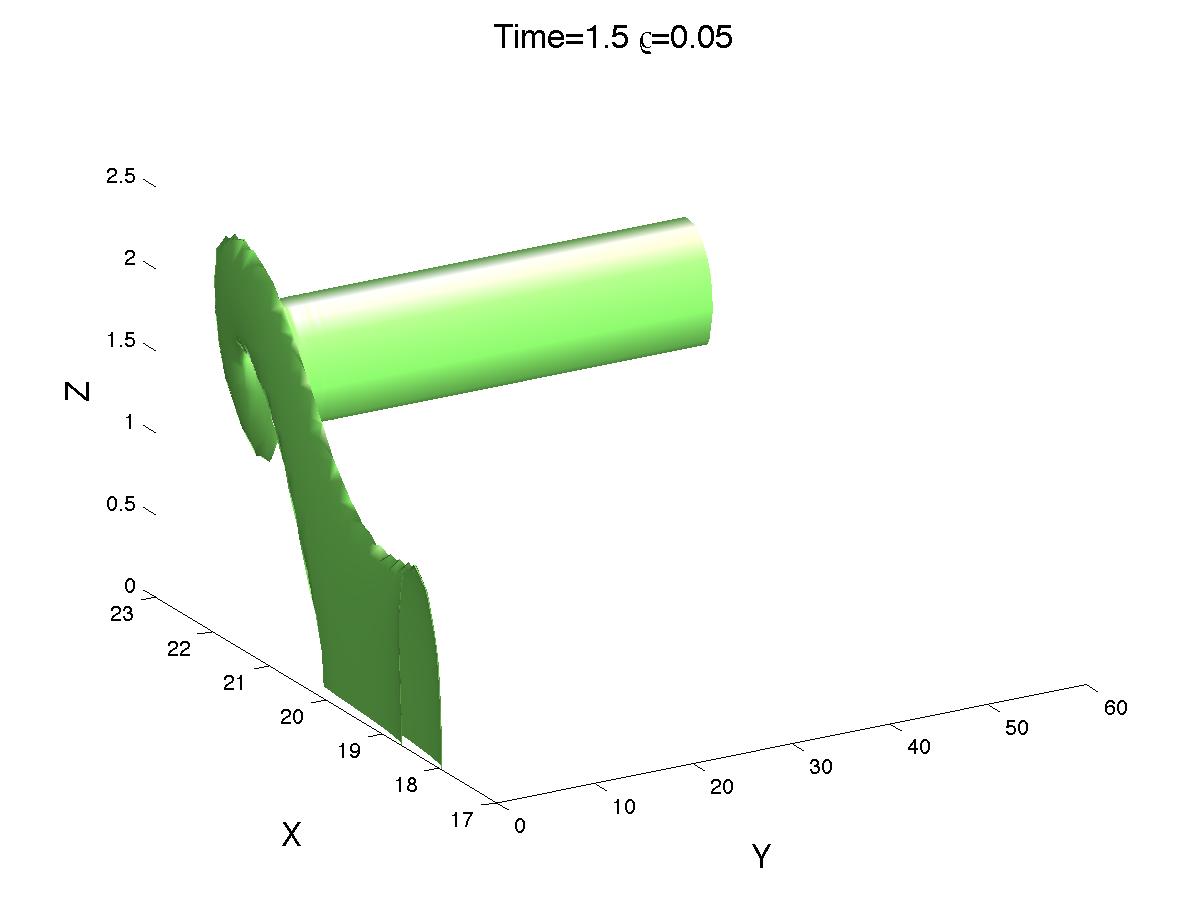
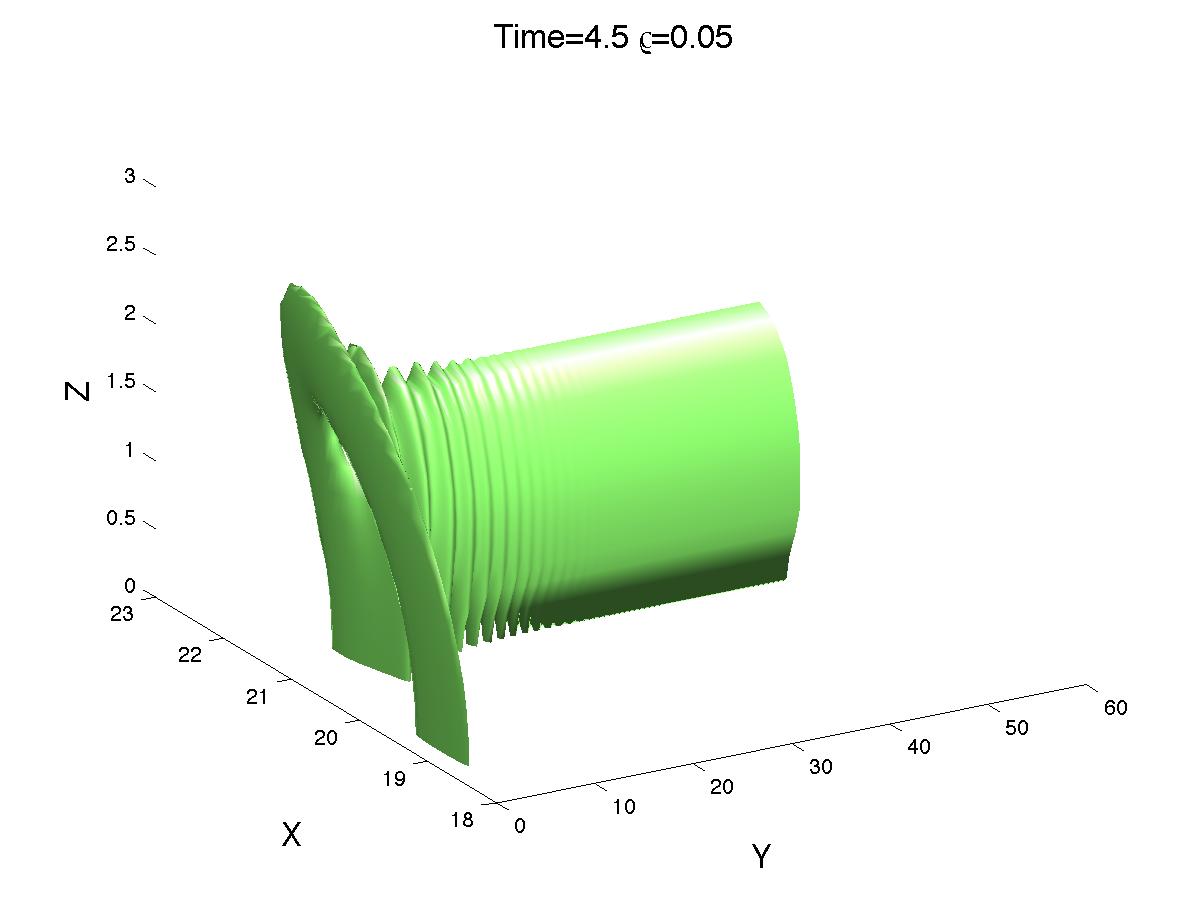
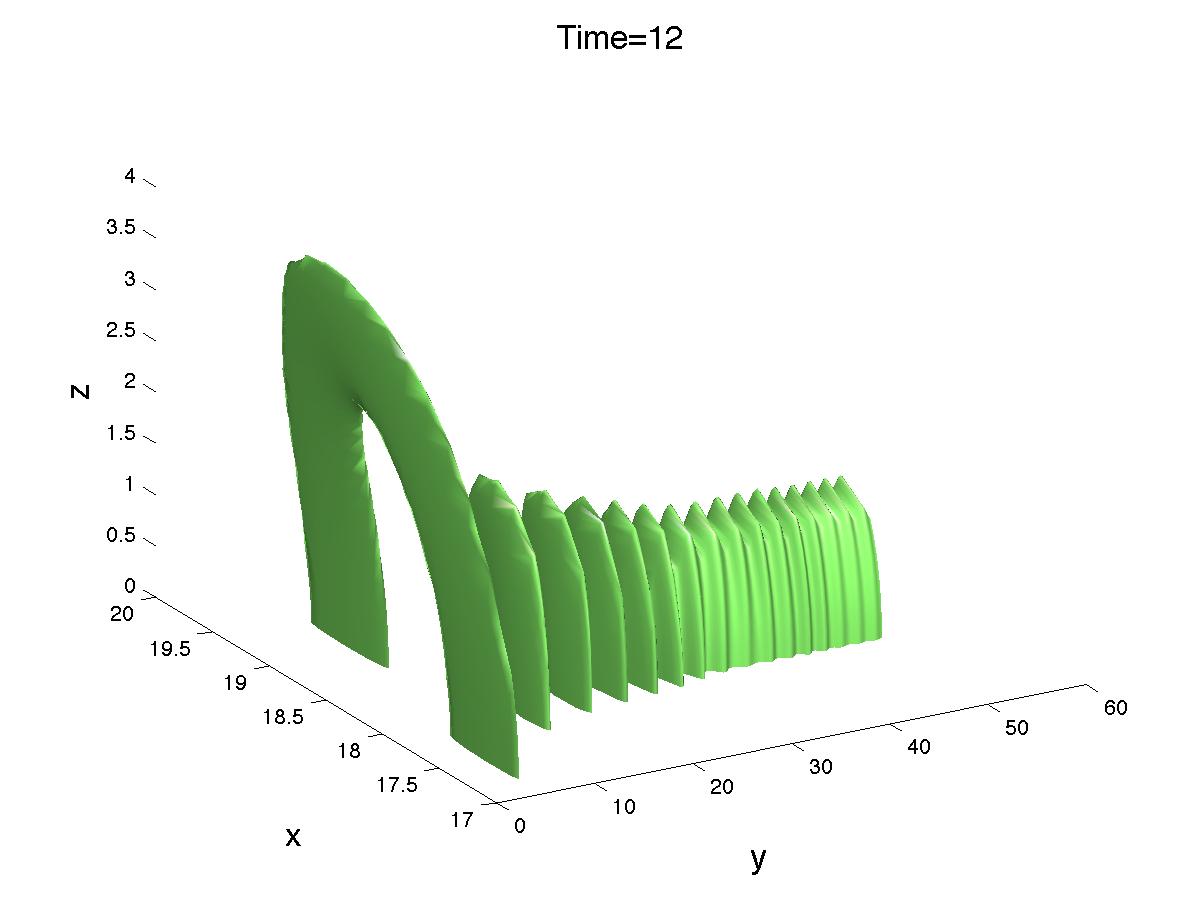
The first three figures are designed show the stages in development before vortex rings begin to form. Figure II.2 shows two early two isosurfaces of density for the initial condition chosen. Fig. II.2 shows the initial vortex stretching. And Fig. II.4 shows the evolution from this initial condition to a state where the vortex waves have started to reflect off the external wall.
Stretching
That vortices stretch in the Gross-Piteavski equations was first suggested by (Nore et al., 1997) using spectral properties. Using a box counting method Leadbeater et al. (2003) provided evidence for both the growth and decay of vortex lines. How a pair can stretch is demonstrated here by Fig. II.2 and quantified in Fig. IV.1. For a superfluid, vortex stretching changes the density between the vortex cores. First drawing denser fluid in and making the region of thinner, then as the two vortices approach one another, creating a vacuum.
Vacuum and reconnection
The creation of the pre-reconnection vacuum starts on the symmetry plane then extends to the dividing plane at . It is through this vacuum that reconnection occurs. The creation of the vacuum results in a transformation of kinetic energy into interaction energy.
Waves
Following reconnection and the creation of new vortices with sharp curvature, Kelvin waves are generated along the new vortices, as shown in Fig. II.4. Similar waves were seen using the local induction approximation following a wall-induced reconnection event (Schwarz, 1985) and have been explained using LIA (Svistunov, 1995; Lipniacki, 2000). The self-crossing of the vortex lines noted there bears some resemblance to the deepening of the vortex lines following reconnection reported here.
III.1 Generation of rings
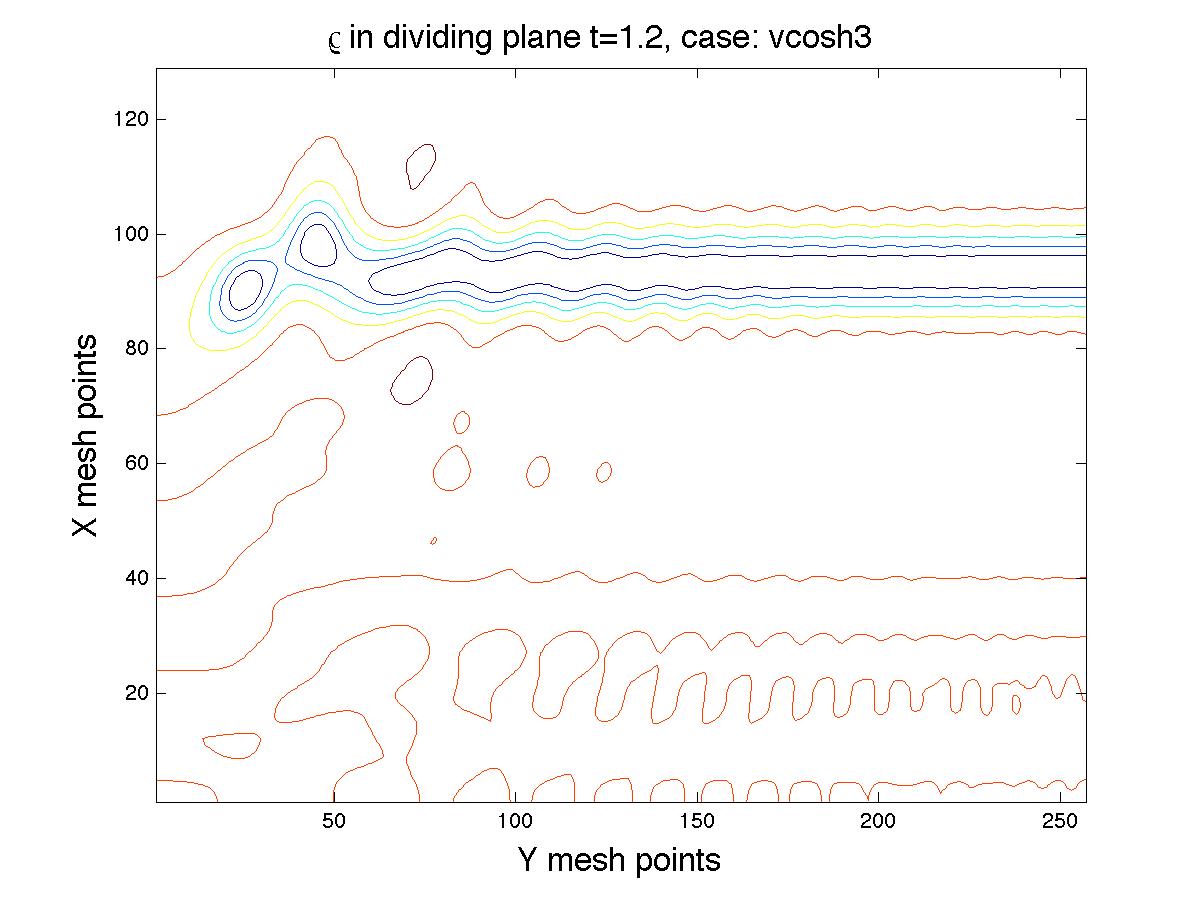
The vortex waves continue to deepen until they reconnect again across the x-y dividing plane in Fig. II.4. This is best illustrated by the isosurface in Fig. II.4. Closer examination reveals a series of these kinks is developing for as the vortex waves become a series of zig-zags. A second reconnection at the kink near results in a ring separating from the paired filaments.
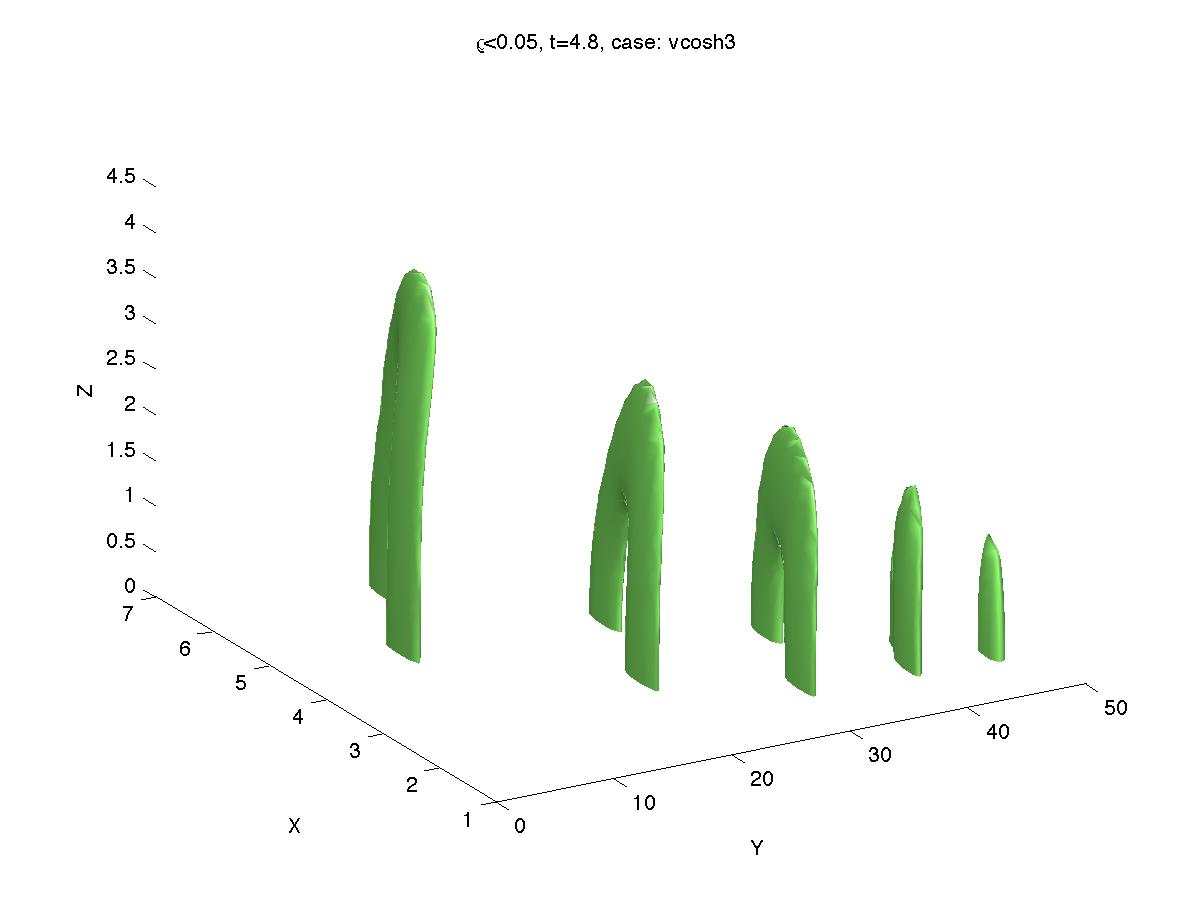
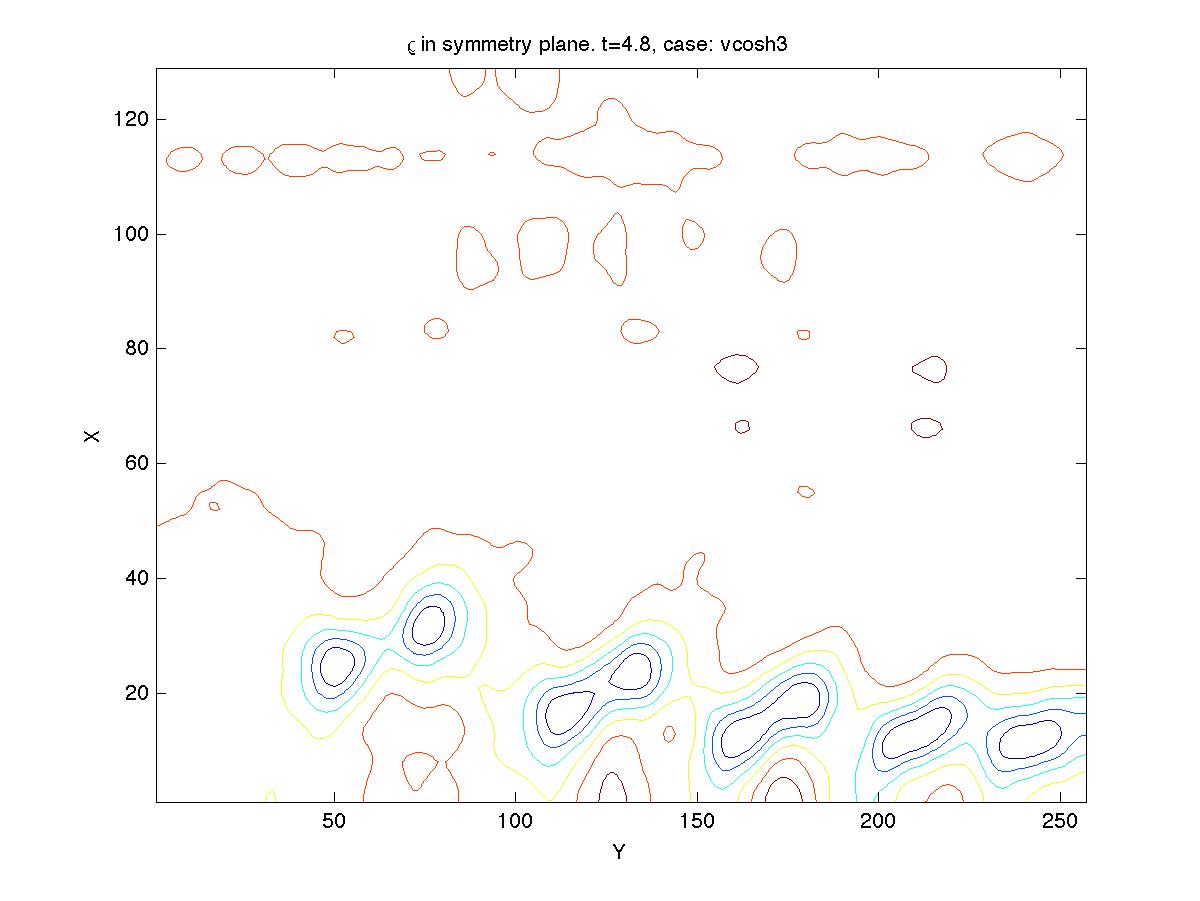
After the second reconnnection and separation of the first vortex ring, a succession of reconnections quickly occur between the wavy vortices, that is between the illustrated vortex and its mirror across the dividing plane, which lead multiple rings. Fig. III.1 shows the isosurfaces and dividing plane cross-sections of density to show where these subsequent reconnections occur.
Note that each successive ring that forms has a smaller radius than the previous ring. Because the quantum circulation about the vortex cores of each vortex ring is identical, this implies that the propagation velocity of each ring increases. and the separation between the rings increases. This implies they will not interfere with each other and can therefore freely leave the local system.
Why are the successive rings each smaller than the previous one? Could it be an artifact of the particular initial condition of two nearly anti-parallel vortex lines? The four vortex case mentioned below demonstrates a state similar to this when the tangle is formed. Higher resolution and further analysis will be necessary to determine which secondary properties associated with the formation of multiple rings, exist in this calculation as well.
Where, in physical space, could a cascade be forming that the spectral analysis reported next finds? Since the rings separate with time, it cannot be forming from subsequent ring-ring interactions and further reconnection. Instead, the ongoing analysis suggests that each spectral cascade step is associated with the formation of each new ring. That is, each new and smaller ring pulls energy into its smaller length scale and corresponding higher wavenumber.
III.2 Spectra
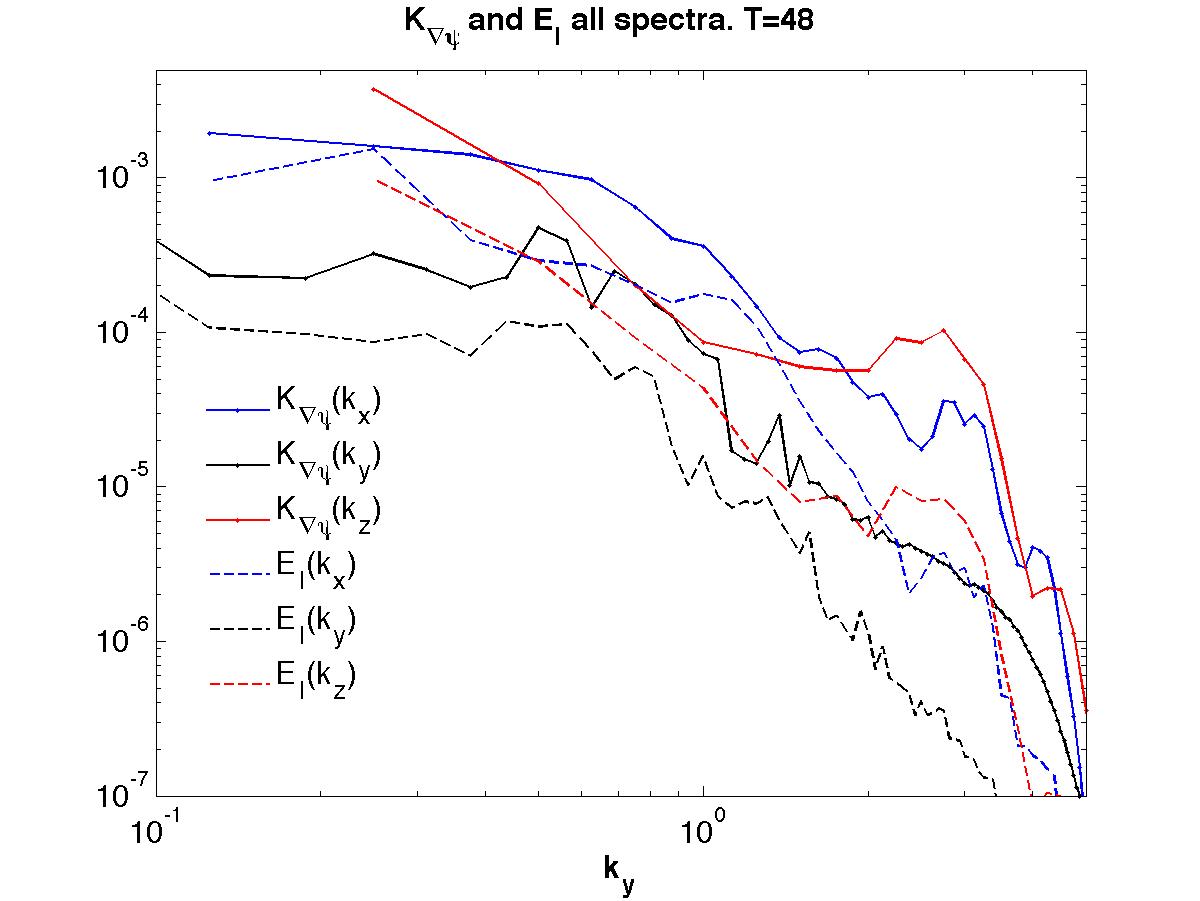
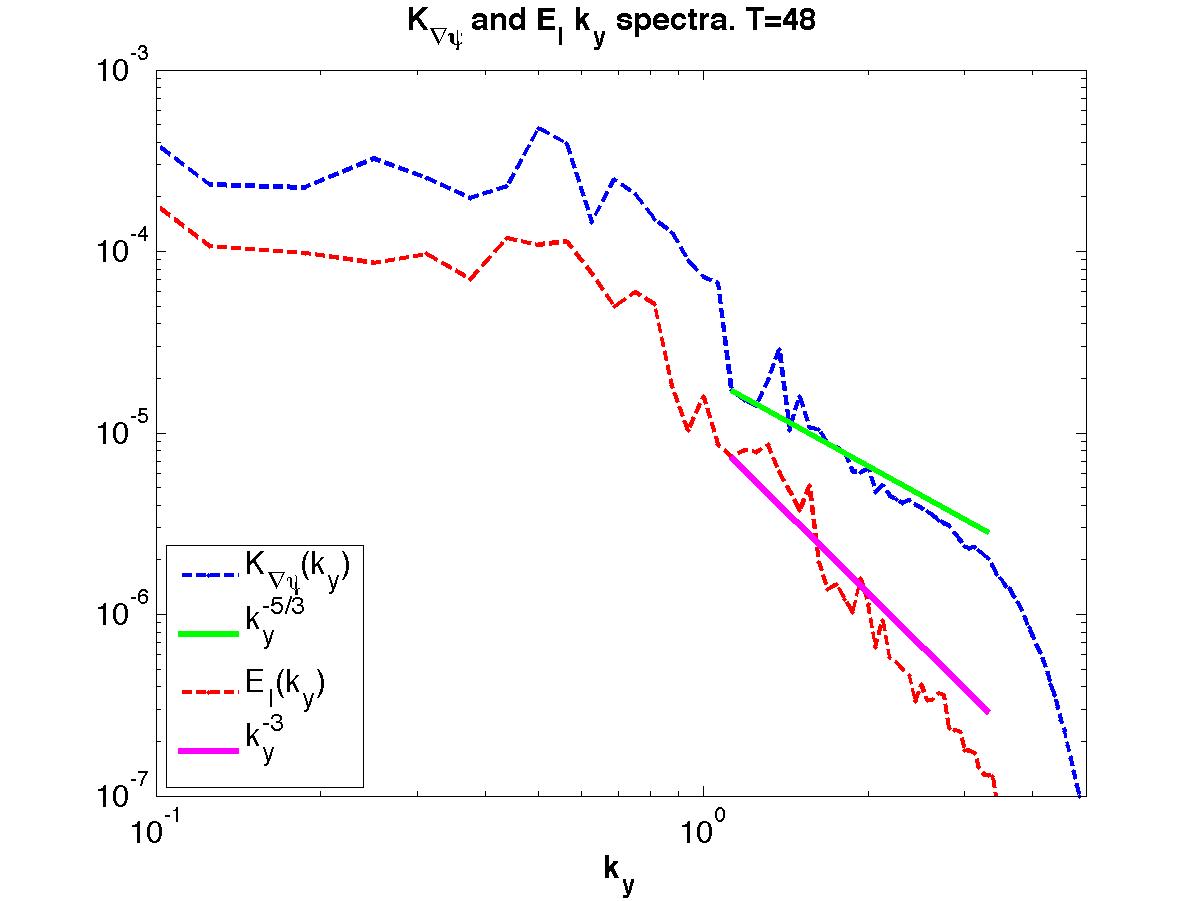
Before spectral results are presented, some caveats are in order. Spectra are usually taken from large statistical ensembles, which allows them to smooth out transients. For time-developing calculations such as this calculation, smooth spectra are not expected. The most we can expect is to see a progression with time of energy to smaller or larger wavenumbers. Therefore, the spectral slopes can be only approximate. Four spectral plots at successive (but not equally spaced) times are shown.
What might be significant is that the kinetic energy moves to higher wavenumbers in and , the directions perpendicular to the direction of the original vortex lines, and perpendicular to the direction of propagation of the final vortex rings. This would be consistent with the cascade developing through the formation of smaller and smaller vortex rings.
The interaction energy spectra are equivalent to spectra of the density fluctuations, which have been measured in a superfluid Roche et al (2007). The interaction energy spectra in these simulations are steeper at all times than -5/3, suggesting that is being transferred to small wavenumbers.
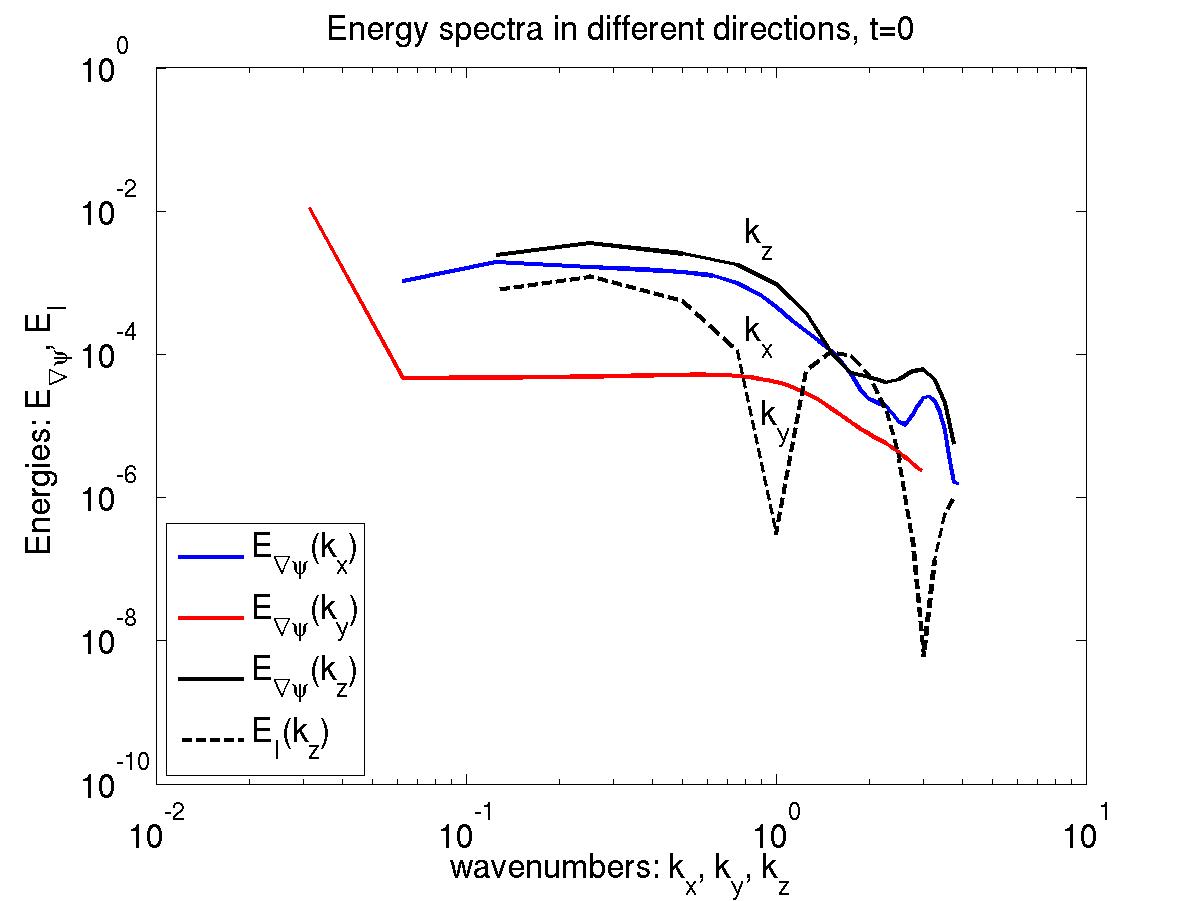
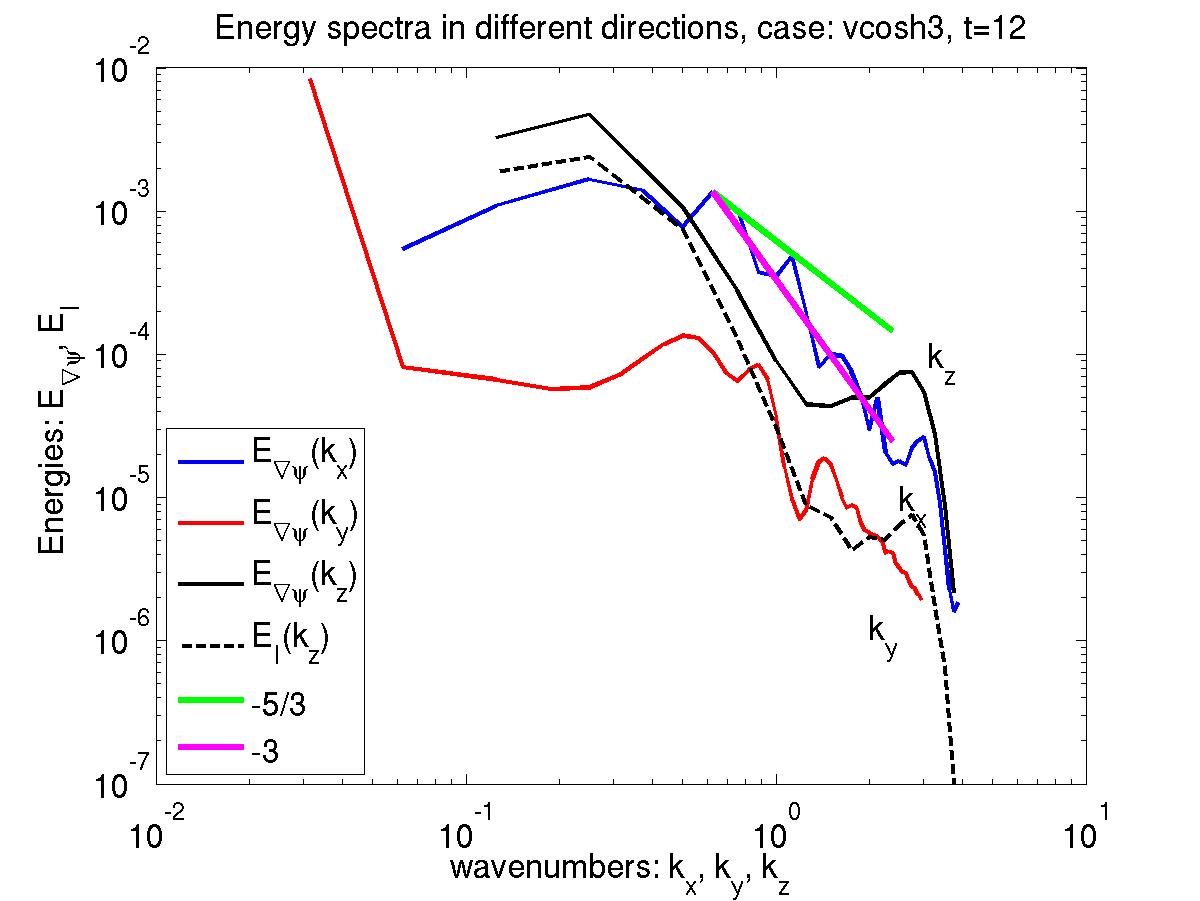
Bottom frame: By , just after the first reconnection, the and components follow roughly the same scaling in all three directions and to a rough approximation obey . A strong bump at high wavenumbers still persists from the initial condition for . While this looks like a bottleneck, it is only an artifact of the initial condition.
IV Energy decay
A final observational property of quantum turbulence that this simulation can address is how dynamics analogous to viscous dissipation in classical turbulence could appear in an inviscid Hamiltonian system. What is observed experimentally is the decay of the vortex line length. Or more exactly the density of deficits in the vortex cores, which scatter the second sound waves or ion beams used as probes Assuming the lines are very thin, then the density of these deficits is proportional to the length of the vortex lines.
IV.1 Assumed relation between line length and kinetic energy
This density of lines is usually interpreted as a sign of the decay of kinetic energy by the following argument:
-
•
Vortex line length in superfluid turbulence is observed to decay as ,.
-
•
If each quantum vortex line segment is viewed as an element of vorticity , this implies that .
-
•
In classical turbulence, is known as the enstrophy, which (multiplied by viscosity) is proportional to the dissipation rate of the kinetic energy .
-
So if , then .
-
•
In classical, homogeneous isotropic turbulence in a periodic box the following is observed:
-
–
Energy:
-
–
-
–
Kerr (1981); but originally due to S. Patterson.
-
–
-
•
Note that this decay law is never seen experimentally, as in all classical experiments there are boundary layers. It has only been seen in simulations with either periodic or Neumann boundary conditions. As explained above, the Neumann boundary conditions used in the present calculations are a reasonable first-order approximation to the true experimental superfluid boundary conditions. So these ideal classical simulations are relevant.
- •
When originally found in counter-flow at higher temperatures Smith et al. (1993), the proposed explanation was transfer of energy to the normal fluid component through mutual friction. This would have been consistent with the explanation for relaxation in rotating bucket experiments going back to the 1950s. However, it has been pointed out that for this mechanism to work in a counter-flow experiments, there needs to be sufficient time for the superfluid and normal fluid vortices to equilibrate (Schwarz, private communication, about 1995).
IV.2 How could energy be depleted?
All explanations center upon the boundaries. Unlike the ideal boundaries of these simulations, the physical boundaries in a superfluid cell are not ideal and will remove energy, although not through viscous boundary layers as in a classical fluid. Therefore, the question of the origin of superfluid decay reduces to finding a sufficiently efficient energy transport from the interior to the boundaries to explain the observed decay of vortex line length.
Three mechanisms have been proposed.
-
1)
Quantum vortex lines could reconnect, form vortex rings, which then propagate out of the superfluid tangle (Feynman, 1955). Some role for this mechanism is found here.
-
2)
Linear waves, or phonons could be generated and propagate to the boundaries if their production is strong enough. The importance of such a mechanism is demonstrated here, but not production of phonons by vortex motion. What is observed here would be consistent with the production of rarefactions and phonons in calculations of the collision of two vortex rings (Leadbeater et al., 2001) and other configurations (Berloff, 2004).
-
3)
Recently, there have been several proposals based upon the propagation of waves on the vortices, which Fig. II.4 shows can develop on Gross-Piteavskii vortices. These wave theories could provide the decay mechanism if they transport energy sufficiently rapidly to their ends, presumably on the boundaries, or if there is a wave cascade to small scales along the filaments, at which point the smallest waves could generate phonons, which would then move the energy to the boundaries.
For the Kelvin wave explanation to work, the cascade rate must be sufficiently efficient. Traditional wave cascade models have not been able to achieve this efficiency, as pointed out by L’vov et al. (2007). Alternatives have been proposed Kozik and Svistunov (2004); Laurie et al. (2010) based upon adding additional physics and assumptions that would be difficult to verify experimentally.
IV.3 Kinetic energy depletion in the calculation


How can direct simulations of the Gross-Piteavskii equations help? The question is how to make the phenomenological relationship of the line length decay to the kinetic energy decay more robust. With a calculation, all the components of the energy can be calculated directly, which we want to related to a consistent, robust algorithm of determining the vortex line length.
Two methods have been proposed for determining the line length in calculations. Either by counting boxes with a property associated with the vortex cores (Leadbeater et al., 2003). Or by making the assumption that the spectral integral is proportional to the line length squared (Nore et al., 1997) by the arguments above under Sec. IV.1.
The analysis below shows that with the box-counting proposed here, the development of the anti-parallel calculation might provide the first numerical evidence of when both line length and kinetic energy in the original interaction region decrease. Elements of this can be found in earlier work, but either the box counting analysis is not compared to the kinetic energy Leadbeater et al. (2003); Berloff (2004) or the spectral line length analysis is unphysical. That is grows while kinetic energy decreases (Nore et al., 1997), or in the present calculations does not decay.
The box-counting criterion chosen here is to a pick low density threshold that will estimate of the volume occupied by the vortex cores. By dividing this volume by the area of the analytic profile (II.6) with , and choosing different density thresholds, consistency checks can be made.
There are two primary stages to the time dependence of the line length. After a brief adjustment from the initial condition, completed by , the line length grows, which would be consistent with vortex stretching. The stretching stage lasts beyond the first reconnection, near , and on through the second reconnection near when the first and largest vortex ring separates off, as illustrated by Fig. II.4.
Thereafter the line length decays. To understand the different stages, below the main figure there are three subplots showing distributions of the interaction energy (II.5) with respect to density at different times. If vortex stretching is occurring, one might expect there to be a strong growth in regions with very small densities. If the energy is in waves, then we might expect the distribution of to be concentrated around . Around, not at, because for , . Distributions of the density are not useful since their maximum is peaked near for all times. The distribution at is meant to demonstrate that initially, is maximum near .
During the period of vortex stretching there is a dramatic growth in , with most of the growth at small values of , as demonstrated by the distribution for when the line length is maximum. Because , small at a given automatically implies a small value for at , so what the distribution at is telling us is that there is a large growth in the number of points with . Note that the strong increase in during each of these stages is compensated for by a strong decrease in the kinetic energy
Immediately after , begins to decrease dramatically while kinetic energy continues to decay, which is compensated for by a continuing increase in the interaction energy . At the end of this stage, there is a growth in large values of on either side of , shown by the distribution at . This would be consistent the development of waves and the visualizations of waves being emitted from two colliding vortices (Leadbeater et al., 2001; Berloff, 2004). The double humped distribution relaxes gradually for .
A decrease in the global kinetic energy does not persist. Eventually interaction energy converts back into kinetic energy. This could be associated with the structures (rings) formed by the multiple reconnections reaching the outer -boundary, or due to the existence of a wave-dominated state. Similar oscillations where observed in GP calculations with a symmetric Taylor-Green type of initial condition (Nore et al., 1997). This would not happen in a real experimental device because the boundary conditions are not ideal.
To mimic what decay in a real flow might look like, especially experiments that generate tangles far from boundaries (Walmsley and Golov, 2008), the final two curves in Fig. IV.1 show the growth, then decay, of the line length in the first -quadrant (), and a rescaled kinetic energy decay curve. When viewed in this way, the local region exhibits kinetic energy depletion due to transport out of that region in physical space after the global kinetic energy begins to reappear.
V Analysis and calculations in progress
For this calculation to be accepted as a paradigm for the dynamics of kinetic energy decay in quantum turbulence, it must be demonstrated that the events seen here are not unique to this particular initial condition. The four ring case noted below would support this claim. What the anti-parallel case provides that more general cases cannot provide is a tool for addressing deeper questions about the cascade dynamics, and in particular the relationship with the creation and destruction of physical space structures. What should be addressed?
Nonlinear spectra: Formulation and cascade trends
An unfinished piece of analysis is the Fourier spectra of the energy transfer. The equations have been formulated, and one property is that the kinetic energy and interaction energy must mediate the cascade of the other. There cannot be a cascade of just kinetic energy or interaction energy. They must be coupled. Which directions do the two cascades go? The evidence so far suggests that there is a cascade of kinetic energy to small scales, while the conversion to interaction energy is through a coupling with much smaller wavenumbers (i.e. large length scales).
More general initial conditions
Upon presentation of these results at several meetings, one consistent concern was whether the dynamics observed here are an artifact of the particular strongly anti-parallel initial condition, or might be more general.
One of the goals of these additional cases will be to test the validity of assumptions made by recent vortex wave models for the quantum turbulence cascade. So far, all wave growth and all reconnections seen are driven only by interactions between vortices that were originally distinct. There has been no evidence for any signficant wave growth or appearance of reconnections due to individual vortex dynamics. Rather, the generation of due to stretching and the phonons that are generated in the process seem to suppress all auto-vortex wave and reconnection processes. In particular there is no evidence for cascades of waves appearing on individual vortices as one model with higher order Biot-Savart terms predicts Laurie et al. (2010). And reconnections are never sufficiently sharp to generate the torsion needed to drive self-reconnections on vortices as proposed by another model Kozik and Svistunov (2004).
V.1 Orthogonal
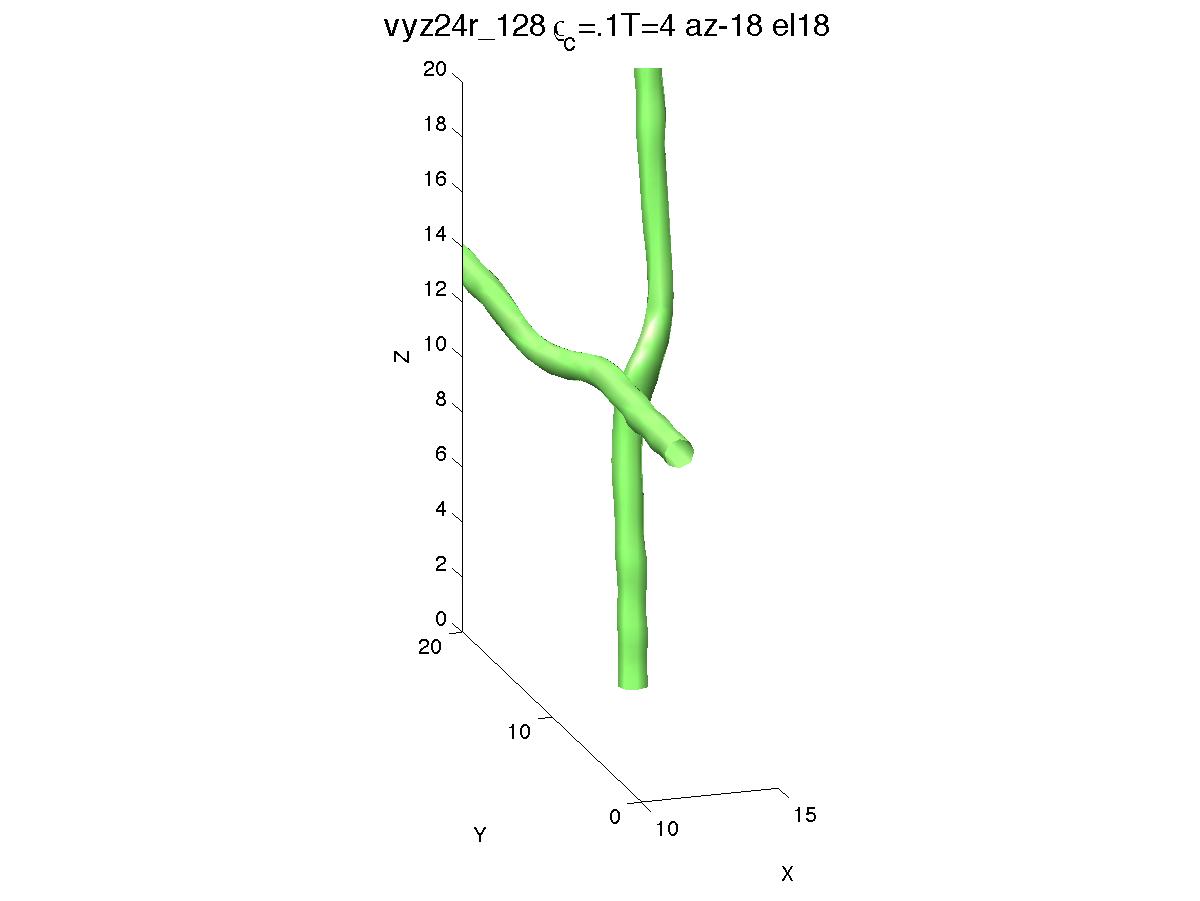
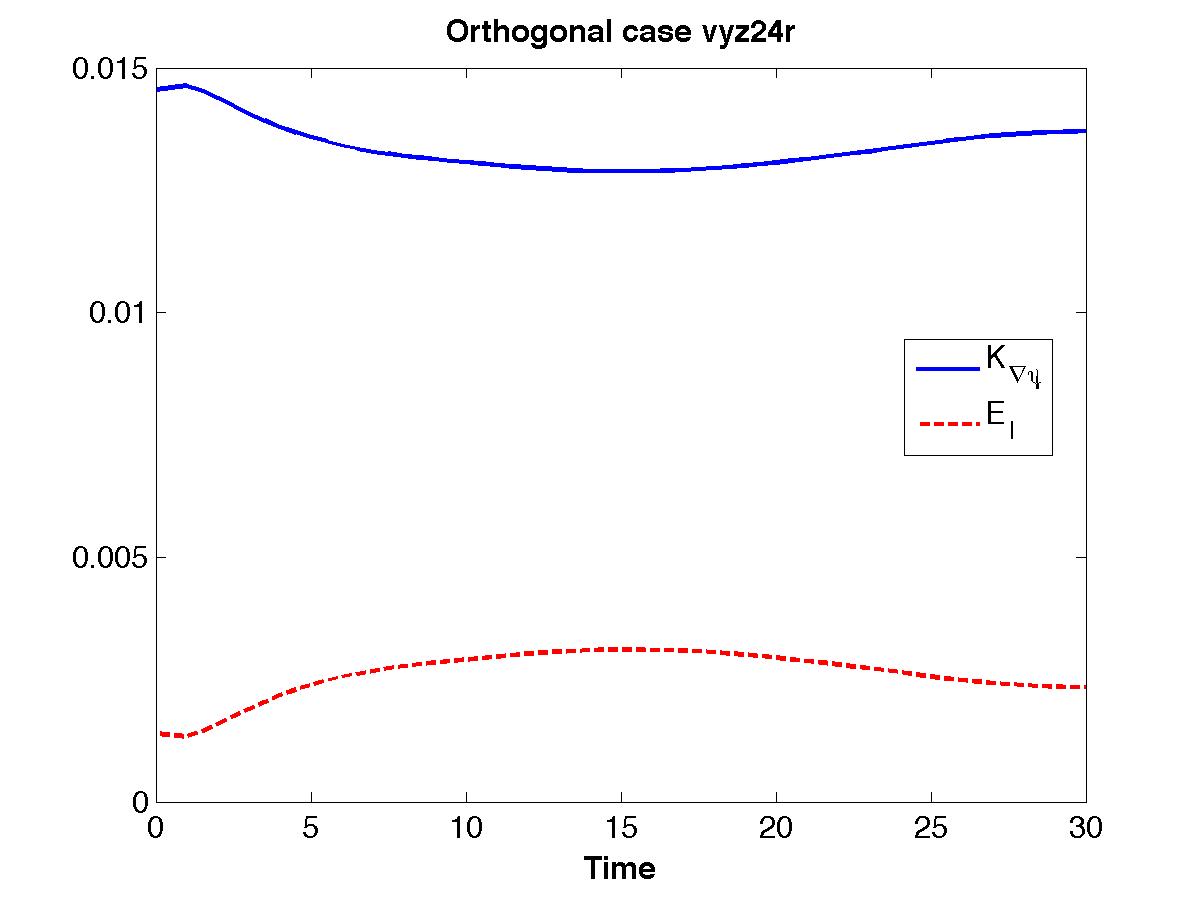
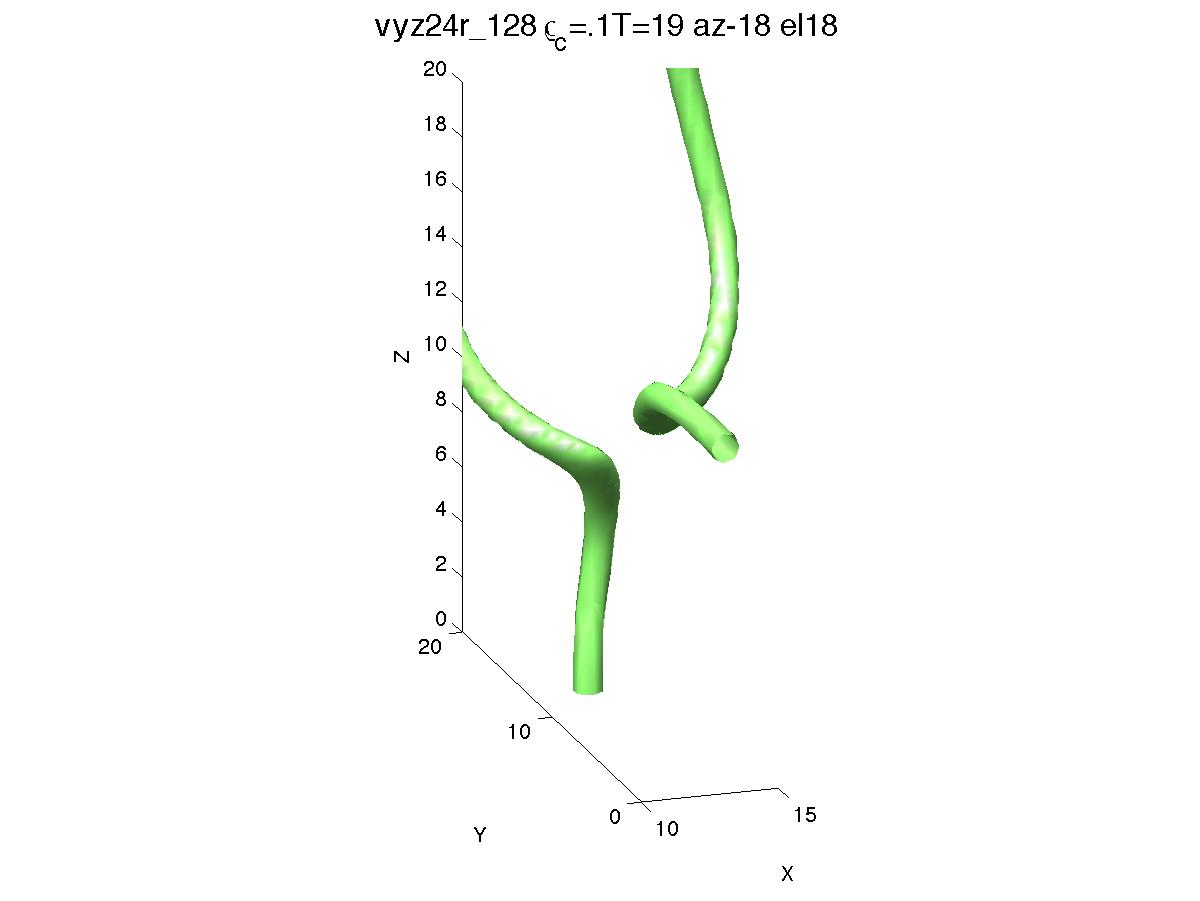
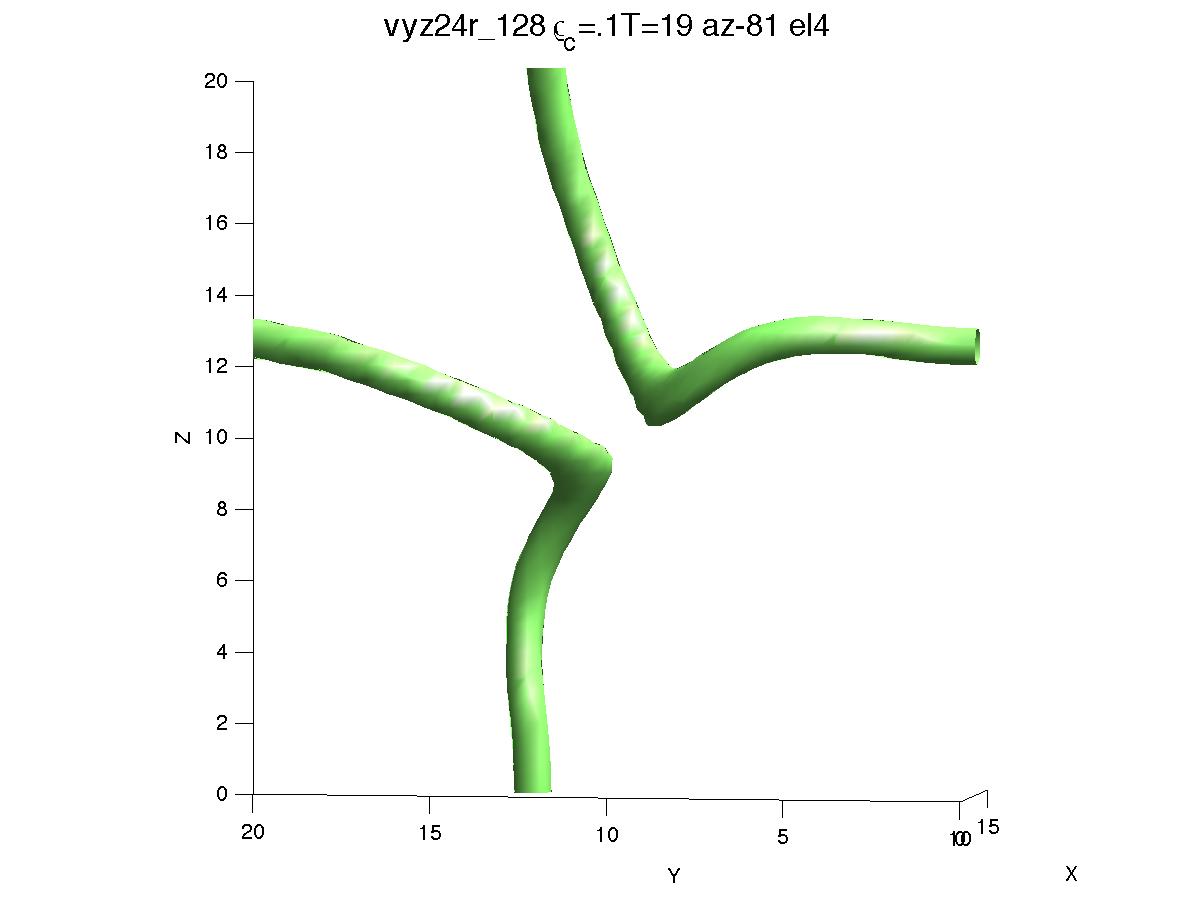
The case most frequently asked about is initially orthogonal vortices. Test calculations were done and are essentially no different than what was first presented in 1993 Koplik and Levine (1993). The reconnected vortices are twisted, but not enough to generate waves or any further self-crossings and reconnections. This is distinctly different from the LIA filament analysis of Lipniacki (2000), from which at least one additional one additional reconnection, would be predicted.
This orthogonal case also resembles Case A from Bewley et al. (2008) for the experimentally visualized quantum vortices recently highlighted in in Physics Today (Schwarzschild, 2010).
Based upon simulations of the reconnection of classical orthogonal vortices, one would have expected there to be self-reconnections. Further tests with the original vortices are intermediate angles need to be explored to determine if this result is general.
V.2 Two rings
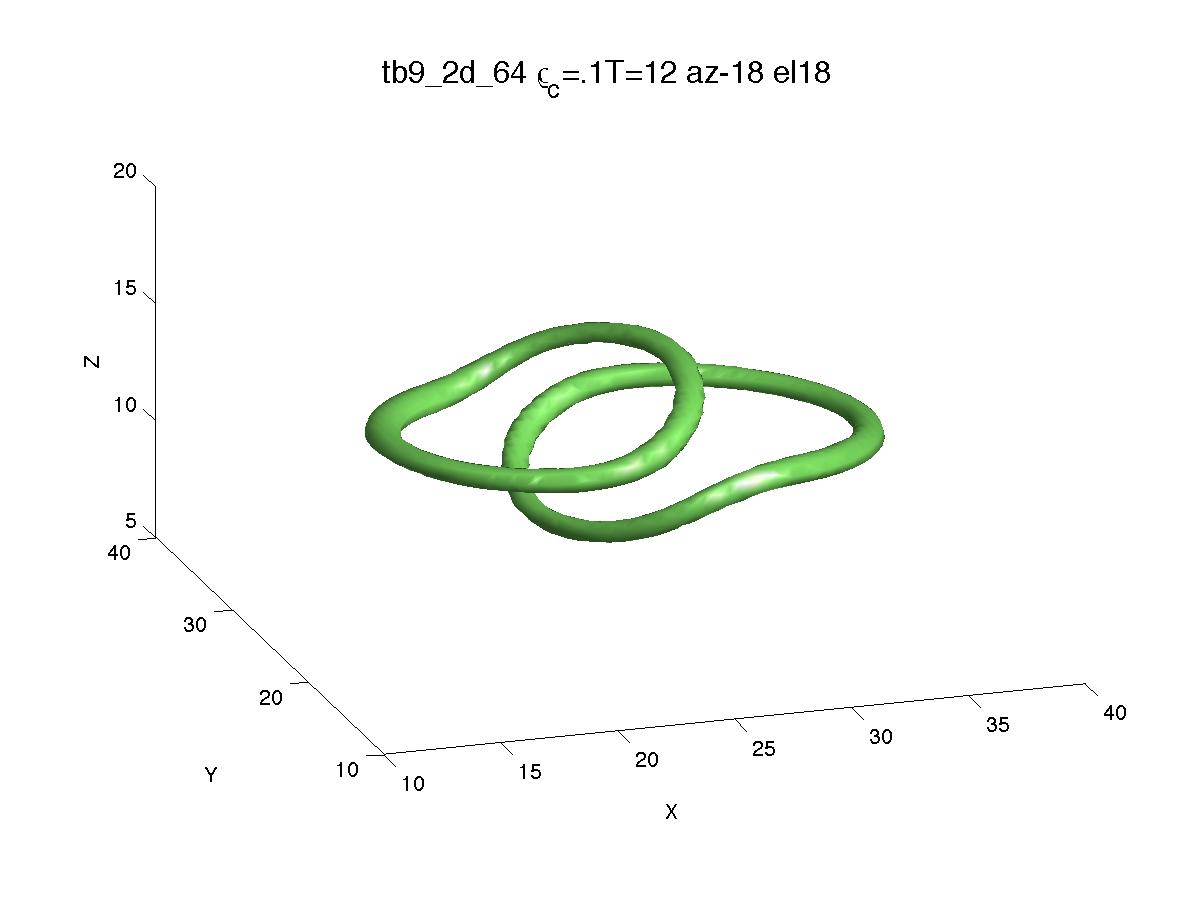
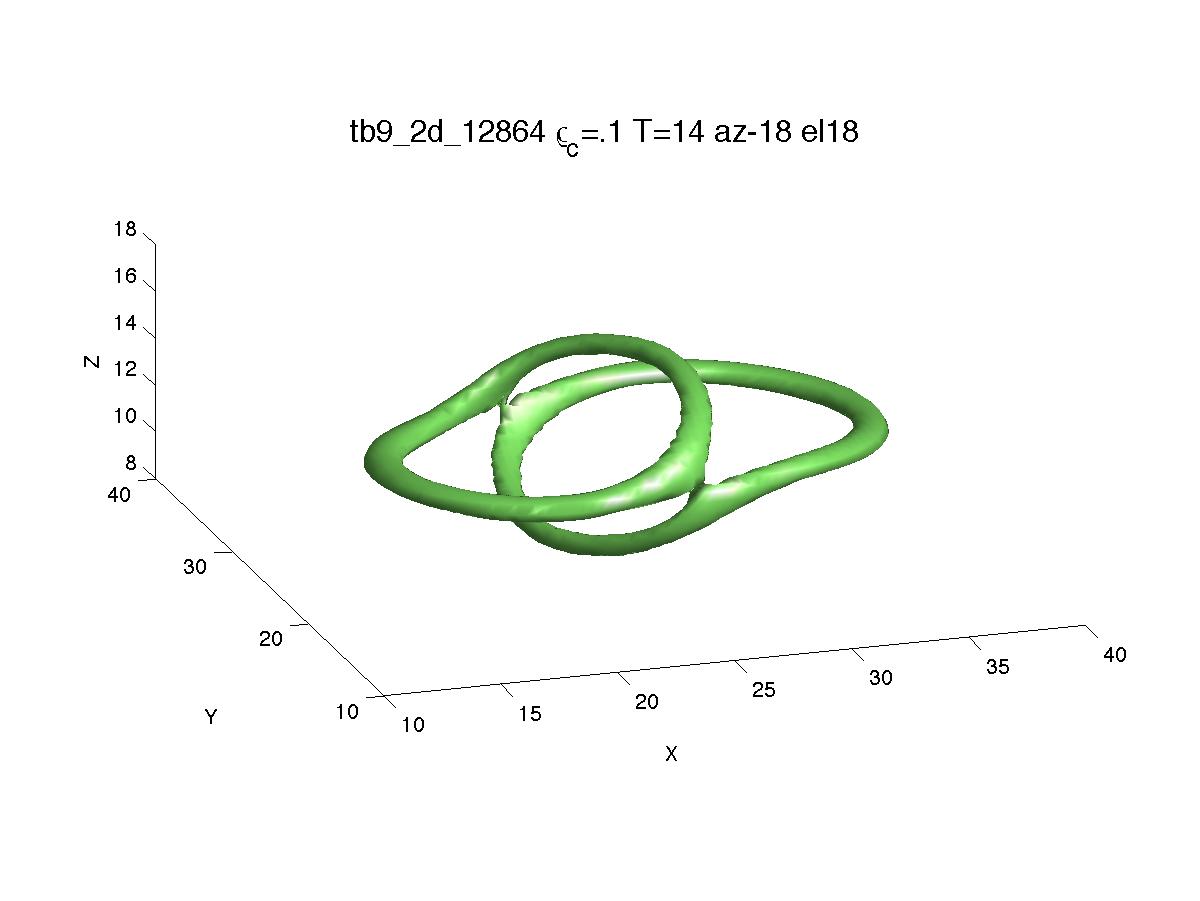
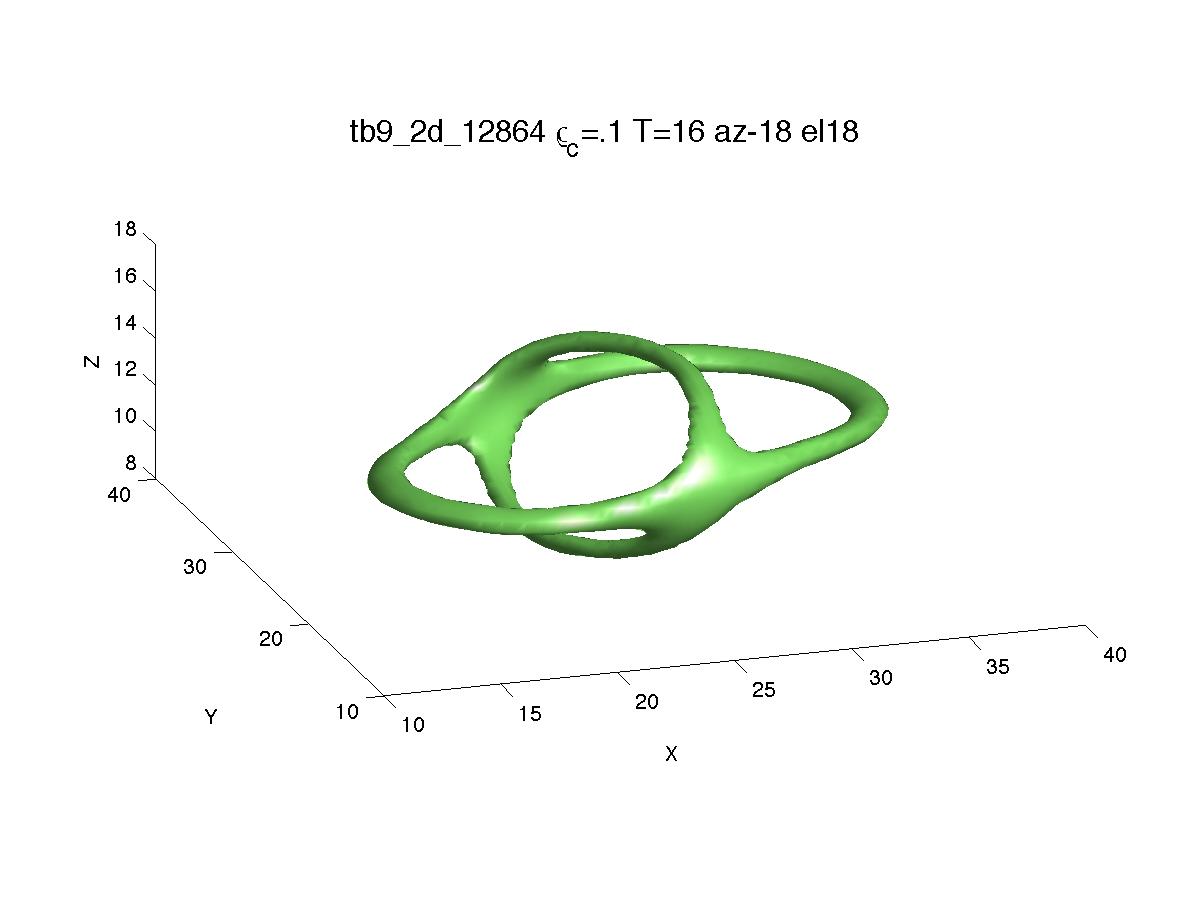
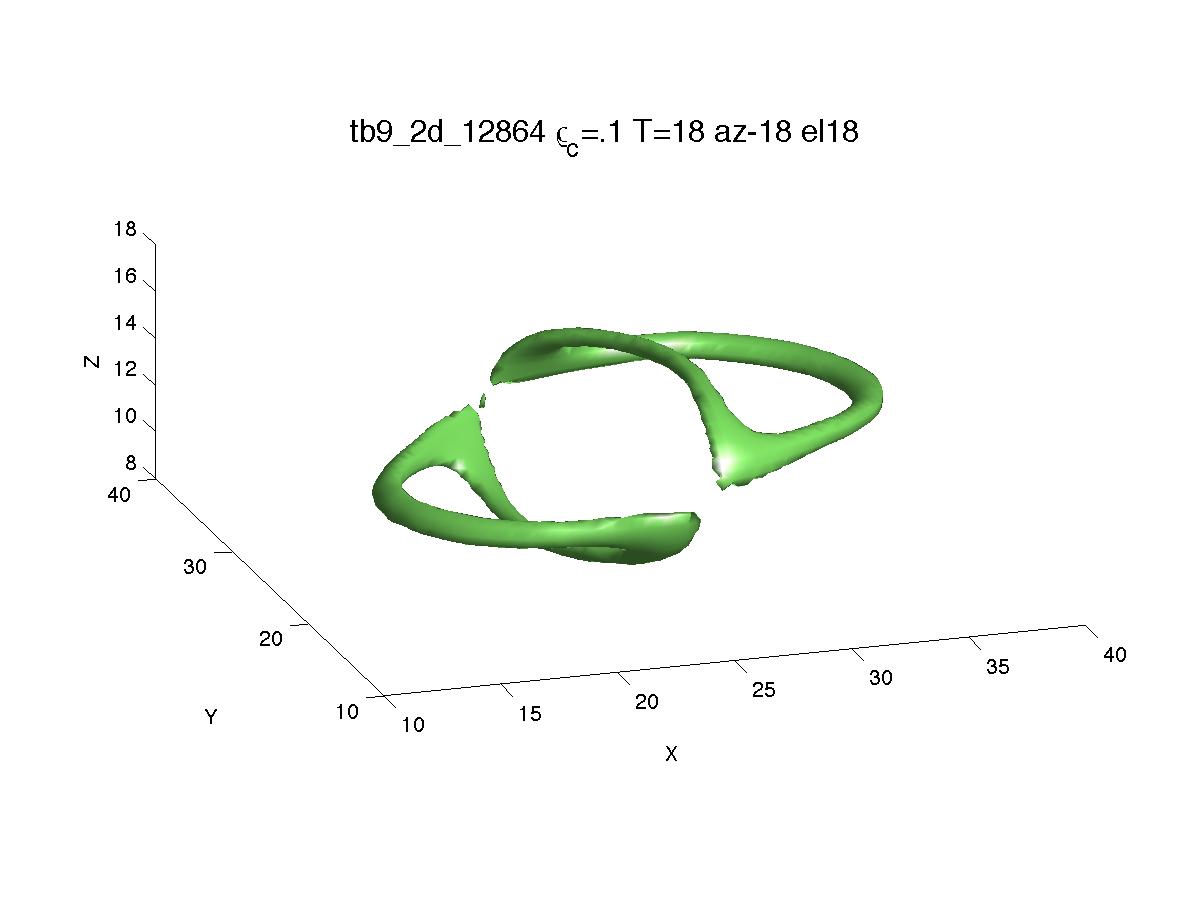
In the search for a structure with collapse properties similar to the primary anti-parallel case here, a number of colliding ring configurations were explored. One batch of tests used approximately anti-parallel pairs, all with their axes in the plane, each with slightly different radii, different ellipticities and displaced horizontally from one another.
All except one followed roughly the same scenario. As they approached, first there would be two reconnections. This would then form a roughly figure-eight configuration of the vortex lines. Then with further reconnections this would break down into two outgoing vortex rings.
There are similarities to the dynamics of two colliding rings with the same radii, and displaced horizontally, reported by Leadbeater et al. (2001). They do not get a figure-eight, but a more closed intermediate structure. However, they do get two rings coming out of the intermediate structure. The purpose of their paper was to demonstrate that phonons (or GP Kelvin waves) appear from the reconnections and possible evaporation of the smaller outgoing rings. This would be consistent with the anti-parallel case here. Further analysis of higher resolution calculations would be necessary to determine if this is happening for these test initial conditions.
In one distinct case here, the combination of ellipticity and displacement of the vortices was sufficient that they reconnected at opposite ends of their ellipses, at the point where originally the vorticity was parallel. But first, one of the rings the vorticity twisted itself around so that the reconnection was still between approximately anti-parallel vortices.
V.3 Four rings
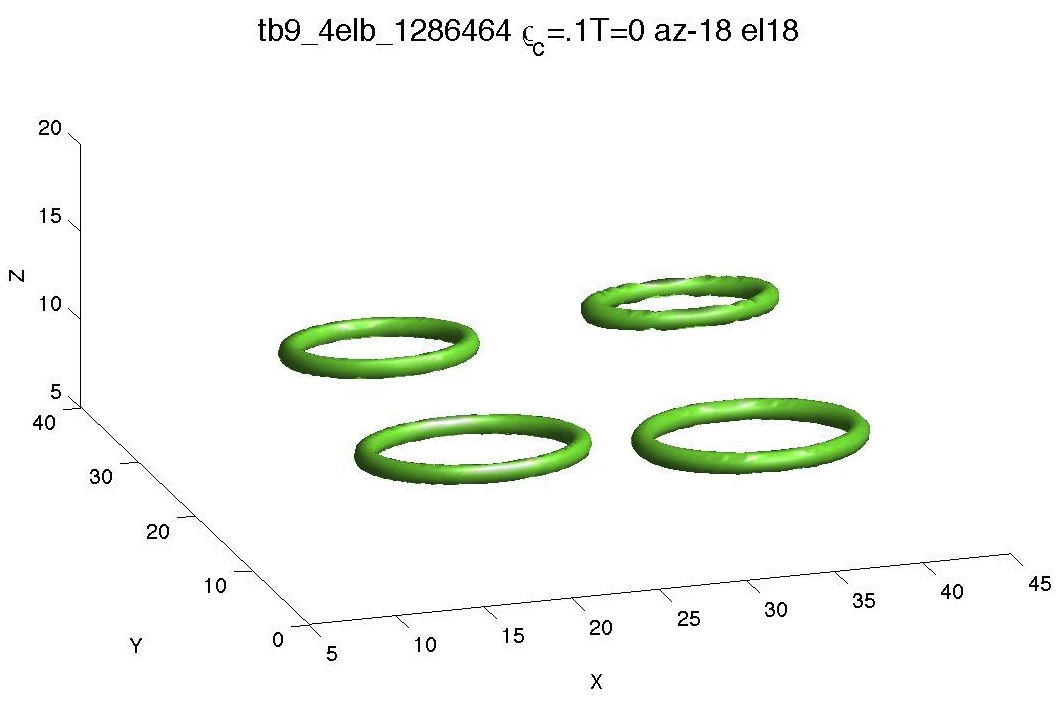
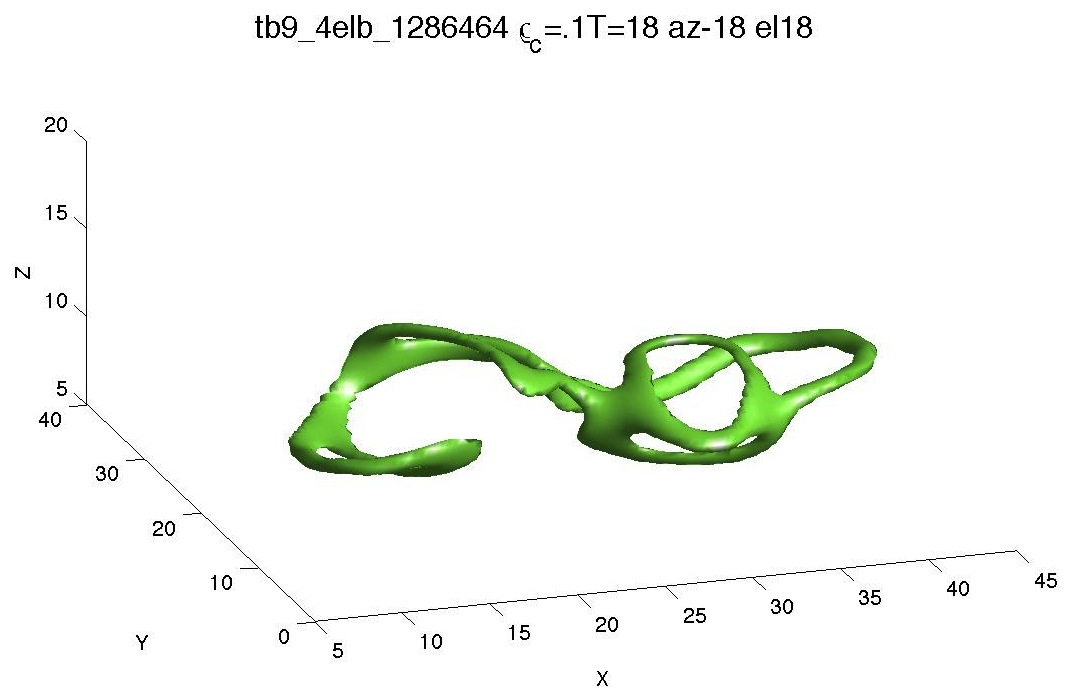
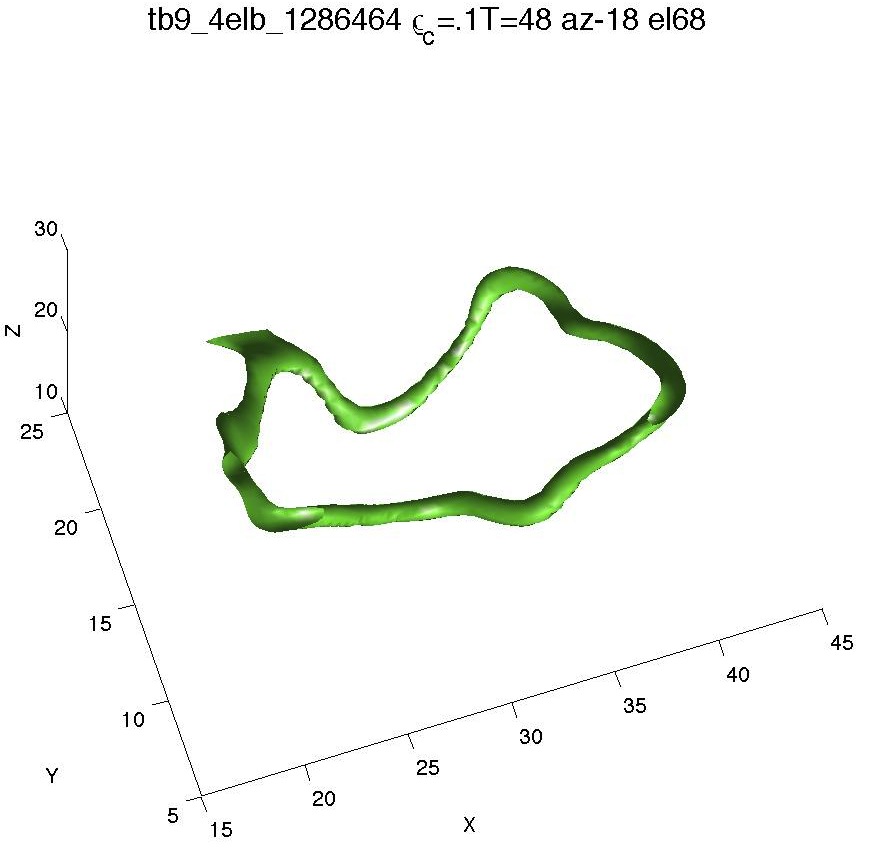
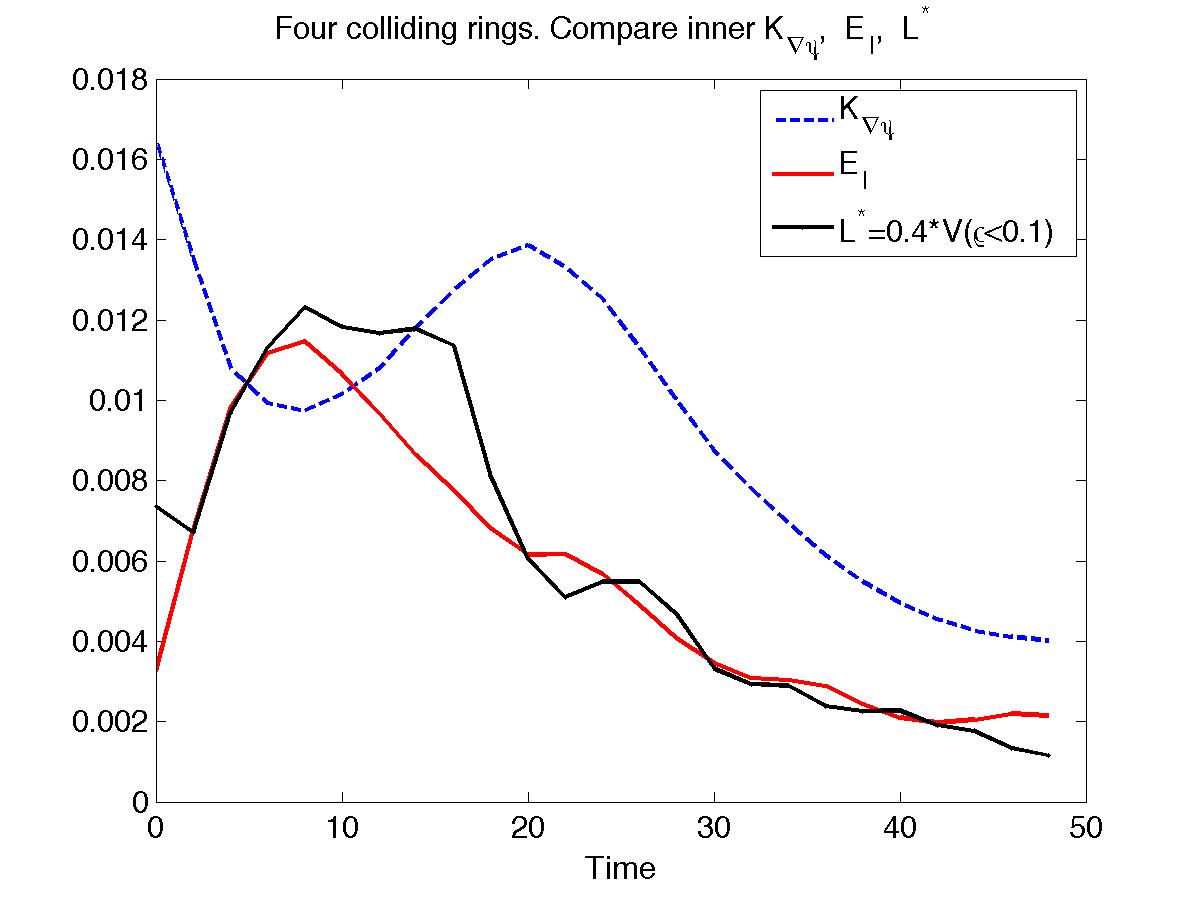
The best generalization of the anti-parallel calculations is to let four vortex rings collide, shown in Fig. V.3. These temporarily combine to produce of tangle of wavy vortices, which breaks up into a variety of small rings that appear to evaporate (perhaps turning into phonons) and a large vortex ring. The large ring probably removes most of the original Hamiltonian.
Three figures show the initial condition, the state of maximum entanglement, and the final state of a single large vortex ring. If the initial state is envisaged as two anti-parallel pairs, to get the entangled state it was necessary that the separation between the pairs be the order of their radii, but not overlapping.
The fourth figure shows the time development of the kinetic and interaction energies. Again there is a strong initial transfer of energy from the kinetic to interaction components. The entangle time shown is roughly at the end of this process. After that, as structures start interacting with the boundaries, the interaction energy is converted back into kinetic energy. Line length analysis is needed as well as local analysis around the region of the initial interactions to determine if some of the trends observed in the anti-parallel case are repeated.
Before this is done, this case needs to be rerun, first with much higher resolution to see the details of the entangled state, then with a combination of higher resolution and larger domain to verify that the final state is not too strongly influenced by the boundary conditions.
There are similarities to the four ring case investigated by (Leadbeater et al., 2003). The four rings in that case are all oriented perpendicular to a common axis and have more symmetry than the case here. Resolution is also less than half that used here. Nonetheless, two primary wavy, vortices develop, plus smaller entities that appear to break down into waves.
VI Outlook
For many years, simulations of first Navier-Stokes turbulence (Kerr, 1985) have been able to generate spectra and turbulent structures, now getting 2 decades using up to mesh points (Kaneda et al., 2003). More recently it has become possible to do the same with the Gross-Piteavskii equations (Yepez et al, 2009).
However, there are no clear relations between the spectra and structures in any of these cases.
What would be particularly useful would be a single case, no matter how special, that could demonstrate a connection between vortex structures and the origin of the energy cascade.
There have been special cases in the past showing a possible connection between structures and spectra, for example the Lundgren vortex (Lundgren, 1982), but that case requires the existence of an imposed large scale stretching. More interesting would be a case that generates a flow of energy across scales that starts with individual structures.
The case presented here provides such an example, and with time we should be able to demonstrate most of the underlying steps in more general cases similar to the final example given. Even then, the value of the special anti-parallel case is that it will be easier to identify the dynamics.
Some of the dynamics discussed here have been noticed before as referenced above. This includes initial development where the length of the vortex lines grows, that is the existence of vortex stretching, the generation of waves on vortices, reconnection between lines and rings, and the determination of spectra.
New relations between some of the known properties are noted here. For example, waves following artificial reconnections in the Biot-Savart and local induction approximations have been seen, but waves on individual quantum vortices following reconnection have not been seen before. And from that, one can see is how those waves can lead to further reconnections, the formation of multiple rings, and an energy cascade. That is, this calculation provides, within the context of the equations for an ideal quantum fluid, a means by which waves on vortices can generate an energy cascade, a long-standing proposition for being the underlying source of the observed decay of quantum turbulence. And not requiring filament approximations of any type.
The results here suggest that even at higher temperatures the decay of the quantum fluid occurs independently of the normal fluid. To determine this numerically would require a model that could couple the quantum and normal fluid components of a superfluid. Currently a good microscopic theory of the normal fluid does not exist, so phenomenological models would have to suffice. We would want a model where the coupling went to zero as Holm (2001).
The final new analysis shows how the transformation of kinetic energy into interaction energy is associated with: First, vortex stretching. Then the formation of rings, followed by a signature of waves appearing in distributions. The formation of waves does not seem to be due to forcing of the background quantum fluid by the vortices and their reconnections, but instead originates from interactions between the stretched, reconnecting vortices.
VII Summary
The analysis of the dynamics or reconnecting anti-parallel quantum vortices has identified the following steps:
-
•
First, before vortex cores interact directly, Biot-Savart vortex dynamics of stretching, curvature and torsion dominates in a manner consistent with filament calculations and simulations of the classical, ideal Euler equations.
-
During this phase, kinetic energy is converted into interaction energy by the vortex stretching and growth in the line length.
-
•
Once the cores begin to interact, the dynamics of the Gross-Piteavskii equations takes over, with reconnection developing in the vacuum that forms between the pair.
-
•
Following the first reconnection event, vortex waves are emitted with properties similar to waves in the local induction approximation.
-
•
These waves propagate down the initial vortex and deepen.
-
•
After they have deepened enough, secondary reconnections occur and vortex rings form.
-
•
Near the time of the second reconnection, interaction energy pulled from the original kinetic energy is concentrated in the regions and spectra have a regime.
-
•
As the vortex rings fully separate, interaction energy continues to grow, now it appearing more on either side of , indicating either waves or rarefactions in the centers of the newly created rings.
-
•
During this stage, the high wavenumber spectra grow until spectra in two directions develop nearly -5/3 subranges.
-
•
All of these steps occur without any reduction in the global Hamiltonian.
The parting question posed by these calculations is to find out how much of this could be carried over to dynamics in the classical equations. One point of view could be that despite the differences between the two systems, because the vortices in GP are well-defined and there are no singularities, this might be a simpler system within which to identify some of the dynamics behind classical turbulence. To answer this, new classical calculations have begun with new initial conditions for the trajectories of vortex lines based on the calculations here.
Acknowledgments We acknowledge discussions and communications with C. Barenghi, M.E. Fisher, W.F. Vinen, A. Golov, D.P. Lathrop, T. Lipniacki, B. Svistunov. Partial support for this work was provided by the Leverhulme Foundation grant F/00 215/AC. Computational support was provided by the Warwick Centre for Scientific Computing. Acknowledge support of EU-COST Aerosols and Particles
References
- Alamri et al. (2008) S.Z. Alamri, A.J. Youd, and C.F. Barenghi, “Reconnection of superfluid vortex bundles” Phys. Rev. Lett. 101, 215302 (2008).
- Berloff (2004) N.G. Berloff,“Interactions of vortices with rarefaction solitary waves in a Bose-Einstein condensate and their role in the decay of superfluid turbulence” Phys. Rev. A 69, 053601 (2004).
- Berloff (2004) N.G. Berloff,“Padé approximations of solitary wave solutions of the Gross–Pitaevskii equation” J. Phys. A 37, 1617 (2004).
- Bewley et al. (2008) G.P. Bewley, M. S. Paoletti, K. R. Sreenivasan, and D. P. Lathrop, “Characterization of reconnecting vortices in superfluid helium” Proc. Nat. Aca. Sci. 105, 13707 (2008).
- Bradley et al. (2005a) D. I. Bradley, D. O. Clubb, S. N. Fisher, A. M. Guénault, R. P. Haley,, C. J. Matthews,, G. R. Pickett, V. Tsepelin and K. Zaki, “Decay of pure quantum turbulence in superfluid 3He-B.” Phys. Rev. Lett. 95, 035301 (2005).
- Bustamante and Kerr (2008) M.D. Bustamante and R.M. Kerr, “3D Euler about a 2D symmetry plane” Physica D 237, 1912 (2008).
- Feynman (1955) R.P. Feynman, “Applications of quantum mechanics to liquid helium” Progress in Low Temperature Physics I, 17 (1955).
- Hasimoto (1972) H. Hasimoto,“A soliton on a vortex filament” J. Fluid Mech. 51, 477 (1972).
- Holm (2001) D.D. Holm,arXiv:nlin.CD/0103040v1, “Renormalized HVBK dynamics for superfluid helium turbulence”(2001).
- Kaneda et al. (2003) Y. Kaneda, T. Ishihara, M. Yokokawa,K. Itakura and A. Uno, “Energy dissipation rate and energy spectrum in high resolution direct numerical simulations of turbulence in a periodic box.” Phys. Fluids 15, L21 (2003).
- Kerr (1981) R.M. Kerr, Theoretical investigation of a passive scalar such as temperature in isotropic turbulence.. (Ph.D. thesis, Cooperative Thesis No. 64, Cornell University and NCAR., 1981). This result was first noted by S. Patterson while director of the Scientific Computing Division at NCAR. It should be noted that this decay rate is not observed in classical experiments because it depends on having a fixed turbulent length scale that is the size of the container and does not remove energy. This is impossible in physical situations where there are always no-slip, dissipative boundaries.
- Kerr (1985) R.M. Kerr, “Higher order derivative correlations and the alignment of small–scale structures in isotropic numerical turbulence.” J. Fluid Mech. 153, 31 (1985).
- Kerr (1993) R.M. Kerr, “Evidence for a singularity of the three-dimensional incompressible Euler equations” Phys. Fluids A 5, 1725 (1993).
- Kerr (1996) R.M. Kerr, “Cover illustration: vortex structure of Euler collapse.” Nonlinearity 9, 271 (1996).
- Koplik and Levine (1993) J. Koplik and H. Levine,“Vortex reconnection in superfluid helium” Phys. Rev. Lett. 71, 1375 (1993).
- Kozik and Svistunov (2004) B. Kozik and B. Svistunov, “Kelvin-wave cascade and decay of superfluid turbulence” Phys. Rev. Lett. 92, 035301 (2004).
- Laurie et al. (2010) J. Laurie, V. S. L’vov, S. Nazarenko, and O. Rudenko, arXiv:0911.1733v2, “The interaction of Kelvin waves and the non-locality of the energy transfer in superfluids”(2010).
- Lipniacki (2000) T. Lipniacki, “Evolution of quantum vortices following reconnection” Eur. J. Mech. B. 19, 361 (2000).
- Lundgren (1982) T.S. Lundgren, “Kolmogorov two-thirds law by matched asymptotic expansion” Phys. Fluids 14, 638 (1982).
- Leadbeater et al. (2001) M. Leadbeater, T. Winiecki, D. C. Samuels, C. F. Barenghi, and C. S. Adams, “Sound Emission due to Superfluid Vortex Reconnections” Phys. Rev. Lett. 86, 1410 (2001).
- Leadbeater et al. (2003) M. Leadbeater, D. C. Samuels, C. F. Barenghi, and C. S. Adams, “Decay of superfluid turbulence via Kelvin-wave radiation” Phys. Rev. A 67, 015601 (2003).
- L’vov et al. (2007) V. S. L’vov, S. V. Nazarenko, and O. Rudenko, “Bottleneck crossover between classical and quantum superfluid turbulence” Phys. Rev. B 76, 024520 (2007).
- Maurer and Tabeling (1998) J. Maurer and P. Tabeling, “Local investigation of superfluid turbulence” Europhys. Lett. 43, 29 (1998).
- Nore et al. (1997) C. Nore, M. Abid, and M.E. Brachet, “Kolmogorov Turbulence in Low-Temperature Superflows” Phys. Rev. Lett. 78, 3896 (1997).; “Decaying Kolmogorov turbulence in a model of superflow” Phys. Fluids 9, 2644 (1997).
- Paoletti et al. (2008) M. S. Paoletti, M. E. Fisher, K. R. Sreenivasan, and D. P. Lathrop, “Velocity statistics distinguish quantum from classical turbulence” Phys. Rev. Lett. 101, 154501 (2008).
- Roche et al (2007) P.-E. Roche, P. Diribarne, T. Didelot,O. Francais, L. Rousseau, and H. Willaime, “Vortex density spectrum of quantum turbulence” Euro. Phys. Lett. 77, 66002 (2007).
- Schwarz (1978) K.W. Schwarz, “Turbulence in superfluid helium: Steady homogeneous counterflow” Phys. Rev. B 18, 245 (1978).
- Schwarz (1985) K.W. Schwarz, “Three-dimensional vortex dynamics in superfluid 4He: Line-line and line-boundary interactions” Phys. Rev. B 31, 5782 (1985).
- Schwarz (1988) K.W. Schwarz, “Three-dimensional vortex dynamics in superfluid 4He: Homogeneous superfluid turbulence” PRB 38, 2398 (1988).
- Schwarzschild (2010) B. Schwarzschild, “Three-dimensional vortex dynamics in superfluid 4He: Homogeneous superfluid turbulence” Phys. Today July 2010, 12 (2010).
- Smith et al. (1993) M. R. Smith, R. J. Donnelly, N. Goldenfeld, and W. F. Vinen,“Decay of vorticity in homogeneous turbulence” Phys. Rev. Lett. 71, 2583 (1993).
- Svistunov (1995) B.V. Svistunov, “Superfluid turbulence in the low-temperature limit” PRB 52, 3647 (1995).
- (33) K.W. Schwarz and R.J. Donnelly, “Quantized Vortex Rings in Rotating Helium II” Phys. Rev. Lett. 17, 1088 (1966).
- Walmsley and Golov (2008) P.M Walmsley and A.I. Golov, “Quantum and Quasiclassical Types of Superfluid Turbulence” Phys. Rev. Lett. 100, 245301 (2008).
- Yepez et al (2009) J. Yepez, G. Vahala, L. Vahala, and M. Soe, “Superfluid Turbulence from Quantum Kelvin Wave to Classical Kolmogorov Cascades” Phys. Rev. Lett. 103, 084501 (2009).