STATUS OF CKM ANGLE MEASUREMENTS,
A REPORT FROM BABAR AND BELLE
I will review the latest developments in determining the -violating phases of the CKM matrix elements from measurements by the BaBar and BELLE experiments at the high-luminosity factories (PEP-II and KEKB). The emphasis will be on the angle of the Unitarity Triangle, which is the relative phase , or the -violating phase of the transition in the commonly used Wolfenstein convention.
1 Introduction
Only 8 years after the experimental discovery of violation , Kobayashi and Maskawa noted in a seminal paper that extending the quark sector to 3 generations would naturally introduce a violating phase in weak interactions. The BaBar and BELLE experiments and the high-luminosity factories (PEP-II and KEKB) at the SLAC National Accelerator Laboratory and KEK were designed and built with the primary goal of performing the first precision tests of the Kobayashi-Maskawa theory using asymmetry measurements in decays. The unitarity constraint involving the and columns of the CKM quark mixing matrix is often visualized as a triangle (“The Unitarity Triangle”) in the complex plane. The asymmetry measurements from BaBar and BELLE can be directly related to the interior angles of the Unitarity Triangle with little theoretical uncertainty .
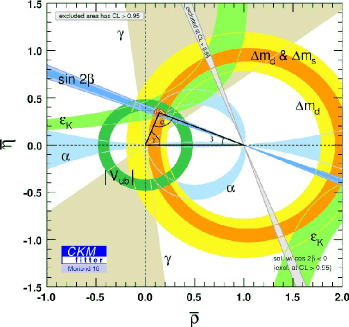
The current experimental constraints on the Wolfenstein parameters and , which give the coordinates of the tip of the rescaled Unitarity Triangle in the complex plane, are shown in Figure 1. The analysis was done by two independent groups using different statistical approaches (frequentist for CKMfitter and Bayesian for UTfit ). However, the conclusions are the same – the violation parameters of the CKM matrix are overconstrained and the Kobayashi-Maskawa theory has been experimentally confirmed. Kobayashi and Maskawa were awarded half of the 2008 Nobel Prize in physics.
The constraint on the angle (or ), from the amplitude of the proper-time-dependent asymmetry of and other decays, is the strongest, with a one standard deviation uncertainty of less than one degree. The most difficult angle to measure is (or ). Recent progress has been made over the past year in improving our measurements of and I will focus on this for the rest of this writeup.

2 Methods for measuring (or )
The angle can be measured from direct violation in decays where both and decay amplitudes contribute to the same final state and interfere with each other. The methods that currently give the strongest constraints on use decays of the type (from a decay) with (from a decay) where the decays to a final state that is accessible from both the and the . These are both tree level decays, so the interpretation of the measurements in terms of is theoretically extremely clean. However, the ratio of the hadronic decay amplitudes and the -conserving (strong) phase difference between and can not be calculated with precision and must be experimentally determined. In addition to , all of the various methods share the same hadronic parameters ( and ). Decays of the type and may also be used with each distinct decay having its own and .
The precision of the current measurements is limited due to two factors. First, the signal samples of are relatively small (at most 100’s of events) due to CKM suppression of the decay amplitudes. The second factor is that is relatively small (about 0.10 due to CKM and color suppression) which limits the size of the interference that we are trying to measure.
3 The , decay Dalitz approach
The best individual measurements of come from using a 3-body decay (either or ) in the method. The amplitude () and -conserving phase of the decay varies accross the decay Dalitz plot, which is the decay intensity in the plane of vs . Assuming no violation in decays, the Dalitz plot is the same as the the Dalitz plot after reflection through the diagonal, i.e. . The parameters of a decay Dalitz amplitude model are determined from the data by fitting a very clean, high statistics sample of flavor-tagged mesons from decays produced in events. The overall amplitudes for the processes ; are given by
| (1) | |||||
| (2) |
where the first term is from the transition and the second is from the transition. The relative weight of the two terms, both in magnitude and -conserving phase, is known from , apart from an overall factor of that is experimentally determined in the data analysis.
3.1 The , decay Dalitz data samples
Both BaBar and BELLE have shown updates to their measurements using the decay Dalitz technique in the past year. The BaBar collaboration has analyzed their full dataset, which contains 468 million events , while the Belle collaboration has shown results using 657 million events . The BaBar results with their full dataset were shown for the first time in this talk. Both the BaBar and BELLE analyses have been submitted for publication and are still preliminary. Both experiments have done the analysis for the following three decays: , , and using the decay mode. The BaBar analysis also includes results using .
The signal is separated from combinatoric background using two standard reconstruction variables in the center of mass frame: and . Continuum () background is rejected using event shape variables that are combined in an optimal linear combination (Fisher discriminant). These shape variables take advantage of the fact that the decay products in events are fairly isotropic, while continuum events have a preferred direction along the axis. Large data control samples, where the amplitude is more suppressed with respect to the transition (), are used to calibrate and validate the analysis methods.
The Dalitz model parameters are determined from large, clean, flavor-tagged charm samples from continuum production. The Dalitz models in the BaBar and BELLE analyses are not the same. The main differences are in the treatment of the S-wave components. Babar uses a K-matrix formalism with the P-vector approximation and 5 poles for the S-wave and a LASS model consisting of a resonance together with a coherent non-resonant contribution parameterized by a scattering length and an effective range for the S-wave. BELLE includes and scalar resonances and a for the S-wave. Details of the Dalitz models can be found in the preprints describing the measurements.
Table 1 gives the signal yield for the samples used in the final fits for the parameters (described below). The BaBar signal efficiencies have improved substantially (20% to 40% relative) with respect to the previous BaBar analysis, which used 383 million events , coming mainly from reprocessing the data with improved track reconstruction and particle identification.
| decay mode | BELLE () | BaBar () | BaBar () |
|---|---|---|---|
| 657 M | 468 M | 468 M | |
3.2 The , decay Dalitz analysis
The parameters are determined using unbinned maximum likelihood fits. Probability density functions in the likelihood depend on , , continuum rejection variables, and the Dalitz plot position. The interference terms in the intensity are proportional to
| (3) |
The Cartesian parameters are free parameters in the fits. They are used rather than , , and directly because they are uncorrelated with Gaussian uncertainties.
The full results of the fits can be found in the BaBar and BELLE preprints and averages are available through HFAG . Table 2 gives the and results for the mode as an example to give you an idea of the measurement precision and the consistency of the two measurements. The BaBar and BELLE results are consistent with each other. The BaBar statistical errors are lower due to the higher signal statistics (see Table 1). The degree to which the and are inconsistent with zero is the significance of the transition, while the degree to which and is the significance of the violation.
| parameters for , | ||
|---|---|---|
| Parameter | BaBar | BELLE |
| (%) | ||
| (%) | ||
| (%) | ||
| (%) | ||
The interpretation of selected and measurements is given in Table 3. Each experiment independently finds a value of close to around , which is consistent with indirect determinations of within the framework (see Figure 1 and refs ). Each experiment rules out conservation with a significance of 3.5 standard deviations. The Belle experiment favors a larger contribution to the decay (larger ), which leads to a smaller statistical uncertainty on , though the BELLE and BaBar measurements are not incompatible. Both the BaBar and BELLE measurements are statistics limited.
One noteworthy difference between the BaBar and BELLE measurements is the uncertainty from the Dalitz model, which is for BaBar and for BELLE. The BaBar analysis and mixing analysis used the same Dalitz model and the same model variations in the evaluation of the systematic uncertainties. The Dalitz model systematic errors are not negligible in the mixing analysis, so the Dalitz model and model variations were refined and reconsidered, with respect to the initial BaBar decay Dalitz analysis . This Dalitz model work, motivated by the requirements of the mixing analysis, was propagated back into the analysis, which lead to the substantial improvement in the model systematic uncertainty on . In the future, LHCb and super factories will have much larger datasets, making model independent approaches feasible.
| Parameter | BaBar | BELLE |
|---|---|---|
| , | ||
| , | ||
| , | ||
| , |
4 The “ADS” approach for
The so-called “ADS” method (for Atwood, Dunietz, and Soni ) for determining maximizes the size of the interference term with a clever choice of final state. The favored transition from is combined with the suppressed transition from . This interferes with the suppressed transition from followed by the favored transition from . Since both paths to the final state involve a CKM favored transition combined with a CKM suppressed transition, the paths have roughly equal amplitudes. This means the direct asymmetry can be quite large (of order 1) but you pay a heavy price in signal statistics due to the CKM suppression. This method is quite sensitive to the amplitude ratio , which is common with the other methods, such as the decay Dalitz method above.
Both BaBar and BELLE have searched for . The BaBar collaboration recently released a preliminary version of their analysis using the full dataset of 468 million events. Unlike previous searches from both experiments, the new BaBar analysis sees the first signs of ADS signals in and . Figure 2 shows the distributions separately for and . Comparing the and distributions, a large asymmetry is evident.
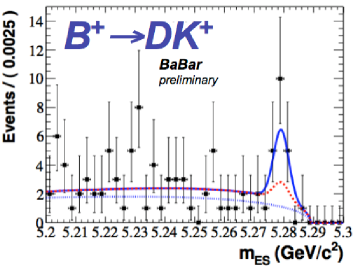
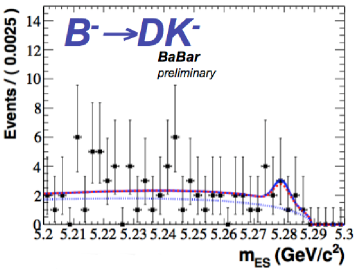
The interpretation of the ADS rate and asymmetry gives and for and respectively and constraints on , , and that are consistent with the decay Dalitz measurements.
5 Summary and future prospects
The CKM parameters are now over constrained. All violation measurements made thus far are consistent with the Kobayashi-Maskawa mechanism of the Standard Model. The factory experiments, BaBar and BELLE, have made recent progress on the most difficult Unitarity Triangle angle to measure: or . Unlike other angle measurements, from involves only tree-level processes, which make the interpretation very clean theoretically, providing a solid Standard Model reference. However, our experimental constraints on from are still relatively weak and statistics limited. The analysis of all experimental constraints by the UTfit and CKMfitter collaborations gives and , respectively.
Looking ahead, the LHCb experiment will make substantial progress on using decays, taking advantage of the huge production cross section in collisions to address the current limitation, which is signal statistics. The high statistics will make model-independent decay Dalitz approaches viable, removing the dependence on the Dalitz amplitude model assumptions. A super factory could also turn into a precision measurement.
Acknowledgments
I would like to thank Fernando Martinez-Vidal and Anton Poluektov for providing details of the BaBar and BELLE , decay Dalitz analyses and advice on how to best present the measurements, Tim Gershon for the HFAG averages, and Vincent Tisserand and Achille Stocchi for providing the CKMfitter and UTfit analysis results. I would also like to thank Alex Bondar for some interesting conversations in LaThuile about the material in these proceedings.
References
References
- [1] J.H. Christenson, J.W. Cronin, V.L. Fitch, and R. Turlay, Phys.Rev.Lett. 13, 138 (1964).
- [2] M. Kobayashi and T. Maskawa, Prog.Theor.Phys. 49, 652 (1973).
- [3] See D. Kirkby and Y. Nir in the 2008 PDG RPP: C. Amsler et al. (Particle Data Group), Phys.Lett. B667, 1 (2008).
- [4] J. Charles et al. [The CKMfitter Collaboration], Eur. Phys. J. C41, 1 (2005). See also http://ckmfitter.in2p3.fr/.
- [5] M. Ciuchini et al., [The UTfit Collaboration], JHEP 0107, 013 (2001). See also http://www.utfit.org/.
- [6] M. Gronau and D. London, Phys. Lett. B253, 483 (1991).
- [7] D. Atwood, I. Dunietz, and A. Soni, Phys. Rev. Lett. 78, 3257 (1997); Phys. Rev., D63, 036005 (2001).
- [8] A. Giri, Y. Grossman, A. Soffer, and J. Zupan, Phys. Rev. D68, 054018 (2003); A. Bondar, unpublished.
- [9] P. del Amo Sanchez, et al. [The BaBar Collaboration], [arXiv:1005.1096], submitted to Phys. Rev. Lett.
- [10] A. Poluektov, et al. [The BELLE Collaboration], [arXiv:1003.3360], submitted to Phys. Rev. D.
- [11] P. del Amo Sanchez, et al. [The BaBar Collaboration], [arXiv:1004.5053], submitted to Phys. Rev. Lett.
- [12] For averages of the BaBar and BELLE observables, please see http://www.slac.stanford.edu/xorg/hfag/triangle/moriond2010.
- [13] B. Aubert et al., [The BaBar Collaboration], Phys. Rev. D78, 034023 (2008); Phys. Rev. Lett. 95, 121802 (2005).
- [14] A. Bondar and A. Poluektov, Eur. Phys. J. C 47, 347 (2006); Eur. Phys. J. C 55, 51 (2008).
- [15] For more on the role of measurements made using events for the model-independent decay Dalitz methods for , see Peter Onyisi in these proceedings.