Non-invasive vibrational mode spectroscopy of ion Coulomb crystals through resonant collective coupling to an optical cavity field
Abstract
We report on a novel non-invasive method to determine the normal mode frequencies of ion Coulomb crystals in traps based on the resonance enhanced collective coupling between the electronic states of the ions and an optical cavity field at the single photon level. Excitations of the normal modes are observed through a Doppler broadening of the resonance. An excellent agreement with the predictions of a zero-temperature uniformly charged liquid plasma model is found. The technique opens up for investigations of the heating and damping of cold plasma modes, as well as the coupling between them.
pacs:
37.30.+i,52.27.Gr,37.10.Vz,52.27.Jt,42.50.PqCold one-component plasma physics dubin99 has in the past two decades led to a series of interesting results due to the availability of fast computers schiffer96 ; schiffer00 ; totsuji02 ; matthey03 as well as the possibility to experiment with ensembles of trapped, laser-cooled atomic ions itano98 ; bollinger98 ; wineland87 ; walther92 ; drewsen98 ; mortensen06 ; mortensen07 ; heinzen91 ; bollinger93 ; mitchell98 ; jensen05 . Prominent examples are the understanding of structural properties of crystallized cold plasmas in both Penning itano98 ; bollinger98 and Paul wineland87 ; walther92 ; drewsen98 ; mortensen06 ; mortensen07 traps, and the investigation of the normal mode dynamics of cold magnetized plasmas in Penning traps heinzen91 ; bollinger93 ; mitchell98 ; jensen05 . While there exist many similarities between experiments in Penning and Paul traps, the unmagnetized plasmas in Paul traps are e.g. known to heat up much faster than the magnetized plasmas in Penning traps due to the presence of the rf fields blumel89 ; schiffer00 . The lack of a rotational symmetry axis in Paul traps has as well been found to be responsible for the observation of specific crystalline structures mortensen07 . Exploration of the normal mode dynamics of unmagnetized ion Coulomb crystals in e.g. linear Paul traps will hence add to our understanding of the influence of the trapping environment on the physics of such crystals. Furthermore, since large Coulomb crystals are excellent candidates for the realization of high-fidelity quantum memories for light herskind09 , such studies can shed light on the influence of the excitation of these modes on the fidelity as well as on the prospect of storing several photonic quantum bits through deliberate excitations of specific vibrational modes. Larger Coulomb crystals have as well recently been considered as a system for performing quantum simulations, in which respect knowledge of normal mode dynamics is needed porras04 . Finally, ion Coulomb crystals represent extremely interesting systems to study cavity optomechanics phenomena murch08 ; brenneke08 , since, in spite of their solid nature, they possess free atomic resonance properties and can hence be made very sensitive to the radiation pressure force exerted by optical fields.
In this Letter, we report on the study of normal mode vibrations of Coulomb crystals of 40Ca+ ions in a linear Paul trap by a novel non-invasive technique. The technique is based on monitoring the coherent collective resonant response of the atomic ions constituting the crystal to a single photon optical cavity field herskind09 . By having a standing wave optical cavity incorporated in the trap setup with the light propagation axis coinciding with the rf-field free axis of the trap, we can detect very small changes in the optical response due to Doppler shifts resulting from the ions’ motion along the cavity axis when a mode is excited. Since the probing does not rely on the observation of incoherently scattered photons as e.g. the case in Doppler velocimetry heinzen91 ; bollinger93 ; mitchell98 and in Sympathetically-Cooled Single Ion Mass Spectrometry drewsen04 , the detected signal can in principle be purely dispersive in nature and does not require any excitation of the ions. The technique is not limited to linear Paul traps, but should work as well in any open structured trap geometries such as e.g. the Penning-Malmberg type traps driscoll88 ; heinzen91 .
Previous Doppler velocimetry imaging experiments with cold magnetized plasmas of Be+ ions in a Penning trap have led to the identification of a series of normal modes heinzen91 ; bollinger93 ; mitchell98 , which correlate to specific -modes theoretically predicted for spheroidal shaped uniformly charged liquids dubin91 . For the cold unmagnetized plasmas in the linear Paul trap used in our investigations, the corresponding low-order normal mode frequencies are expected to be close to those of the modes, which are given by dubin91
| (1) |
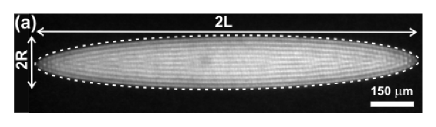
where is the plasma frequency (q is the charge of the ion, M its mass and the uniform ion density), and are first and second-order Legendre polynomials with cylindrical indices and with the prime denoting differentiation with respect to the entire argument. Finally, is the aspect ratio of the plasma given by , where and are the half-length and radius of the spheroid, respectively (see also Fig. 2a).
The corresponding spatial structure of the modes can generally be expressed in terms of generalized spheroidal coordinates dubin96 . While the modes generally have a non-trivial dependence on the ions’ position in the crystal, for longitudinal modes (), the displacement , close () to the axis of rotational symmetry (-axis), is approximately given by
| (2) |
Consequently, all modes with have a spatial variation along the -axis which, under excitation, will lead to measurable Doppler-shifts of the ions resonance frequency along this axis.
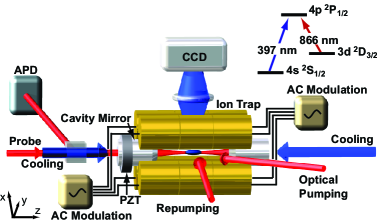
Figure 1 shows a schematic of the experimental setup for our studies (a more detailed description of the cavity-trap setup can be found in Ref. herskind08 ). The linear Paul trap consists of four cylindrical electrodes to which an rf voltage between 200 V and 300 V is applied at a frequency of 24 MHz for radial confinement (-plane in Fig. 1). To obtain a linear quadrupole configuration, the rf voltages are out of phase between nearest neighbor electrodes. Each of the four electrodes are sectioned into three parts to allow for the application of DC (1-10 V) and AC voltages to the eight end-pieces for static confinement of the ions along the cavity axis (-axis) and for normal mode excitations, respectively. The electrodes have diameters of mm and the nearest neighbour electrode spacing is mm. With these parameters, the single ion effective (pseudo) potential is to a very good approximation harmonic in all dimensions in the region of the crystals, which leads to constant densities of the crystallized 40Ca+ ions with values between and cm-3 herskind09b .
The 40Ca+ ions are produced through isotope selective photoionization of atoms in a beam of natural abundant calcium mortensen04 ; herskind08 . The Coulomb crystals are created through Doppler laser-cooling along the trap axis by two counter-propagating beams at 397 nm (total power of mW and beam diameter of 1 mm) and an 866 nm beam applied from the side to prevent the ions from being shelved into the D3/2 state (see insert of Fig. 1). The number of ions constituting the crystals can be deduced by imaging the light (397 nm) scattered by the ions during the cooling process onto a charge coupled device (CCD) chip herskind08 .
Normal modes of the ion Coulomb crystals can be excited by applying identical AC electrical potentials at variable frequency to the four end-pieces at each end of the trap. By this simple geometry modes corresponding to the charged liquid modes can easily be excited by having the voltages applied at each end either in-phase ( even) or 180∘ out of phase ( odd).
To monitor the coherent collective resonant response of the atomic ions constituting the crystal, a 11.8 mm-long optical cavity with a measured TEM00 mode waist of 37 m is used herskind08 . The optical finesse of the cavity is about 3,000 at the 866nm resonant wavelength of the 3d 2D3/2 - 4p 2P1/2 transition in the 40Ca+ ion addressed in the experiments.
The plasma mode diagnostic involves a sequence of steps. First, a Doppler cooling period of 5 s is followed by a period of 12 s, where the ions in the crystal are prepared in the magnetic sub-state of the long-lived metastable D3/2 level by optical pumping (efficiency ). Next, a weak left-handed circularly-polarized pulse (1.4 s long) of 866 nm light is coupled into the cavity to probe the collective response of the ions. The mean intracavity photon number is less or about one at any time. During this probing period, the photons reflected by the cavity are measured by an avalanche photodiode with an overall collection efficiency of 16%. This sequence is repeated at a rate of 50 kHz while the cavity length is scanned at a rate of 30 Hz. The cavity lineshape is reconstructed by averaging a few hundred scans (see herskind09 for more details).
With the ion Coulomb crystal at rest, the cavity probe linewidth is given by herskind09 :
| (3) |
where is the cavity decay rate, the collective coupling rate, the optical dipole decay rate and the detuning of the probe with respect to atomic resonance. If the crystal is moving with a fixed velocity along the cavity axis the probe linewidth would due to the Doppler shift be given by
| (4) |
where is the wavevector of the cavity field.
When exciting one of the normal modes, all the ions in the crystal will generally not have the same velocity at a given instance (this is only true for the center-of-mass mode, see Eq. (2)), and, furthermore, the velocity of the individual ions will change during the mode-period. However, if the timescale at which the velocity of the individual ions changes is slow as compared to the effective cavity photon decay time, one can model the expected probe lineshape by averaging the contributions from the different parts of the crystal over a single mode-oscillation period. From Eqs. (3) and (4) it follows that any excitation of the ions’ motion will generally lead to a narrower linewidth due to the reduced coupling strength.
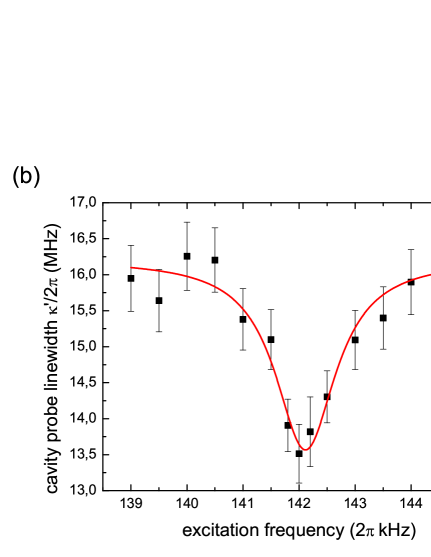
Fig. 2b shows the cavity probe linewidth for =0 as a function of the modulation frequency applied to excite the equivalent of the “quadrupole” mode of a 1.2 mm-long crystal with 4000 ions at a density cm-3 (Fig. 2a). A clearly reduced linewidth is observed around 142 kHz. The exact resonance value of kHz is in good agreement with the resonance frequency kHz expected for the mode of a charged liquid crystal for this aspect ratio and charge density.
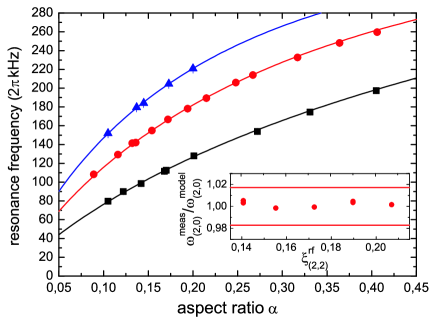
In order to test more generally how well the uniformly charged liquid model describes unmagnetized ion plasmas confined in a linear Paul trap, the resonance frequencies of the lowest lying normal modes of ion crystals with various aspect ratios have been determined by monitoring the linewidth of the cavity probe field when tuned to the atomic resonance. The resulting mode resonance frequencies are presented in Fig. 3 together with the predicted values from the charged liquid model (see Eq. (1)). The measured values are consistent with the theory to better than one percent for all experimental data. This accuracy may appear quite surprising considering that during all these mode measurements, the mode is continuously off-resonantly excited by the linear rf quadrupole field confining the plasma. The rf-induced modulation depth is indeed up up to 20% of the radial extension of the crystal, i.e. comparable to that typically used for the axial excitation of the modes. The inset of Fig. 3 clearly shows, however, that, within the current experimental accuracy, the mode frequency does not have any systematic dependence on the mode modulation depth , defined by the micromotion amplitude of an ion at the radial position . This result is though consistent with molecular dynamics simulations from which it has been predicted that the radial rf field-driven micromotion in linear Paul traps should have an extremely weak coupling into the axial motion of the ions schiffer00 .
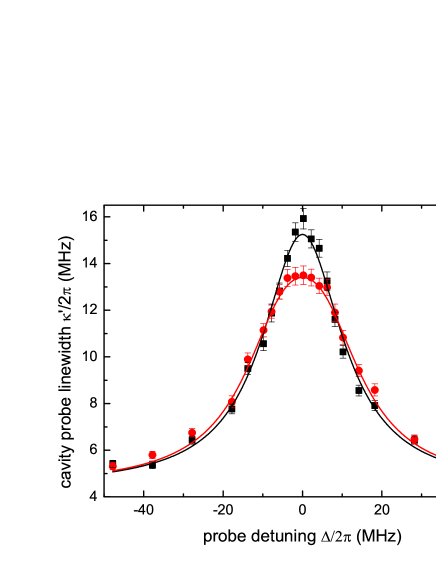
In Fig. 4, the cavity probe linewidth with and without exciting the mode at the resonance frequency kHz is presented as a function of the detuning of the probe with respect to the atomic resonance. From the Lorentzian line profile in absence of the mode excitation, one finds MHz. When the mode is excited, the absorption line is substantially modified to a non-Lorenzian profile. A fit based on the mode function (Eq. (4)) averaged over one oscillation period results in a driven motion amplitude m/s (). This value is in good agreement with the value m/s deduced from fluorescence images recorded in phase with the modulation voltage. Here, a motional amplitude m was measured at the mode resonance frequency kHz. Since equally good quantitative agreement between experiments and the model was also found for the mode, this proves that quantitative information about the ions’ motion can reliably be obtained from the ion-cavity coupling without the need for observing directly the fluorescence signal.
In the future, higher order modes are envisioned to be studied through mode excitations using spatial- and time-modulated radiation pressure forces. For 40Ca+ ions this can e.g. be achieved through the combined application of a 866 nm repumper beam with a spatially modulated intensity profile along the cavity axis and a time-varying intensity of one of the 397 nm cooling beams drewsen04 . Eventually, for the high spatial modulation of modes with large , the liquid model should cease to apply. Further applications could be measurements of ion Coulomb crystal temperatures and heating rates jensen05 and more detailed investigations of the coupling between the various normal modes at various temperatures and structural phases of the plasma dubin96 ; schiffer96 . Finally, we also believe that the spectroscopic findings as well as the non-invasive character of the method used will be important for e.g. observing radiation pressure-induced optomechanical effects murch08 ; brenneke08 with ion Coulomb crystals.
We acknowledge financial support from the Carlsberg Foundation and
the Danish Natural Science Research Council through the ESF EuroQUAM
project CMMC.
References
- (1) D. H. E. Dubin and T. M. O’Neil, Rev. Mod. Phys. 71, 87 (1999).
- (2) D. H. E. Dubin and J. P. Schiffer, Phys. Rev. E 53, 5249 (1996).
- (3) J. P. Schiffer, M. Drewsen, J. F. Hangst, and L. Hornekær, Proc. Natl. Acad. Sci. USA 97, 10697 (2000).
- (4) H. Totsuji, T. Kishimoto, C. Totsuji, and K. Tsuruta, Phys. Rev. Lett. 88, 125002 (2002).
- (5) T. Matthey, J. P. Hansen, and M. Drewsen, Phys. Rev. Lett. 91, 165001 (2003).
- (6) W. M. Itano, J. J. Bollinger, J. N. Tan, B. Jelenković, X.-P. Huang, and D. J. Wineland, Science 279, 686 (1998).
- (7) T. B. Mitchell, J. J. Bollinger, D. H. E. Dubin, X.-P. Huang, W. M. Itano, and D. J. Wineland, Science 282, 1290 (1998).
- (8) D. J. Wineland, J. C. Bergquist, W. M. Itano, J. J. Bollinger, and C. H. Manney, Phys. Rev. Lett. 59, 2935 (1987).
- (9) G. Birkl, S. Kassner, and H. Walther, Nature 357, 310 (1992).
- (10) M. Drewsen, C. Brodersen, L. Hornekær, J. S. Hangst, and J. P. Schiffer, Phys. Rev. Lett. 81, 2878 (1998).
- (11) D. J. Heinzen, J. J. Bollinger, F. L. Moore, W. M. Itano, and D. J. Wineland, Phys. Rev. Lett. 66, 2080 (1991).
- (12) J. J. Bollinger, D. J. Heinzen, F. L. Moore, W. M. Itano, D. J. Wineland, and D. H. E. Dubin, Phys. Rev. A 48, 525 (1993).
- (13) T. B. Mitchell, J. J. Bollinger, X.-P. Huang, and W. M. Itano, Optics Express 2, 314 (1998).
- (14) M. J. Jensen, T. Hasegawa, J. J. Bollinger, and D. H. E. Dubin, Phys. Rev. Lett. 94, 025001 (2005).
- (15) A. Mortensen, E. Nielsen, T. Matthey, and M. Drewsen, Phys. Rev. Lett. 96, 103001 (2006).
- (16) A. Mortensen, E. Nielsen, T. Matthey, and M. Drewsen, J. Phys. B 40, F223 (2007).
- (17) R. Blümel, C. Kappler, W. Quint, and H. Walther, Phys. Rev. A 40, 808 (1989).
- (18) P. F. Herskind, A. Dantan, J. P. Marler, M. Albert, and M. Drewsen, Nature Phys. 5, 494 (2009).
- (19) D. Porras and J. I. Cirac, Phys. Rev. Lett. 92, 207901 (2004); ibid. 96, 250501 (2006).
- (20) K. W. Murch, K. L. Moore, S. Gupta, and D. M. Stamper-Kurn, Nature Phys. 4, 561 (2008).
- (21) F. Brenneke, S. Ritter, T. Donner, and T. Esslinger, Science 322, 235 (2008).
- (22) M. Drewsen, A. Mortensen, R. Martinussen, P. Staanum, and J. L. Sørensen, Phys. Rev. Lett. 93, 243201 (2004).
- (23) C. F. Driscoll, J. H. Malmberg, and K. S. Fine, Phys. Rev. Lett. 60, 1290 (1988).
- (24) D. H. E. Dubin, Phys. Rev. Lett. 66, 2076 (1991).
- (25) D. H. E. Dubin, Phys. Rev. E 53, 5268 (1996).
- (26) P. F. Herskind, A. Dantan, M. B. Langkilde-Lauesen, A. Mortensen, J. L. Sørensen, and M. Drewsen, Appl. Phys. B 93, 373 (2008).
- (27) P. F. Herskind, A. Dantan, M. Albert, J. P. Marler, and M. Drewsen, J. Phys. B 42, 154008 (2009).
- (28) A. Mortensen, J. Lindballe, I. S. Jensen, P. Staanum, D. Voigt, and M. Drewsen, Phys. Rev. A 69, 042502 (2004).