Shintake Monitor in ATF2 : Present Status
Abstract
A beam size monitor so called Shintake monitor, which uses the inverse Compton scattering between the laser interference fringe and the electron beam was designed for and installed at ATF2. The commissioning at ATF2 was started in the end of 2008 and succeeded in the measurement of the fringe pattern from the scattered gamma-rays. The present status of the Shintake monitor is described here.
1 Overview
1.1 ATF2
The Accelerator Test Facility (ATF) was constructed at KEK in Japan to achieve small vertical emittance needed for ILC. The performance of damping ring has been studied here. ATF2 was constructed as an extension of ATF to test the ILC beam delivery system including the final focusing scheme[2]. By using small emittance beam provided from ATF damping ring, ATF2 aims to focus the vertical beam size to 37 nm at the virtual interaction point.
1.2 Shintake Monitor
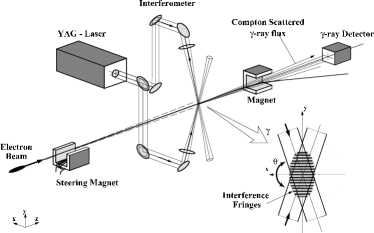
Shintake monitor is a beam size monitor for the electron beam utilizing the laser interference fringe pattern, which was originally designed by T Shintake for the FFTB experiment at SLAC[3]. Figure 1 shows the schematic of Shintake monitor. The laser light is split and crossed at the interaction point of electron beam. The electron beam passes through the interference fringe pattern formed at the interaction point and the inverse Compton scattering occurs. If the beam size is small relative to the fringe pitch, the number of scattered photons at the peak of fringe and that at the valley of the fringe differ significantly. On the other hand, if the beam size is comparable to the fringe pitch, the electron beam interact with the the peak and valley at the same time. Then the numbers of scattered photons do not change so much.
Define the modulation depth as follows,
| (1) |
where is the measured maximum number of photons and is the measured minimum number of photons when the relative position between the electron beam and the laser interference fringe is moved. Then this modulation depth becomes the function of the electron beam size and can be expressed by the following equation.
| (2) |
where is the crossing angle between the two laser lights, is the wave number of the interference fringe in vertical and the is the vertical electron beam size.
2 Components of Shintake Monitor
wavelength 532 nm line width 0.003 cm-1 repetition rate 6.25 Hz pulse width 8 ns (FWHM) timing jitter 1 ns (RMS) pulse energy 1.4 J
Shintake monitor is composed of mainly the following three parts.
-
•
Laser system
-
•
Laser optics
-
•
Gamma-ray Detector
2.1 Laser System
In Shintake monitor at ATF2, 2nd harmonics of a pulsed Nd:YAG laser (PRO350, SpectraPhysics) is used. Specification of the laser is listed in Table 1
2.2 Laser Optics
The purposes of the laser optics are
-
1.
transport the laser light to the beam line
-
2.
split the laser light
-
3.
cross the laser lights at the interaction point of the electron beam
-
4.
move the interference fringe
The measurable beam size range of Shintake monitor is very limited because it cannot measure the beam larger than the half of the fringe pitch. Therefore we prepare 3 types of the laser crossing angles to widen the measurable range[5]. The fringe pitch can be changed by switching the laser crossing angles according to the current beam size.
The position of the interference fringe is moved by changing the relative phase between two split laser lights. The intensity of the laser interference fringe at the interaction point can be written by
| (3) |
where is the coordinate in the vertical direction, definition of and are same as Equation (2), is the relative phase between two interfering laser lights. For this purpose the piezoelectric stage (P-752.21C, PI) which has 0.2 nm resolution is installed in the one of the laser light path. By moving the stage, the path length of one laser light change and hence the relative phase between two laser lights is changed. Further information can be found in [6].
2.3 Gamma-ray Detector
At the ATF2, the electron beam energy is 1.3 GeV. Then the average energy of gamma rays from the inverse Compton scattering between a electron in the beam and 532 nm wavelength laser photon is 15 MeV on average. The background gamma rays mainly come from the bremsstrahlung of the electron beam halo colliding the wall of beam pipe. This background gamma rays have broad spectrum from 1.3 GeV to lower energy.
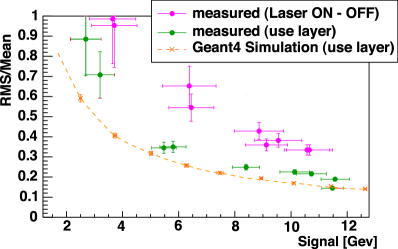
It is challenge to measure the signal gamma rays in such a high energy background condition. To solve this issue the multi-layer electromagnetic calorimeter is developed[7] which uses CsI(Tl) as a scintillator. Based on the fact that the shower depth in the calorimeter is shallower for lower energy signal gamma rays, multi-layer calorimeter is able to distinguish between lower energy signal and the higher energy background by measuring the shower development in the calorimeter. By using the energy deposit in each layer, the improvement of the signal resolution is observed. Figure 2 shows the comparison of the signal resolution obtained by two methods. ”Laser ON - OFF” means the total energy deposit in the calorimeter when the laser is on minus when the laser is off, ”user layer” means the signal obtained by the above method.
3 Measurement
3.1 Procedure
Beam size measurement is performed as follows.
-
1.
Adjust the laser pulse and the electron beam timing
-
2.
Scan the laser beam position perpendicular to the electron beam axis and find the position where the scattered gamma-ray signal become the maximum
-
3.
Move one laser beam position in the electron beam axis in small step and move the laser phase to find the position where two laser lights overlap.
-
4.
Repeat the these steps until the measured modulation depth reaches the maximum
The current beam size is obtained from the maximum modulation depth after these procedures. If the electron beam condition is changed, repeat these procedures from the top (if needed).
3.2 Result
Measured beam size so far is several microns with larger optics than the ATF2 base design (Table 2).
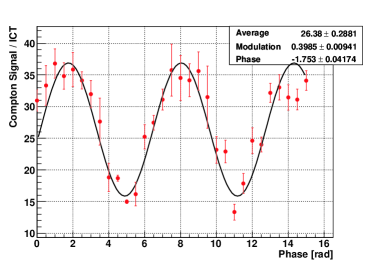
Figure 3 shows one of the plots of smallest beam size measurement. Measured plots become sinusoidal because the pattern of the laser fringe pitch can be written as Equation (3). The modulation depth is obtained by fitting this plot by a sinusoidal function and it was 0.40 in this measurement. The laser crossing angle was 2.7 degrees (in this case the fringe pitch was calculated to 11 m). Then the beam size is calculated to about 2.4 m by using Equation (2).
parameter present design horizontal function 4 cm 4 mm vertical function 1 mm 0.1 mm horizontal beam size 10 m(measured) 2.8 m vertical beam size 2.4 m(measured) 37 nm
3.3 Systematic Error
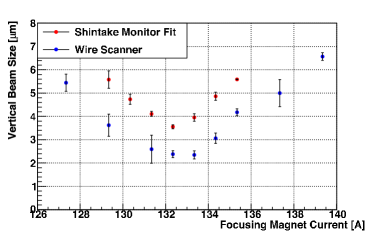
During the beam size measurement using Shintake monitor, the other conventional beam size monitor was also used to evaluate the systematic error of Shintake monitor. For this purpose a wire scanner (which is made of 10 m diameter tungsten wire) was installed at the same place. Its resolution limit is about 2.5 m.
4 Summary and Schedule
Shintake monitor at ATF2 is now ready for measurement and succeeded in the observation of the gamma-ray modulation from the inverse Compton scattering between the electron beam and the laser light. The measured vertical beam size is several microns because ATF2 runs with the large optics for the moment.
The current beam time will be continued until this June and smaller optics will be tested during this period. After the summer shutdown the optics will be shifted to the designed one and then, tuning of the accelerator and the measurement of 37 nm vertical beam size will be tried.
References
-
[1]
Slide
http://ilcagenda.linearcollider.org/contributionDisplay.py?contribId=58&sessionId=6&confId=4175 - [2] ATF2 Collaboration, ATF2 Proposal, KEK Report 2005-2 (2005)
- [3] T. Shintake, Nucl. Inst. and Meth. A311 (1992) 453.
- [4] T. Shintake, KEK Preprint 92-65 (1993)
-
[5]
Y. Kamiya et al., TILC09, Tsukuba, Japan (2009)
http://ilcagenda.linearcollider.org/contributionDisplay.py?contribId=112&sessionId=23&confId=3154 - [6] T. Suehara et al., Nucl. Inst. and Meth. A616 (2010) 1-8
- [7] M. Oroku et al., IEEE NSS Conference Record 2008, Dresden, Germany, pp. 2330-2334
-
[8]
Y. Yamaguchi, LCWS/ILC2010, Beijing, China (2010)
http://ilcagenda.linearcollider.org/contributionDisplay.py?contribId=59&sessionId=6&confId=4175