Galaxy Cluster Radio Relics in Adaptive Mesh Refinement Cosmological Simulations: Relic Properties and Scaling Relationships
Abstract
Cosmological shocks are a critical part of large-scale structure formation, and are responsible for heating the intracluster medium in galaxy clusters. In addition, they are also capable of accelerating non-thermal electrons and protons. In this work, we focus on the acceleration of electrons at shock fronts, which is thought to be responsible for radio relics - extended radio features in the vicinity of merging galaxy clusters. By combining high resolution AMR/N-body cosmological simulations with an accurate shock finding algorithm and a model for electron acceleration, we calculate the expected synchrotron emission resulting from cosmological structure formation. We produce synthetic radio maps of a large sample of galaxy clusters and present luminosity functions and scaling relationships. With upcoming long wavelength radio telescopes, we expect to see an abundance of radio emission associated with merger shocks in the intracluster medium. By producing observationally motivated statistics, we provide predictions that can be compared with observations to further improve our understanding of magnetic fields and electron shock acceleration.
Subject headings:
cosmology: theory — hydrodynamics — methods: numerical — cosmic rays — radiation mechanisms: nonthermal1. Introduction
The assembly history of galaxy clusters are wrought with violent mergers, high Mach-number flows, and extreme plasma physical interactions. Much of this results from a wide range of cosmological structure formation shocks (Miniati et al., 2001b; Ryu et al., 2003; Pfrommer et al., 2006; Kang et al., 2007; Hoeft et al., 2008; Skillman et al., 2008; Vazza et al., 2009; Paul et al., 2011). These shocks, however, do more than simply heat the inflowing plasma. They also accelerate electrons and ions to relativistic speeds (Bell, 1978; Blandford & Ostriker, 1978). See Drury (1983), Blandford & Eichler (1987), and Jones & Ellison (1991) for reviews. These relativistic particles then act as signatures of merger and shock activity. The relativistic protons have radiative loss (e.g. collisions, pion decay, inverse Compton scattering) times comparable to the Hubble time, and therefore remain in the intracluster medium and contribute to the total pressure of the gas (Miniati et al., 2001b; Pfrommer et al., 2006). On the other hand, relativistic electrons have relatively short lifetimes, on the order of a few hundred million years, and spend the remaining part of their life emitting synchrotron radiation as they gyrate about magnetic field lines.
Relativistic protons in the intracluster medium are, in principle, most easily observed through their collisional interactions with thermal ions, leading to pion decays that end in gamma-ray emission (Pfrommer et al., 2006). This emission is being studied with the Fermi satellite, and while preliminary results hint at low levels of relativistic ions, long integrations of individual clusters are still forthcoming (Aleksić et al., 2010).
Relativistic electrons have been more extensively studied in several galaxy clusters through their synchrotron radiation (Rottgering et al., 1997; Orrú et al., 2007; Bonafede et al., 2009; van Weeren et al., 2009b). These electrons are most frequently associated with objects called radio (Ensslin et al., 1998), which have extended radio emission in the cluster exterior, are associated with shocks, and have moderately polarized radio emission with spectral indices of for surface brightness ). They are also, by definition, not associated with active galactic nuclei (AGN). This spectral shape most likely indicates that these electrons were recently shock-accelerated (Blandford & Eichler, 1987). Radio , on the other hand, have low polarization and usually follow the X-ray morphology in the centers of clusters. They are thought to be associated with turbulent acceleration and/or older populations of previously shock-accelerated electrons (e.g. Brunetti et al., 2001).
The origin of the shock-accelerated electrons is believed to be primarily due to diffusive shock acceleration (DSA), as described in Blandford & Eichler (1987). This is a first-order Fermi mechanism in which electrons are accelerated by reflecting off magnetic field perturbations created by plasma effects in shock waves. Recent numerical studies by Spitkovsky (2008) have shown success in reproducing this mechanism through ab-initio simulations using particle-in-cell (PIC) methods, though the incoming plasma flow was at a much higher velocity than the shocks discussed here. Studies of non-relativistic flow are ongoing because of the difficulty associated with the range in relevant timescales in such simulations (Spitkovsky, 2008).
If these electrons are capable of reaching high enough energies, they will emit synchrotron radiation in the presence of magnetic fields. It is widely believed that the cluster surroundings are magnetized at relatively low field strengths, on the order of microgauss in the ICM (Fusco-Femiano et al., 2001; Rephaeli & Gruber, 2003; Rephaeli et al., 2006; Ryu et al., 2008), although measurements made by Faraday rotation indicate larger values (Govoni et al., 2006; Clarke et al., 2001). Because the shock-accelerated electrons are expected to have a power-law distribution in energy, the synchrotron emission will also have a power-distribution in frequency. There have been a number of recent studies of these radio relics in interferometric observations of nearby galaxy clusters (Rottgering et al., 1997; Orrú et al., 2007; Bonafede et al., 2009; van Weeren et al., 2009b). However, the total number of clusters with known relics is still fairly small () (van Weeren et al., 2009b). This is in part due to the low surface brightness of these extended sources.
Studies of these objects comes at a critical point in time with a number of upcoming improvements in radio astronomy capabilities. The VLA is currently being upgraded to the “Expanded VLA” (EVLA), which will be roughly a factor of 10 better in terms of surface brightness sensitivity due primarily to an increase in bandwidth of up to at 1.5 GHz (Napier, 2006). Several other telescopes will be coming online in the near future, such as LOFAR, possibly the SKA, and even lunar farside low frequency arrays (Burns & LUNAR Consortium, 2009) allowing an unprecedented view of the synchrotron Universe (Rudnick et al., 2009). Given the low surface brightness and spectrum of the emission, low frequency observations ( and below) are most effective in providing information on the radio relics and halos.
Here we set out to model these radio relics using high resolution, adaptive mesh refinement (AMR) cosmological simulations. These simulations include both dark matter and adiabatic baryonic physics, and allow us to model the shock acceleration of electrons and produce observationally-relevant radio luminosity functions and scaling relationships between cluster parameters such as synchrotron power, mass, and X-ray luminosity. By using large simulation volumes, we are able to show statistics for thousands of objects, from which individual morphological and evolutionary analyses can be carried out.
In Section 2, we introduce our simulation and galaxy cluster sample set and describe our shock finding method and synchrotron emission models. In Section 3, we study the global statistics of radio relics through projections and phase diagrams. Then, in Section 4, we describe the properties of individual halos, and use their statistics to generate radio luminosity scaling relationships and luminosity functions. We end with Section 5 where we discuss the implications for future surveys, the limitations of our model, and future directions.
2. Methods

2.1. Enzo
All simulations were run using the Enzo cosmology code (Bryan & Norman, 1997a, b; Norman & Bryan, 1999; O’Shea et al., 2005a, b). While a full description can be found in the cited papers, we will review the key aspects that are of importance to this work.
Enzo uses block-structured adaptive mesh refinement (AMR; Berger & Colella, 1989) as a base upon which it couples an Eulerian hydrodynamic solver for the gas with an N-Body particle mesh (PM) solver (Efstathiou et al., 1985; Hockney & Eastwood, 1988) for the dark matter. Users have the choice of solving the hydrodynamics with several methods including the piecewise parabolic method (PPM; Woodward & Colella, 1984) extended for cosmological applications by Bryan et al. (1995) and the ZEUS finite-difference method (Stone & Norman, 1992a, b). In this work we utilize both methods, and restrict our studies to adiabatic gas physics.
The AMR method that Enzo uses breaks the simulation domain into rectangular solid volumes called . These contain many computational elements called that set the resolution scale. Each grid exists on a of refinement determined by the spatial resolution of its cells that ranges from , where is defined by the user. Once within a given satisfy the refinement criteria (based on overdensity, minimum resolution of the Jeans length, local gradients of hydrodynamical quantities, shocks, or cooling time), a new is created at the next higher level. In our simulations, we refine on overdensity of the gas and dark matter fields.
2.2. Simulations
We will focus on two simulations that both use N-body dynamics for the dark matter and adiabatic baryonic physics. The first simulation, hereby denoted as relic64, has a comoving volume of with root-grid cells and up to 6 levels of additional refinement. The AMR is done by inserting a higher-resolution region wherever a cell satisfies the refinement criteria. Here we require a gas or dark matter overdensity ( where is the average density of gas or dark matter, respectively) of to refine. Because refinement effectively splits a cell into 8 cells, this ensures that cells on each level have similar amounts of mass. This allows for a peak spatial resolution of . The simulation uses the ZEUS hydrodynamic solver, with initial conditions from an Eisenstein & Hu (1999) power spectrum with a spectral index . The cosmological parameters used are , , , , , and . The dark matter mass resolution is . The simulation was started at a redshift of and run until , using approximately cpu-hours on the Texas Advanced Computing Center (TACC) Ranger supercomputer.
We use a second simulation with a larger volume with more modest resolution, relic200, to capture a higher mass range for our simulated galaxy clusters. As before, it uses root-grid cells and up to 5 levels of AMR. It has a peak resolution of and a dark matter mass resolution of . The simulation uses a slightly different cosmology of , , , , , , and , consistent with WMAP Year-5 results (Komatsu et al., 2008). This simulation uses the PPM hydrodynamic solver, was also run on the TACC Ranger, and took approximately cpu-hours to complete.
The mass functions of the two simulations are shown in Figure 1. To calculate the mass function we begin by finding all the halos using the halo-finding algorithm HOP Eisenstein & Hut (1998), implemented in 111http://yt.enzotools.org, an analysis and visualization system written in Python, designed for use with the adaptive mesh refinement codes including Enzo (Turk et al., 2011). This method finds halos by “hopping” from one dark matter particle to its most dense neighbor until a particle is its own highest density neighbor. All particles that find the same densest particle are then grouped into a single halo. The relic64 simulation contains halos, but in our analysis we only consider objects with masses above , corresponding to dark matter particles. This run was primarily designed to have superb resolution capable of capturing the morphology and structure of the relics and shocks. The relic200 simulation contains halos. For this simulation, we consider only halos above , corresponding to dark matter particles. This simulation is designed to study the statistics of medium-sized clusters. While neither of these simulations capture the most massive clusters in the Universe (e.g. Coma), they provide insight to radio relic origins, structure, and evolution. Studies of very large volume simulations are reserved for future work.
2.3. Shock Finding
To identify the shocks that ultimately accelerate the electrons that emit synchrotron radiation, we need an accurate shock identification algorithm. For this we use the temperature-jump method given in Skillman et al. (2008). Here we present an overview of the method for completeness. We use the Rankine-Hugoniot temperature jump conditions to derive the Mach number:
| (1) |
where and are the post-shock (downstream) and pre-shock (upstream) temperatures, respectively. is the Mach number using the upstream (pre-shock) gas.
A cell is determined to have a shock if it meets the following requirements:
| (2) |
where is the velocity field, is the temperature, is the density, and is the entropy. In our analysis, as in Skillman et al. (2008), we have set a minimum preshock temperature of K since the low-density gas in our cosmological simulations is assumed to be ionized (a reasonable assumption at ). Therefore, any time the pre-shock temperature is lower than K, the Mach number is calculated from the ratio of the post-shock temperature to K.
Once a shock is found, we identify the cell with the most negative flow divergence, choosing from a ray aligned with the temperature gradient. Therefore, even if several cells in a row qualify as a shock, only the “center” of the shock is marked as a shock, and the temperature jump is taken from the full jump across all the shocked cells. This relieves problems when shocks are spread out over several cells, especially when not aligned with the coordinate axes. In addition, this method has been implemented to run “on-the-fly” in Enzo so that post-processing of the data is not needed. This method then saves the Mach number and quantities such as the pre-shock density and temperature directly along with the other hydrodynamical quantities during simulation output. The unique feature of this shock-finder is its ability to accurately identify off-axis shocks within AMR simulations and quantify their Mach number even if the shock is identified as being spread out across several cells.

2.4. Synchrotron Emission
In order to estimate the synchrotron emission from the shock waves, we follow the method of Hoeft & Brüggen (2007). Here we summarize the main features of the model. The first assumption is that the electrons are accelerated to a power-law distribution that is related to the Mach number from diffusive shock acceleration theory. These accelerated electrons form an extension to the thermal, Maxwellian distribution that has a power-law form and exponential cutoff related to balancing the acceleration and cooling times of the electrons.
The accelerated electrons then emit in the radio through synchrotron radiation. Since we are not performing magnetohydrodynamic simulations, we assume that the magnetic field is governed by flux freezing such that the magnetic field strength is related to the density by , where is the number density. This is a reasonable assumption even in merging clusters, as was found by Roettiger et al. (1999). In Section 4.4 and Appendix A we explore the effect of a modified magnetic field model.
The total radio power from a shock wave of area , frequency , magnetic field , electron acceleration efficiency , electron power-law index (), post-shock electron density and temperature is (Hoeft & Brüggen, 2007)
| (3) | |||
| (4) | |||
| (5) |
Note that the radiation spectral index is related to the electron spectral index by . is defined as the magnetic field corresponding to the energy density of the CMB. It has a value of , and accounts for the inverse Compton emission that is simultaneously cooling the electrons along with their synchrotron emission. The final term, , is a dimensionless quantity that contains dependencies on the shock Mach number such that at and approaches for . It can be thought of as a shape factor that, together with , defines the acceleration efficiency as a function of Mach number. Note that for calculations with , we modify since we observe the redshifted emission.
In all of our analysis, we use , which was found by Hoeft et al. (2008) to match radio emission in known relics to similar mass clusters in their simulation. While the true value of this parameter is quite uncertain from current observational and theoretical constraints, the relationship between it and the total radio power is linear. Therefore, if we underestimate the electron acceleration efficiency by a factor of 10, it will lead to a derived radio power that is low by a factor of 10, and thus all relationships between radio power and other quantities (e.g. mass, x-ray luminosity) simply need to be rescaled. While we have chosen the dimensionless shape factor from Hoeft & Brüggen (2007), there are still uncertainties in the efficiency of acceleration as a function of Mach number. However, exploration of the effects of these uncertainties are beyond the scope of this work. We also ignore the effects of re-accelerated electrons from radio galaxies.
3. Global Properties of Radio relics
3.1. Full Box Projections
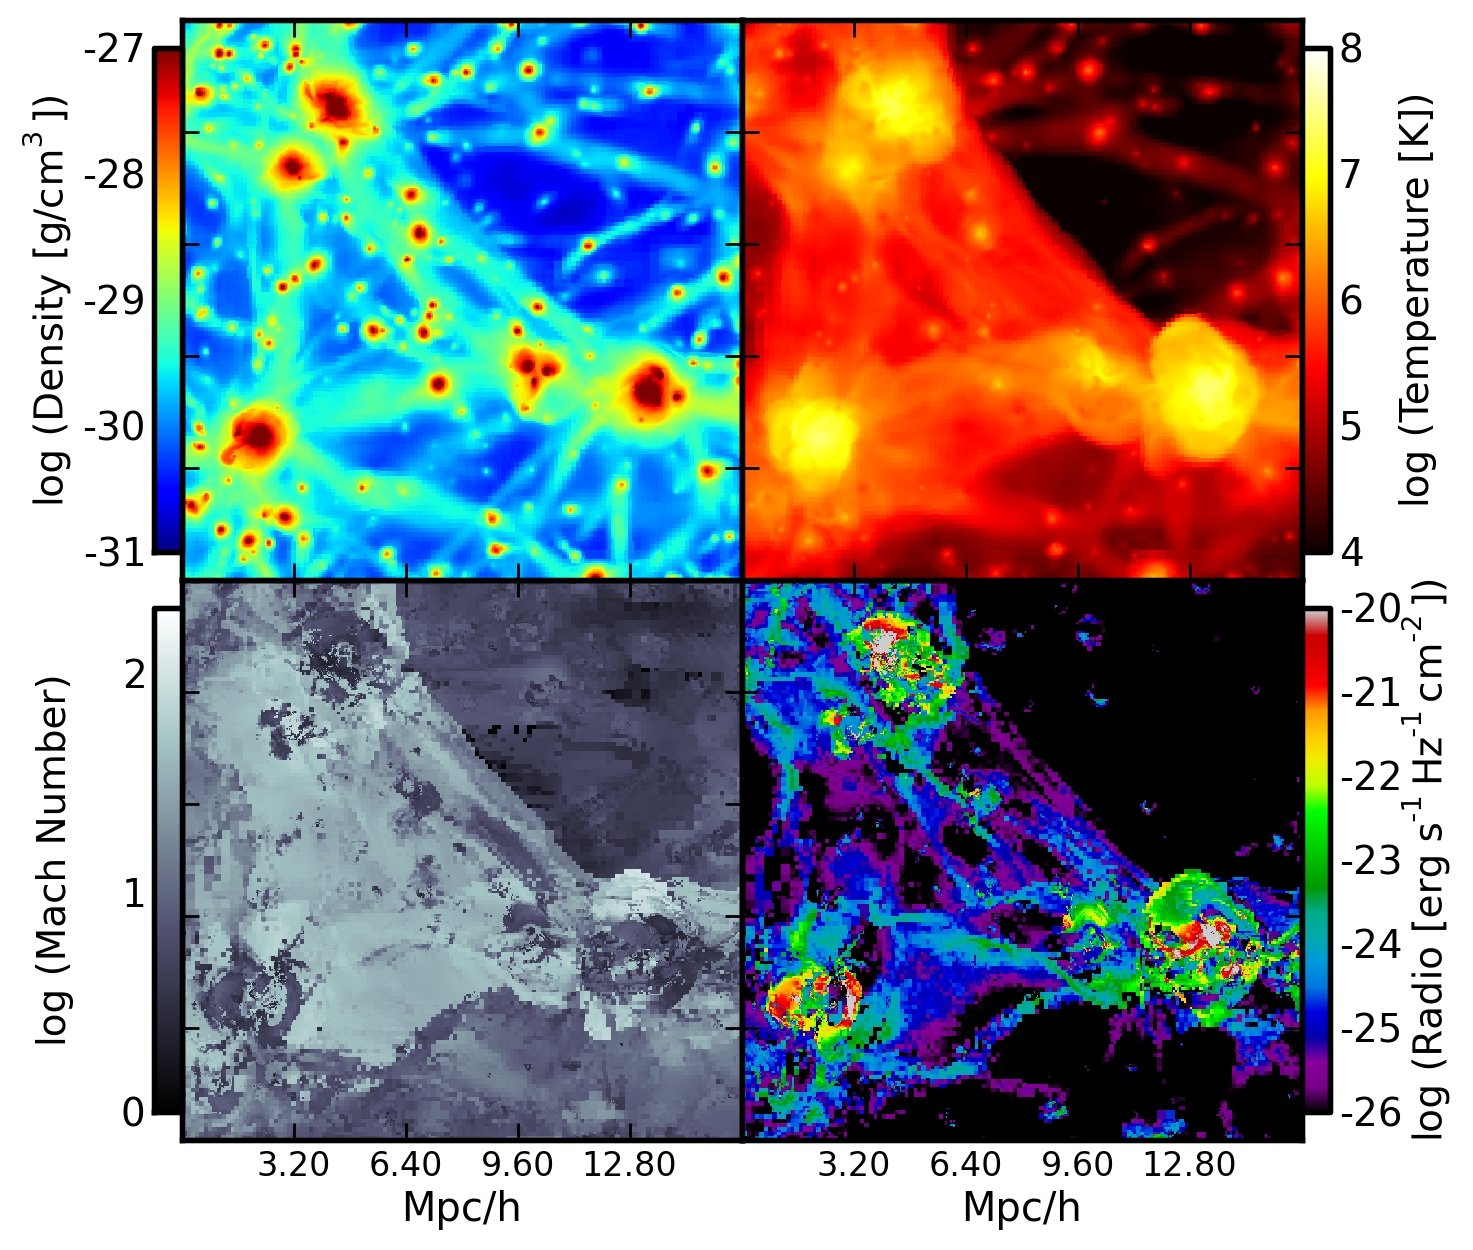
To begin our study of radio relics, we first performed simple projections of the radio emission through the entire simulation volume. An example is shown in Figure 2 along with projections of density, temperature and Mach number. For quantities such as density, temperature and Mach number in an AMR simulation, we choose to weight each cell by a secondary quantity since a simple average along the line of sight for each cell would bias the most highly refined regions because of their increased number of cells. Therefore, we choose to weight the density and temperature fields by cell mass, and the Mach number by the radio emission. This has the effect of pulling out the values of density and temperature from the densest regions, and the shocks that contribute the most to the radio emission. For radio and X-ray fields, we project the emissivities [energy/time/volume] without a weight, leading to final values with units of [energy/time/area]. Mathematically, a weighted projection (here along the z-axis) is defined by:
| (6) |
where is the weight quantity at that location and is the value of the projected quantity. To evaluate this integral in our AMR setting, the integral traverses the box along cells that are at the highest refinement for a given point in space, and ignores cells that are covered by more highly refined regions. This, like the bulk of our analysis, is done using , detailed above.
In Figures 2-3, we see that in general the radio emission traces out the large scale structure seen in the density projection. Additionally, the emission is also highly correlated with the temperature structure. However, the correlation with Mach number is more interesting. In the projection of Mach number, we see shocks with strengths up to throughout the volume in filaments and cluster edges, whereas the peak radio emission only shows up in small, curved arcs within clusters. At the location of these arcs, the value of the Mach number projection drops to values between . This shows that the strongest shocks which are most likely external, accretion, shocks are not responsible for the bright radio emission, and that it is instead the interior shocks (Ryu et al., 2003; Skillman et al., 2008), as was found by Hoeft et al. (2008) with moderate strengths, that shine in the radio. This can be understood by the fact that it is the mass flux of gas through shocks that is most important since that determines the number of electrons that can be accelerated. Therefore, while the Mach number is much lower for the interior shocks, the shock velocity stays roughly constant while the pre-shock density is much higher, yielding more accelerated electrons. In the projection of Mach number, this results in the appearance of “veins” lining the interior of the filaments, “arcs” in the periphery of the clusters, and “holes” in the centers of the clusters. While they are decrements in the projection of Mach number, they are the bright areas in the radio emission.
The lack of strong emission in the accretion shocks suggests that having a hot, dense plasma is more important than the Mach number of the shock. This can be understood by Equation 3. Since and in most cluster situations and , we have that . This implies that since the density in the accretion shocks is times lower than that in a merger shock, the power emitted will be down by a factor of . Therefore the features we see observationally are more likely to be related to merger shocks than accretion shocks.
3.2. Phase Diagrams
The second method we use to study the bulk properties of the radio emitting plasma is phase diagrams. Such diagrams are the equivalent of a two-dimensional histogram. Here we use them to study the gas properties of the radio emitting regions.
The structure of these diagrams is as follows. For a given simulation output, we construct x and y-axis bins that are equally spaced logarithmically in two fields. Within each of these 2D bins, we integrate the total amount of a given quantity such as radio emission. This integrated value is normalized by the comoving volume of the simulation in order to give a comparable value between different physical size simulations. We have found three particularly insightful quantities to examine in a range of permutions: temperature, overdensity, and Mach number.
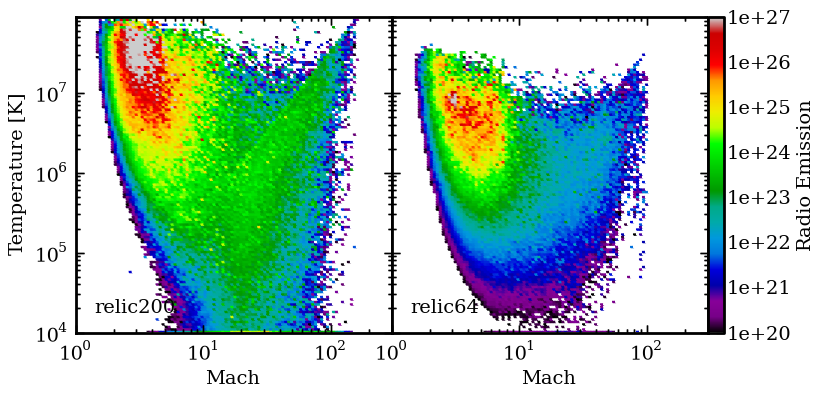
We have constructed one such phase diagram, seen in Figure 4, in which the x-axis is the Mach number, the y-axis is temperature, and the bins are colored by the total radio emission in that bin. The total integrated emission is normalized by the volume of the simulation and the size of the bins. As such, one reads this figure as “At Mach number and temperature , there is amount of radio emission per comoving Mpc/h per .” The utility of these diagrams is demonstrated in Figure 4, where it is immediately clear that the bulk of the radio emission in both simulations originates from hot gas with , and Mach number . This reinforces our earlier hypothesis that the radio features are generated from interior shocks associated with merging subclusters that have low Mach numbers but high mass and energy flux due to the high relative density, and therefore shock velocity, of cluster cores. Second, it points out that shocks with have little role at in producing appreciable radio emission. In fact, their integrated luminosity is a factor of less than their low-Mach number counterparts.
At first glance, one also picks out a diagonal structure in the relic200 phase diagram that seems to be an upper limit on the temperature for a given Mach number. This is a very interesting feature that has a simple explanation. We calculate our Mach number using a minimum pre-shock temperature of . Now, while the gas at the location of the shock is not necessarily the pre- or post-shock temperature, it is bounded by those two values. This is because the shock location is based on the cell with the most convergent flow, not the location of the pre- or post-shock gas. Because of this, if gas with pre-shock temperature is being accreted, the gas at the location of the shock will have a maximum temperature of . This maximum coincides perfectly with the diagonal feature. Therefore, any gas below this line is likely pristine gas (that is, gas that has not been previously shocked) being accreted onto filaments or clusters for the first time. This gives us a proxy for the relative amount of accretion in a simulation.
We can then use this diagnostic to study the role of accretion in the relic64 and relic200 simulations. While relic64 does have a small amount of accretion, it is far below that of relic200. This is because of the different mass clusters present in each of the two simulations; relic200 has clusters that are up to an order of magnitude more massive than in relic64. Recalling that the accretion radius scales with mass (Bondi & Hoyle, 1944), the clusters in relic200 are able to pull in and accrete more gas than those in relic64. This behavior will be studied as a function of redshift below.
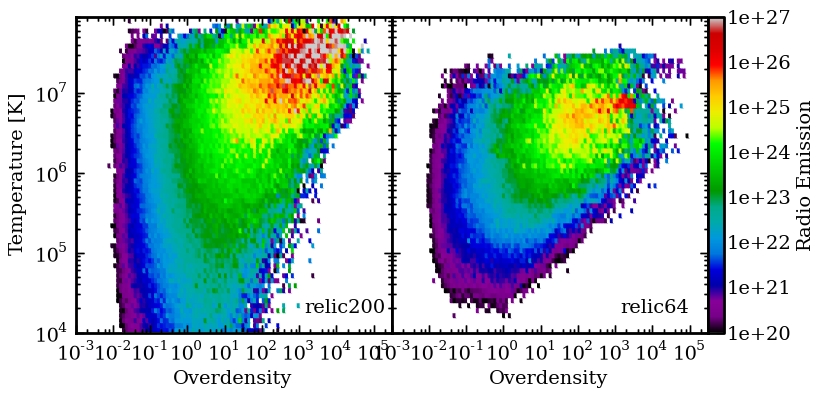
As we did in the temperature-Mach number phase space, we now examine the behavior in the temperature-overdensity plane in Figure 5, where overdensity is defined as , where is the mean matter density of the Universe, . Here our earlier findings are reinforced - the strongest emission is coming from the densest, hottest regions in the simulations.
Both simulations exhibit the same general properties, though relic200 has hotter gas again due to the larger clusters. This suggests that not only will the most massive clusters likely be associated with the strongest radio emission, but that the strongest features will arise from merger shocks passing through the centers of cluster, which seems to be the case observationally. Below an overdensity of , the radio emission greatly decreases. This strongly disfavors the possibility of seeing cluster accretion shocks in agreement with Hoeft et al. (2008). This is compounded by the fact that these accretion features are more diffuse and therefore have reduced surface brightness compared to the more compact merger shocks, making them difficult to study observationally. If we then compare relic64 to relic200, we see that there is a relative absence of accreting gas in the relic64 simulation, reinforcing our earlier findings that relic64 has less accretion due to the smaller mass halos compared to relic200. In the following section we study this accretion as an evolutionary tracer in more depth.
3.3. Radio Emission as a Proxy for Cluster Accretion
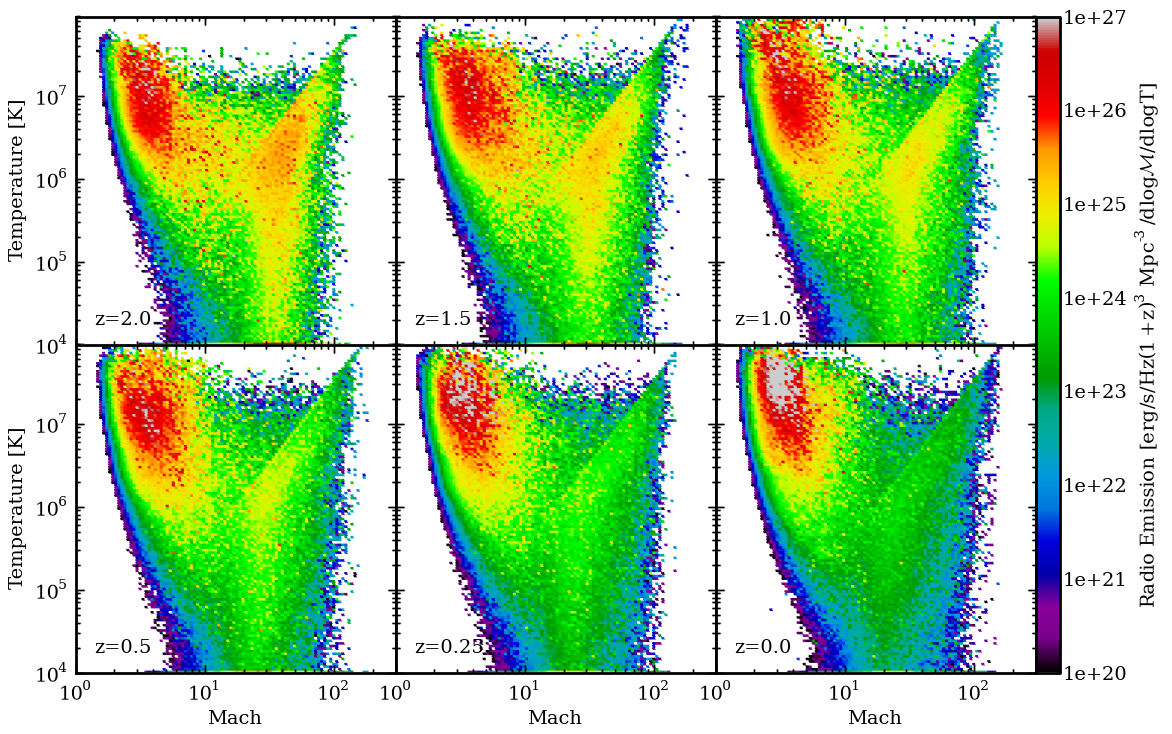
We have seen at that there is a relatively small amount of radio emission coming from cluster and filament accretion shocks. We now investigate whether or not this holds for earlier times. Figure 6 is an analog to our prior phase diagrams, but we now show the evolution of this phase diagram for relic200 back to . We have normalized the emission by comoving volume in order to avoid confusion with the expansion of space. Even with this taken out, we see that there is a strong evolutionary trend in the origin of the radio emission.
At , we see that the emission from accretion shocks is comparable to, if not above, that of the interior merger shocks. This roughly translates to an equal amount of thermal energy being processed by mergers and accretion shocks at since the efficiency of acceleration does not differ dramatically between the two cases. The line that we previously identified with accretion shocks is now quite strong, and there is even a dominant population within the accretion regime, centered around and Mach numbers of .
By , the emission from accretion shocks has dropped by a factor of 10 while the merger shocks have increased by a factor of . Finally, by , nearly all of the radio emission due to accretion shocks has disappeared while the interior shocks have increased by a factor of 10 from . This drop in radio emission from accretion shocks coincides with the Universe beginning to accelerate due to ’dark energy’ at . This process manifests itself by both depleting the voids leading to less mass to accrete, and decoupling of clusters from the cosmic expansion. Therefore, instead of growing in mass, and growing the radius of influence, dark energy dominates and pulls all the remaining matter away from the cluster faster than it can grow. We note here that this assumes that there is no evolution in the relative magnetic field strengths or acceleration efficiencies between merger and accretion shocks. It may be the case that the magnetic field strength at accretion shock locations is lower or higher at early times compared to the interior of proto-clusters. However, since we do not have conclusive evidence to this evolution, we have chosen to adopt the simplest model that assumes no evolution.
This decrease in radio emission from accretion shocks is similar to the depletion of cosmic ray proton acceleration at from accretion shocks, found in Skillman et al. (2008). This behavior is a novel perspective to view the effects of Dark Energy. If the radio relics from these accretion shocks are observable in the future, one should see a decrease in their frequency and power as decreases.
4. Individual Object Properties
4.1. Cluster Projections
In this section, we take the opposite approach from the previous section and examine projections of individual objects. We begin with our list of halos and make radial profiles that start at the density peak and continue to the previously found , defined here as the radius where . We call the mass enclosed within this radius the , and also record several other quantities, such as X-ray luminosity and radio power within the virial radius.
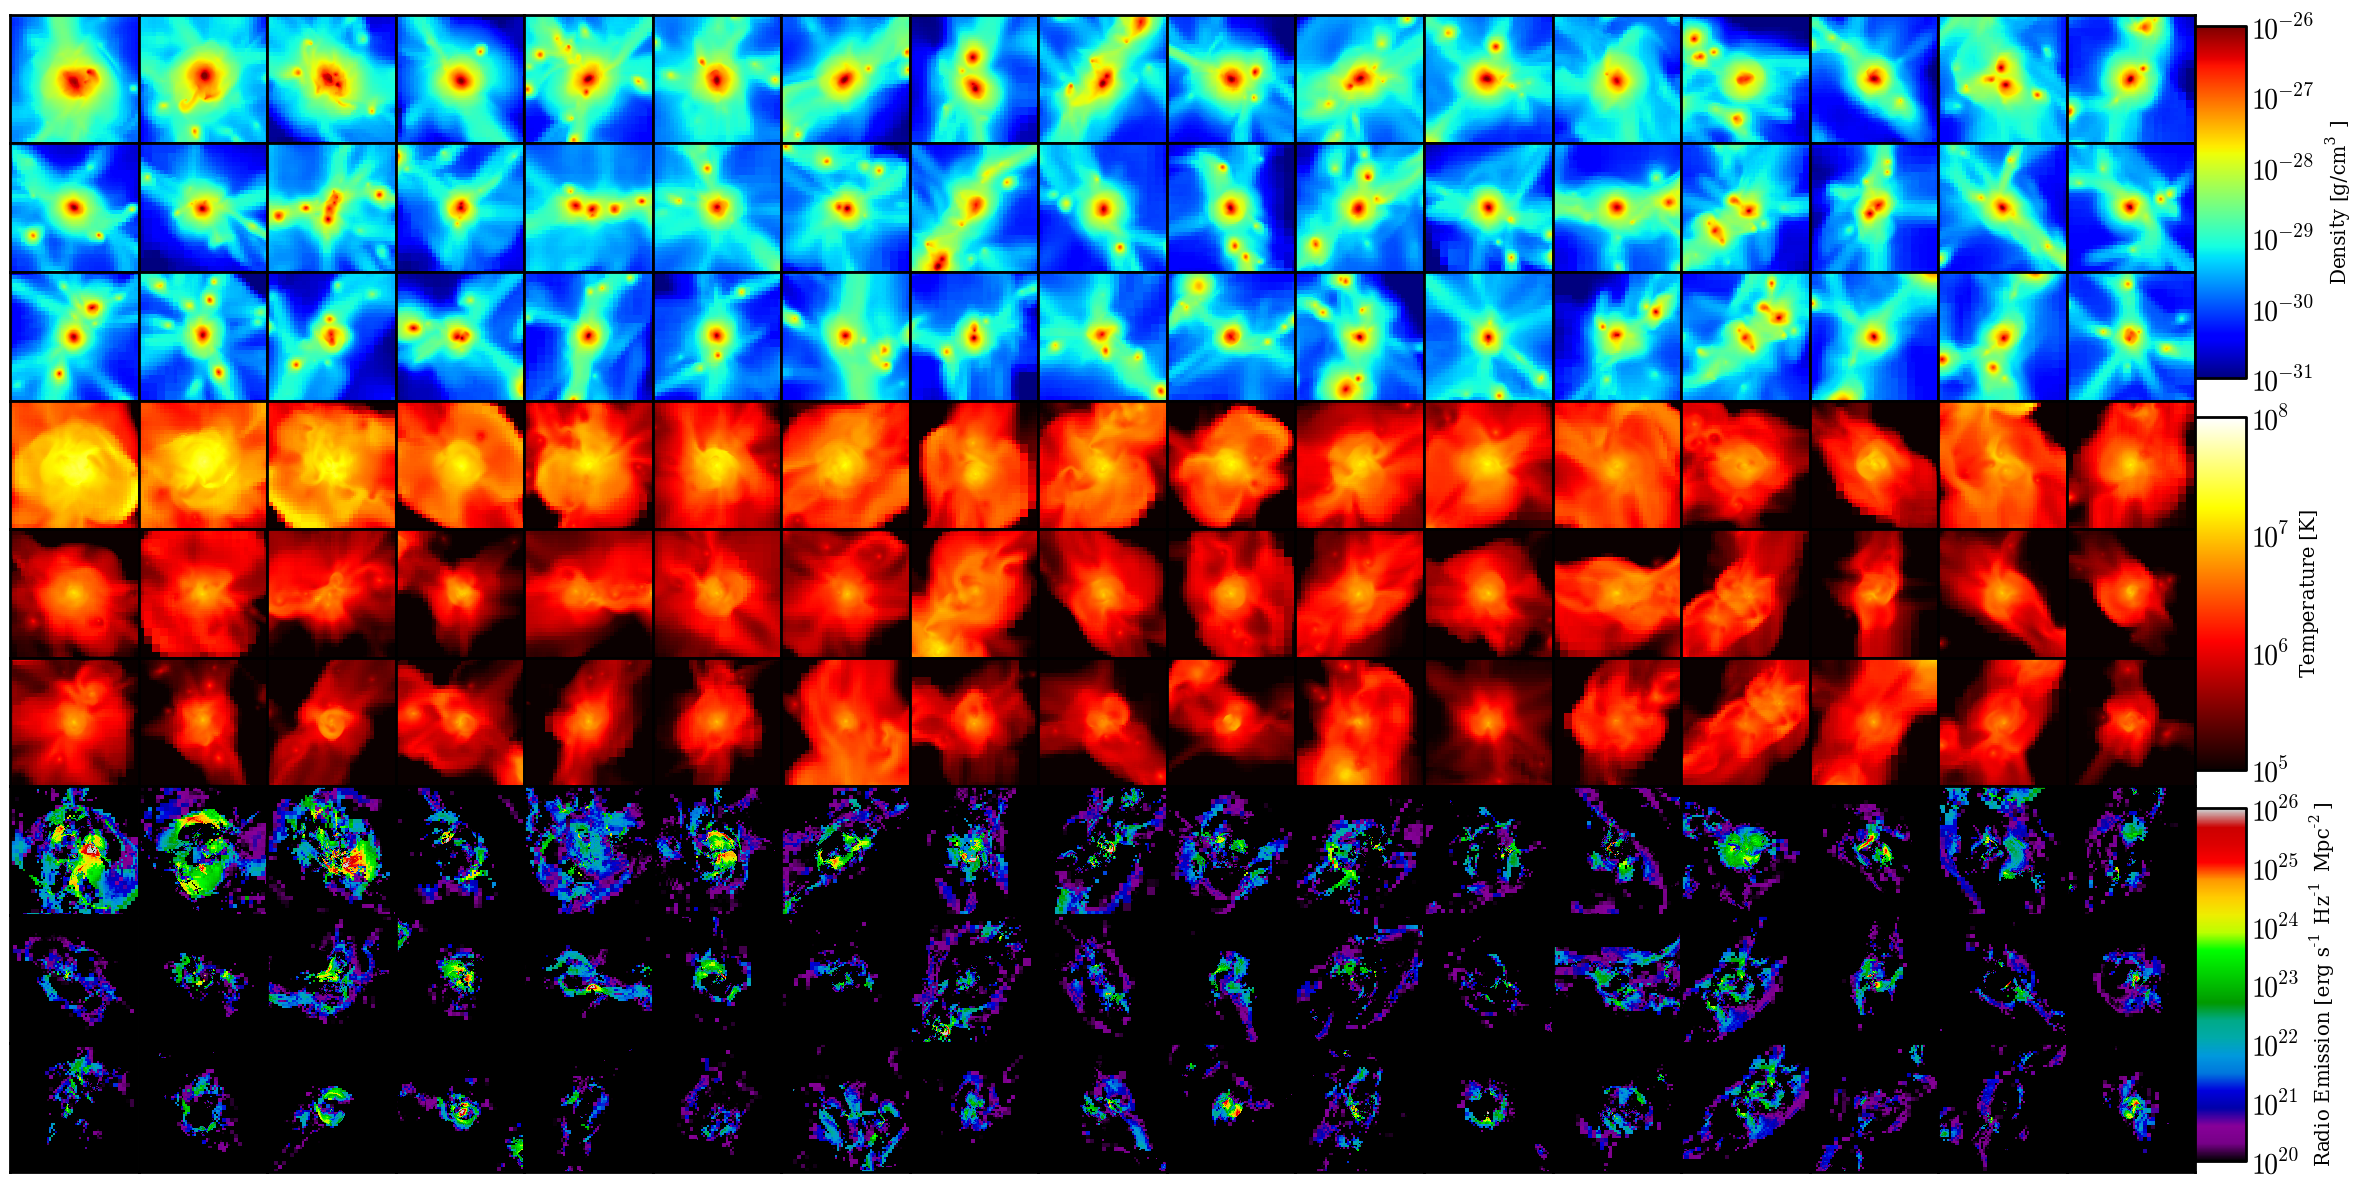
We begin by demonstrating the power of having a large sample of clusters in a single simulation by projecting only the 51 most massive clusters at along the x-axis in relic64 in Figure 7. The width and depth of each individual projection here is 4 Mpc/h.
The most important result gleaned from these images is the morphological properties of cluster structure. If we first examine the gas density (top), we see that while there is some amount of substructure, the density is centrally concentrated. Since X-ray emission closely follows the density distribution of the gas, this implies that the X-ray emission will be brightest in the centers of clusters. However, the radio emission (bottom) is brightest on the edges of the clusters and has very little correlation with the density structure. Instead, it more closely follows the temperature structure (middle). This is because the temperature is more strongly affected by shocks than the density (recall from shock jump conditions for ). Note, however, that the emission is still confined within high density regions inside the virial radius. Immediately from these images, we expect radio emission to be anti-coincident with the X-ray emission, as is seen in existing examples (Giacintucci et al., 2008; van Weeren et al., 2009a; Bonafede et al., 2009; Clarke & Ensslin, 2006). This behavior implies that shocks are more likely to appear in radio imaging than in X-ray surface brightness maps.
Also visible in the radio emission are common features such as arcs and rings. These features are due to merging subclusters as their bow shocks propagate through the ICM. These shapes are similar to what is seen in observed radio relics. This similarity supports our claim that the morphology of these objects is related to the location of shocks, as was originally suggested in Ensslin et al. (1998). In a few rare situations (here in 2-3 clusters), these arcs appear in the very center of the cluster. Because the surrounding medium is both hot and quite dense in these cases, the radio emission is very strong. This agrees with our previous results from Section 3.2, where we found the bulk of the emission at late times to be in the hot, dense phase of the gas.
4.2. Radio Power - Mass Relationship
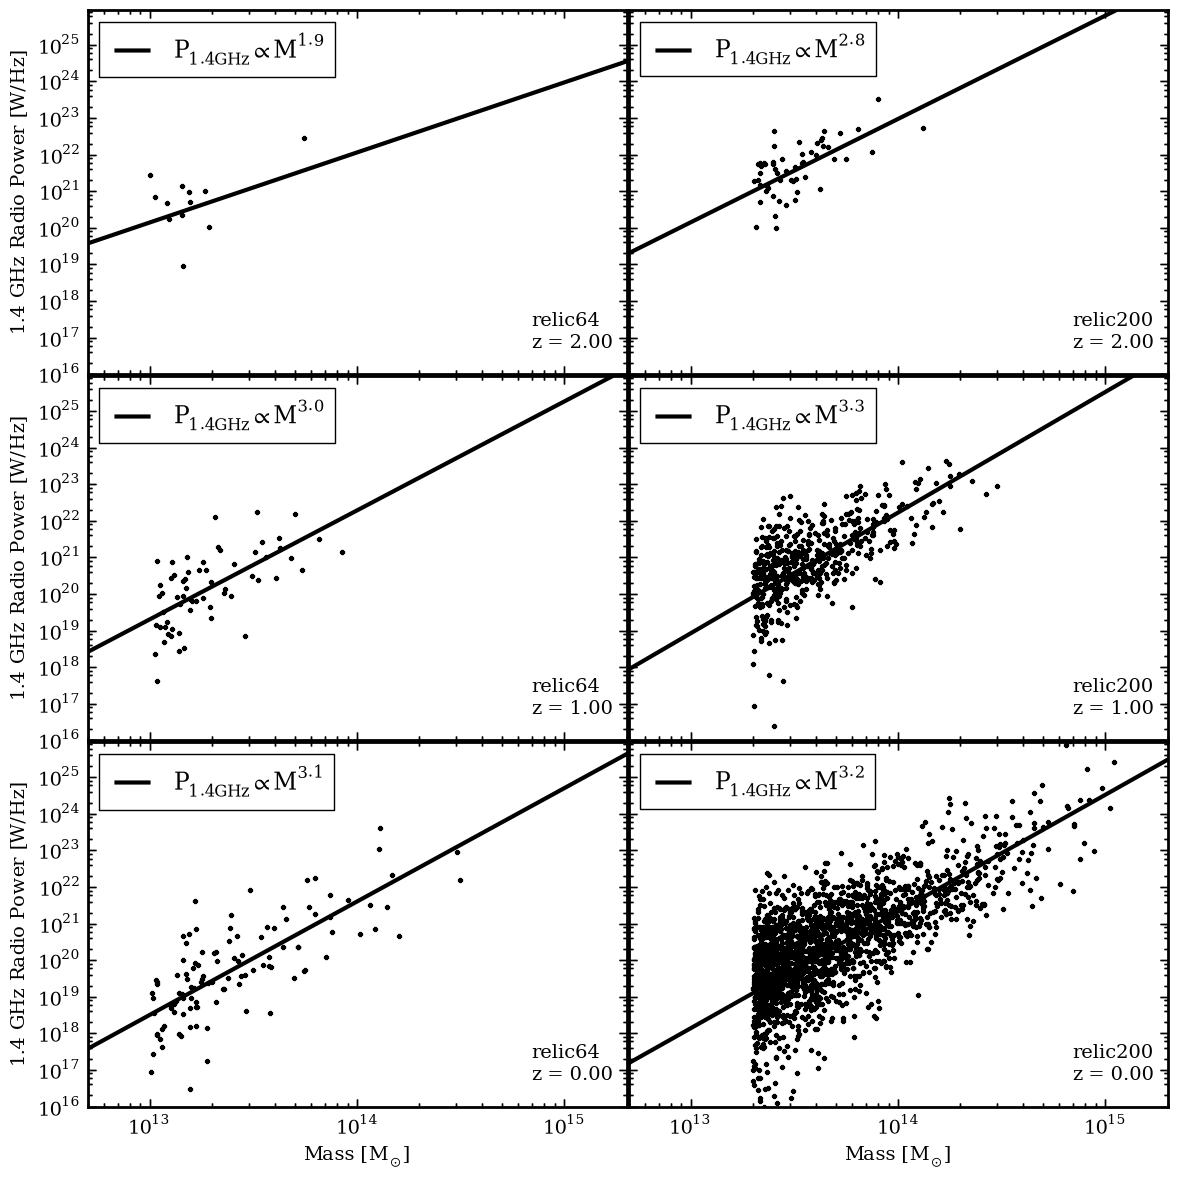
From the projections of individual halos in Figure 7, we can see that there is a general trend for the more massive halos to have higher radio emission (note masses decrease from the top left to bottom right). We now want to quantify this scaling relationship by studying the radio luminosity-mass relationship for the halos in our simulations. We begin with the earlier list of halos and use the virial quantities of each halo. For each halo, we use their total mass and 1.4 GHz radio power (integrated out to ) to populate Figure 8. Second, for the distribution of halos, we now determine the linear-least squares fit to for all halos with and for the and simulations, respectively. We choose to only fit halos above this minimum mass because at smaller scales additional physics such as cooling not included in our simulations would possibly strongly affect the emission. Additionally, we do not capture small mass halos that are likely moving through these small clusters possibly creating a large fraction of the total radio emission. Because our simulation data does not have a measurable uncertainty for a given radio power, we have to use an alternate method of determining the error estimates of our parameters. We first find the best fit parameters using a uniform weighting. By calculating the residuals for each point from this best-fit relation, we estimate the uniform error for each point as the standard deviation of this residual. We then fit the data again using this error to obtain the uncertainty estimates in each parameter. The values of these parameters are shown in Table 1.
Perhaps the most interesting result from Figure 8 is the normalization as a function of redshift. At , a mass halo emits , while a similar mass halo at emits . This amplifies our hypothesis that the merger state of the halo is very important. The halo at is one of the most massive objects at that time and has likely recently formed, whereas the same mass halo at is a fairly common object that was likely formed some time ago. Additionally, the probability of a merger with a mass ratio is very low for the largest halos at a given time. For both simulations at multiple redshifts, the radio power is correlated with the mass of the halo. This dependence is expected since the radio emission is a function of the temperature, density and magnetic field strength of the halo, all of which scale positively with the mass.
The second result of these radio luminosity-mass relationships is the large scatter around the best fit. We see that there can be scatter of up to orders of magnitude for a given mass cluster. This suggests that while the radio emission is correlated with mass, the merger state of the halo plays a major role in determining the radio power. As can be seen from the projections of these halos in Figure 7, the most radio luminous objects have very disturbed morphology and are undergoing major mergers.
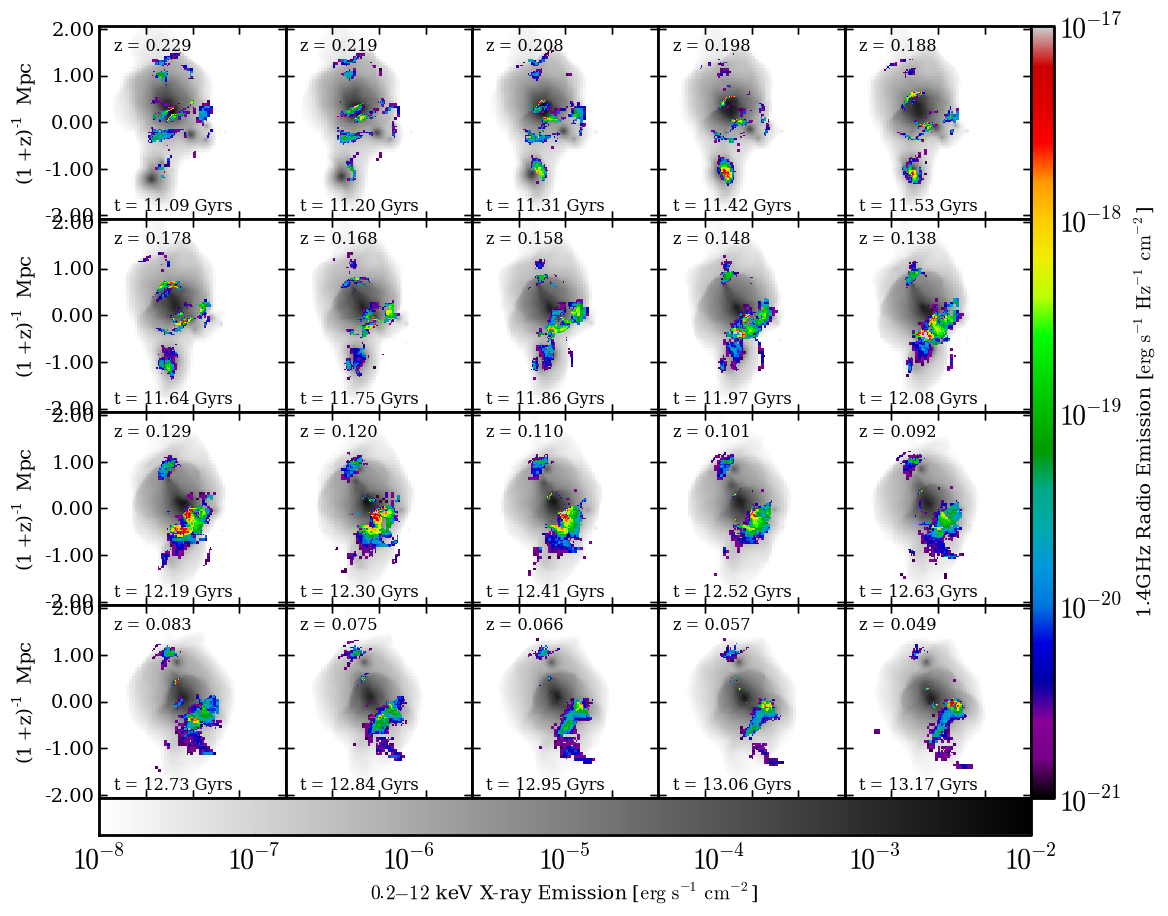
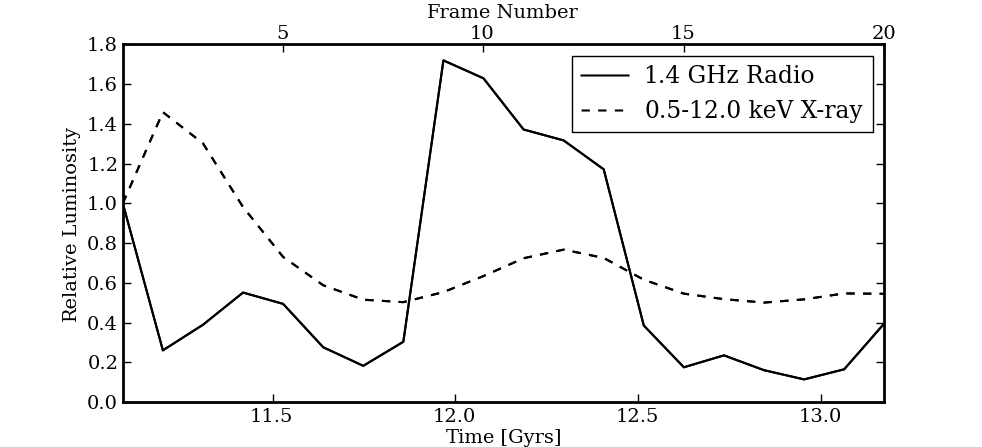
In Figure 9, we show the evolution of the most massive cluster in relic64, and track the total radio and X-ray luminosity as a function of redshift. The X-ray emission is calculated using outputs of the Cloudy code (Ferland et al., 1998) where we have adapted the method of Smith et al. (2008) for radiative cooling to calculate frequency-dependent emission. This yields an X-ray emission for given temperature and density of the gas, and is shown in gray. The radio emission, shown in color, has been masked such that all values below are transparent, allowing for a view of the X-ray data and masking out radio features that are too faint to be observed. To help follow the evolution of the total radio and X-ray luminosities from the cluster, we plot their relative luminosities with respect to their values at in Figure 10.
As we follow the evolution from , we see the evolution of a major merger where the two cores pass through each other at . The smaller halo is moving from the center towards the upper-right. As the shockwave builds through , the radio emission closely follows the X-ray brightness jump, as we would expect. By , the radio emission from the initial shock has decreased dramatically. While the initial shock has disappeared in the radio, a secondary shock has been created that moves in from the hot ICM into the wake the merger left behind from the middle towards the lower-right. By (frame 9), this is the most luminous feature in the radio. At this time, the image is 7-8 times brighter in the radio than it was at (frame 8), illustrating how strongly radio emission depends on the merger state of the cluster. As the halo evolves further, additional smaller objects fall into the ICM, but don’t get nearly as bright as major merger. By (frame 14), the integrated radio luminosity has dropped back to pre-merger levels.
During this merger, the X-ray luminosity also increases, but the total X-ray emission only increases by , which again illustrates the difference in the X-ray and radio emission mechanisms. A detailed analysis of cluster evolution and merger state is reserved for a later study.
4.3. Radio Power-X-ray Relationship
| Simulation | relic64 | relic200 | |||||||
|---|---|---|---|---|---|---|---|---|---|
| Var | A | B | A | B | |||||
| Mass | 3.1 | 0.1 | 18.51 | 0.07 | 3.19 | 0.04 | 18.14 | 0.02 | |
| Mass | 3.0 | 0.2 | 19.38 | 0.08 | 3.30 | 0.08 | 18.93 | 0.04 | |
| Mass | 1.9 | 0.4 | 20.1 | 0.1 | 2.8 | 0.2 | 20.2 | 0.1 | |
| X-ray | 1.32 | 0.08 | 19.32 | 0.06 | 1.34 | 0.02 | 19.49 | 0.02 | |
| X-ray | 0.9 | 0.2 | 19.6 | 0.2 | 1.28 | 0.04 | 19.52 | 0.04 | |
| X-ray | 1.0 | 0.3 | 19.8 | 0.2 | 1.0 | 0.1 | 20.2 | 0.1 | |
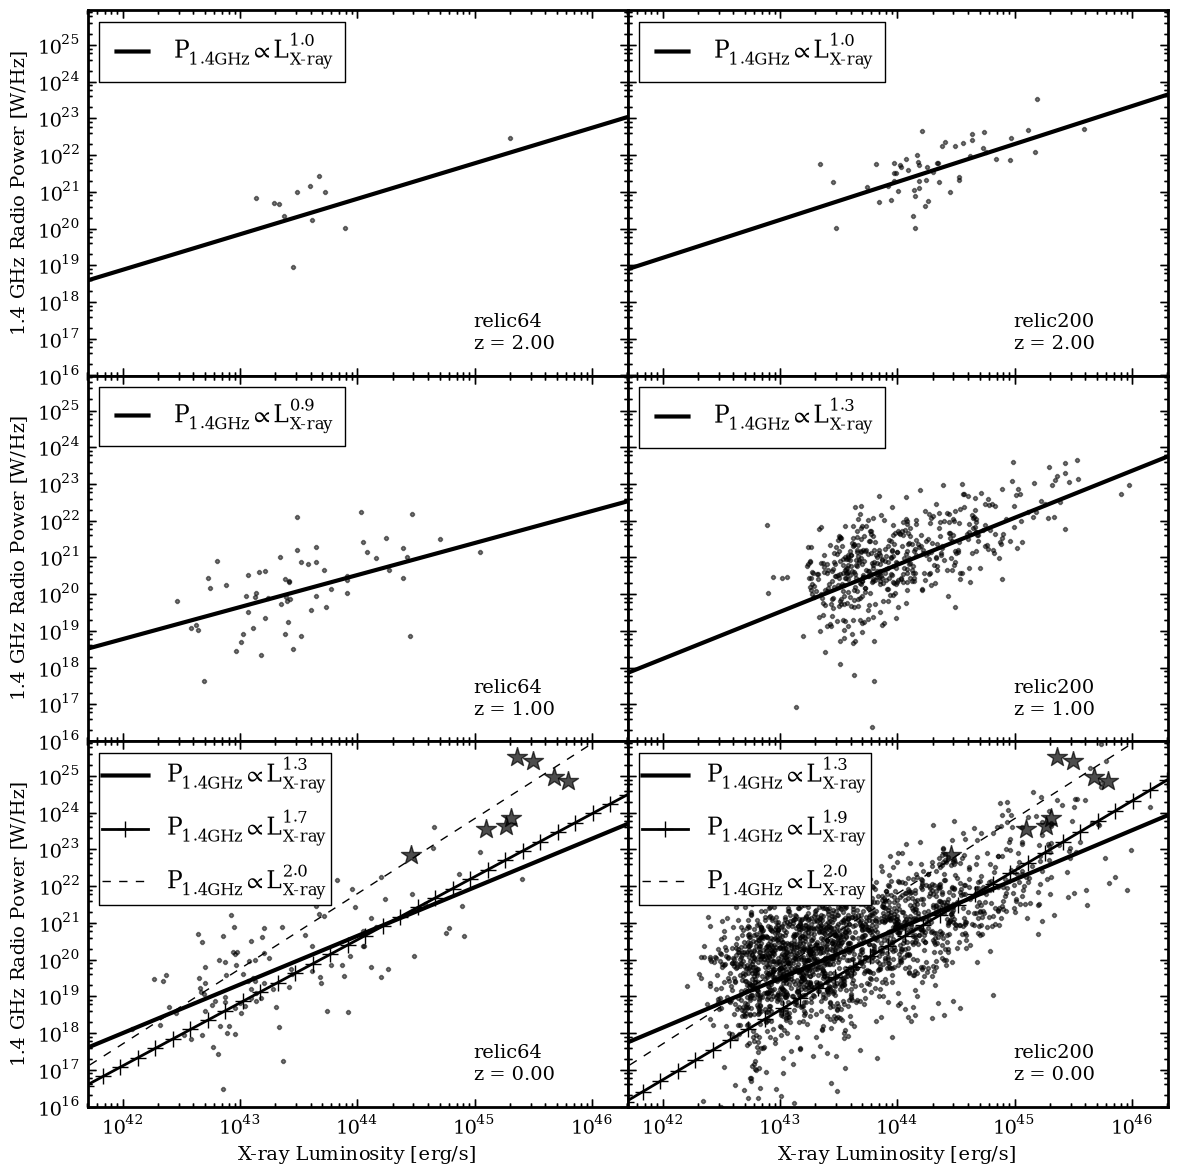
While the X-ray and radio emission may not be coincident in projection, we expect to see a correlation between the total X-ray and radio luminosity since they both sample hot, dense gas. We start our analysis from the results of our radial profiles and examine the X-ray and radio emission within for relic64 and relic200 in Figure 11.
We again use a method of linear-least squares regression described above to obtain a scaling relationship between the X-ray and radio luminosity, the results of which are shown in Table 1. Again we see that while there is a clear trend with X-ray luminosity, large scatter in the individual clusters can dominate the relationship. This scatter likely comes from two sources. First, a cluster that is relatively relaxed will have significant X-ray emission, whereas the lack of shocks in such a scenario will necessarily lead to zero radio emission in this model. Second, the fractional increase in X-ray luminosity across a shock front is much less than the radio emission because the X-ray primarily depends on the density of the gas at cluster temperatures, whereas the radio scales with density and temperature.
As a function of redshift, the scaling relationship between radio power and X-ray luminosity evolves much like the radio power-mass relationship. Objects with the same X-ray luminosity at early times are more likely to have much higher radio power than their low-redshift counterparts. Additionally, the strength of the relationship increases at low redshift significantly due to the stronger correlation with larger mass halos.
Even though our constraints on the fit parameters seem quite small, one can argue the due to the large scatter there should be a broad range of values capable of producing “acceptable” fits. To give a basic understanding of how our fit parameters can vary, for our two simulations at , we have shown the results of fitting using two cuts on our underlying data. The solid line is the result of fitting the points using all halos with amass greater than and for the and simulations, respectively. The solid line with hash marks shows the result of only fitting points with . As one can see, the slope varies quite dramatically. Therefore when comparing to observational constraints, the selection function of the observed/simulated clusters is very important.
We can compare our derived scaling relationships with observational estimates from known radio relics. Feretti (2002) found X-ray luminosities and radio power for 9 Abell clusters. If we fit their data using our same least-squares regression technique, we obtain , agreeing quite well within the uncertainties in our simulation data. However, the normalization for the real relics are much higher than our simulated relics. We explicitly plot these clusters on Figure 11. A very important point from this is that the observed relics land on the high end of both the X-ray luminosity and radio power. This demonstrates the selection effects coming in to play, as we have only observed the brightest objects as of yet. This suggests that deeper observations of radio-quiet clusters should lead to the discovery of low power radio relics. As another constraint, Cassano et al. (2006) study this relationship for giant radio halos and find . While these giant radio halos are thought to be from turbulent re-acceleration of electrons, their origin is likely linked to the same driving forces (i.e. mergers) as the radio relics. We note here that our X-ray emission is likely underestimated due to our lack of radiative physics in our simulations. However, properly modeling galaxy formation, metal pollution, cooling, and thermal feedback is beyond the scope of this study.
4.4. Luminosity Function
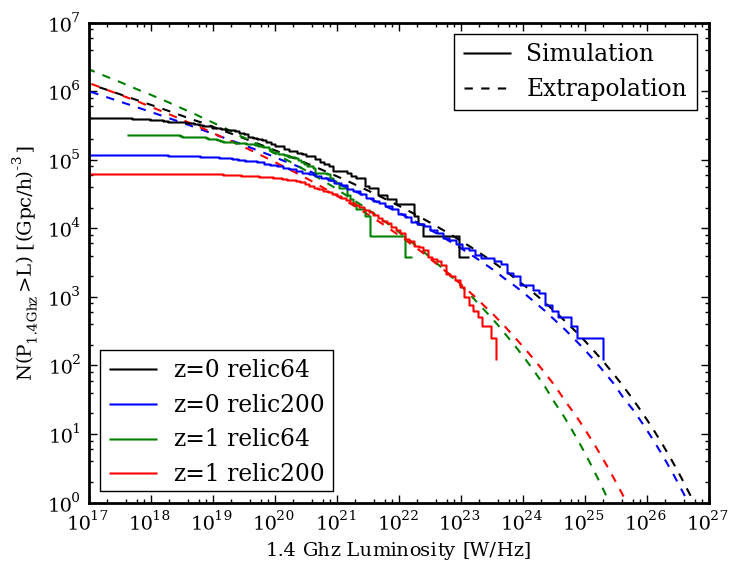
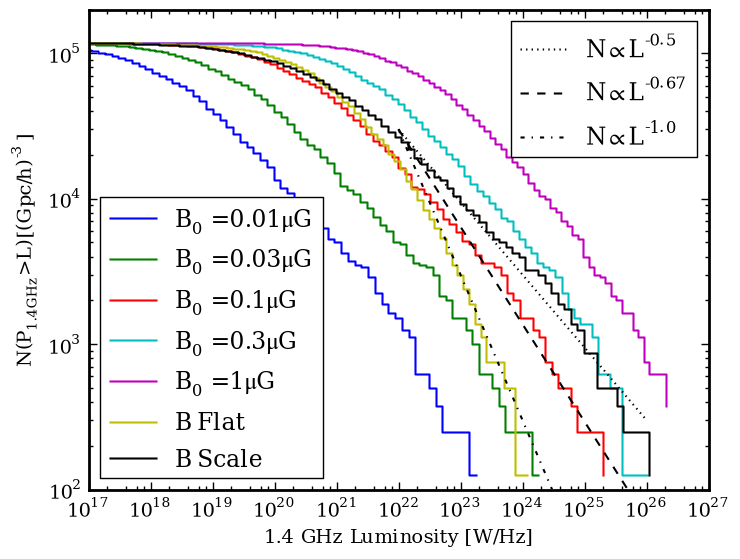
Now that we have explored how the radio emission varies as a function of mass and X-ray luminosity, we ask the question: “How many radio relics do we expect at a given luminosity in the Universe?” Here we attempt to answer this question by constructing an observationally-motivated radio luminosity function. This is done by calculating the cumulative number of objects brighter than a given luminosity. We have done so in Figure 12, and normalized the count rates by .
As we expect from our radio luminosity-mass relationship, the overall shape of the luminosity function is similar to the cluster mass function presented in Section 4.2. At first glance this luminosity function is not very encouraging for observational studies because even our most luminous objects are difficult or impossible to capture with current radio telescopes. However, this is primarily a result of the mass range in our current simulations. The known radio relics are associated with massive clusters with , and our largest clusters in relic200 only begin to reach the mark. Obtaining spatial resolution needed to capture the relics in a volume large enough to capture these very rare clusters is computationally difficult. We address this by combining best estimates of the halo mass function with our radio luminosity-mass relationship.
We begin by calculating the best fits for the radio luminosity-mass relationships for both of our simulations. Next, we take fits from Warren et al. (2006) for the mass function at redshift 0 and 1. We then convert the mass in the mass function to the expected radio luminosity from our fits in Table 1. The results of this fitting are shown in the left panel of Figure 12. Because of the scatter in the radio-mass luminosity function, we are able to place rough lower and upper limits on the luminosity function. This scatter will be constrained by future simulations that cover a larger mass scale of galaxy clusters.
As we have done for our other results in Appendix A, we varied the magnetic field model to examine its effects on the luminosity function. The first parameter we changed is the normalization of the magnetic field, . In Figure 12, we show . Since the emitted power is roughly proportional to (see Section 3.1), as we increase the luminosity function shifts quite dramatically to larger luminosities. At low values of the increase is close to the expected increase of , while at higher values approaches , reducing the effect of the increased local field strength. The second variation was in the scaling of the magnetic field with respect to the electron density. The line labeled “B-Flat” corresponds to , whereas “B-Scale” denotes . In both cases we set . With a uniform magnetic field, we see that the number of high-luminosity objects decreases dramatically, while the number of low luminosity objects increases slightly. This is understandable given that the highest luminosity objects come from the most massive clusters, which have the highest densities. In this case, the density doesn’t correspond to higher magnetic fields, and the radio luminosity is diminished with respect to the adiabatic scaling. Similarly, in the “B-Scale” case, the magnetic field strength is even higher in the dense parts of the largest clusters, leading to a shallower slope in the luminosity function. By comparison, Hoeft et al. (2008) also found a slope of using the same model as the line in 12, adding verification to both results.
To determine the number of clusters for a given survey area and redshift depth, we integrate the cosmological volume out to for a given survey area ,
| (7) |
with
| (8) |
where is the angular diameter distance. The result of this is that an all-sky survey out to covers . In combination with our estimates from the simulation in Figure 12, we expect to find 180 (conservative) to 1000 (optimistic) clusters with a total radio luminosity of within this cosmological volume.
We also see from Figure 12 that the luminosity function of halos increases from to . However, if plotted using proper volumes, the factor of 8 brings the two luminosity functions much closer together. Therefore the proper number density of radio relics seems to be fairly constant through cosmic time. This is an unexpected result, and encouraging for moderate redshift studies of radio relics. We note here that the frequency at which telescopes receive this synchrotron emission changes as a function of the emitter’s redshift. Therefore when deriving the radio luminosity of an object at redshift , we use . Because of this, the emitted power is actually decreased since where for strong shocks. The power emitted in the cluster’s frame is therefore substantially larger than what is shown in Figure 12. The similar luminosity function is therefore a product of the increased merger and accretion activity at higher redshift compared to that at .
5. Discussion
5.1. Comparison To Previous Work
In order to compare our results to previous shock studies, we have calculated the kinetic energy flux through shocks, as shown in figure 13. The left two panels show the kinetic energy flux as a function of Mach number in the and simulations, respectively. The right panels instead show the radio emission as a function of Mach number. While the black lines denote all temperatures, we also show the breakdown in terms of the pre-shock temperature. The kinetic energy flux results here can be directly compared to Figure 6 of Ryu et al. (2003), Figure 10 of Skillman et al. (2008), Figure 11 of Vazza et al. (2009), and can also be compared after unit conversions to Figure 6 of Pfrommer et al. (2006). Even though these simulations all vary in size and adopted cosmological parameters, the similarities in the kinetic energy flux processed by shocks is quite strong. This suggests that the underlying shock characteristics are quite well understood even if the particular radio emission models vary.

In the right panels of 13, we can see that there is a larger difference between the two simulations presented here in terms of the radio emission. This is likely due to the varying mass scales present in the simulations. We have also subsampled the simulation into random domains and found that a major contribution is confined to one of these subdomains.
One of the earliest studies of shocks in a cosmological context is found in Miniati et al. (2000), where the authors found similar shock structure and kinetic energy flux trends as is seen in this study, though in a unigrid context. They, too, found that intermediate Mach number shocks are responsible for processing the majority of kinetic energy. In a pioneering work, Miniati et al. (2001a) studied the injection and evolution of cosmic ray electrons. Using a framework to follow the cosmic ray distribution, they presented a radio power - core temperature relationship that shows strong similarity to what we have found with respect to cluster mass and X-ray luminosity, including a larger amount of scatter from cluster-to-cluster. Even though the resolution was modest compared to studies here, many of the primary characteristics of the radio emission are similar.
Much of our work presented here can be compared with that of Hoeft et al. (2008). We use the same radio emission model, but instead apply it to AMR simulations as opposed to smoothed particle hydrodynamic simulations. In particular, we can compare our radio relic luminosity function in Figure 12 to their Figure 9. After accounting for the different normalization, we find that we have more objects at . However, this result is from a small number of objects in our simulations and therefore future simulations with a larger sample of galaxy clusters are needed.
In Pfrommer et al. (2008), the authors studied the acceleration and emission properties of cosmic ray electrons and protons in a smoothed particle hydrodynamics setting which focused on a set of high resolution galaxy clusters. Many of the same characteristics of galaxy cluster radio relic emission that we found in this study are consistent with their results. The morphology of the radio relic emission is very similar to our results, though since they follow the electron population through time the emission is more diffuse compared to our simulated clusters. In another paper in the same series, Pfrommer (2008) study the scaling relationship between the radio synchrotron, gamma-ray, and inverse Compton emission from the same set of galaxy clusters. Their results when fitting the scaling relationship between radio synchrotron emission and cluster mass give a significantly shallower slope of . However, due to the small number of clusters in their study, it is difficult to tell if there is a meaningful difference between their results and the ones presented here. In future work it would be useful to run a series of high resolution AMR simulations using our methods to compare to their results.
5.2. Implications For Future Surveys
Our study has shown that nearly every cluster has radio emission and displays signs of radio relics at some stage in their evolution. When and where this radio emission occurs, however, is very sensitive to the merger and evolutionary state of the cluster. Current studies of radio relics have been confined to pointed observations of nearby, massive clusters, often based on strong X-ray emission. While this observational strategy does conform to our general results found in mass and X-ray scaling relationships, we have determined that not all X-ray luminous or massive clusters have significant relic emission. It is instead heavily biased towards disturbed, merging clusters. Because the surface brightness of these relics is low due to their extended nature, large surveys with near-future telescopes are unlikely to yield serendipitous discoveries of cluster radio emission. Instead, the focus should be on deep, multiwavelength, large field-of-view observations with sensitivity to extended diffuse radio emission of disturbed X-ray clusters.
Additionally, studies must include regions away from the peak X-ray emission. As was seen in Section 4, radio emission from shocks is generally brightest at the edges of clusters, surrounding the X-ray emission. This prescribes a fairly difficult observational roadmap, but the potential benefits include studying fundamental plasma physics phenomena such as in-situ shock electron acceleration and magnetic field structure. By combining statistical and morphological studies of these objects, we can readily compare them with the high-resolution hydrodynamical simulations presented here.
Our luminosity function, derived from the Warren et al. (2006) mass function, suggests what can be expected in future observational studies. With surface brightness sensitivity improvements of a factor of 10, we can expect to see an increase of a factor of 10-100 in the number of clusters with radio relics. Alternatively, an all-sky survey out to should result in the discovery of clusters above a luminosity of .
5.3. Limitations of the Models
There are several limitations to this study. First, we have not performed self-consistent MHD simulations, and instead adopted a scaling relationship between the post-shock density and magnetic field. This leads to the absence of any magnetic field configurations imprinting their structure on the radio relics. We plan to incorporate MHD simulations in future work. However, since in the cluster environments we study here, the magnitude of our radio emission should not change dramatically. We are also not presenting a self consistent view of magnetic field generation, evolution, and non-linear interactions with shocks or particle acceleration, all of which are poorly understood in a cosmological context.
Second, due to our relatively small box sizes, we have not captured the largest objects in the universe, which are likely to produce the brightest radio signatures. To account for this, we have provided an estimate using an analytic mass function combined with mass-luminosity scaling relationships. However, self-consistently capturing these very massive clusters is important, and will be explored in future work. Third, we also only follow recently accelerated electrons and ignore the aging of electron populations or re-accelerated electrons, which is likely to be important for radio halos and steep-spectrum objects. A more realistic model would follow the electron population “on-the-fly” and modify the acceleration efficiency as a function of pre-existing electron populations. Given that we assume radio emission only comes from electrons that have just been accelerated, this means that the radio relic luminosities shown are lower limits.
While our spatial and mass resolutions are quite good in the simulation, it is likely that increasing the resolution would have an affect on our results. Skillman et al. (2008) found that in terms of the kinetic energy processed by shocks, a peak spatial resolution of and a mass resolution of roughly was approaching a converged result, though perfect convergence was not seen. In our spatial resolution matches this value, while we are a factor of two above this mass resolution. For , we are likely not capturing all of the kinetic energy flux in low Mach number shocks, which would suggest a higher spatial and mass resolution simulation would lead to somewhat higher radio luminosity emission. This will likely always be the case since any increase in mass resolution will lead to a greater sampling of the mass function, allowing one to follow the merger assembly of galaxy clusters more accurately. This should increase the frequency of merger shocks, increasing overal radio emission.
Finally, the electron acceleration efficiency in Equation 3 is poorly constrained at present. With additional radio observations, particularly using next generation low frequency radio telescopes, along with new PIC simulations, we may be able to calibrate to more accurate values. This could be important in scaling the radio luminosity function in Figure 12 and estimating the number of radio relics expected in clusters and/or sky surveys.
6. Conclusions and Future Directions
We have carried out high resolution AMR cosmological simulations using our accurate shock finding algorithm with a radio emission model for shock-accelerated electrons to examine the properties of radio relics in galaxy clusters. From this model, our main results are:
-
We have produced synthetic radio maps of the large scale structure and cluster environments, showing the variety of radio relic morphologies and locations.
-
Through the use of 2D phase diagrams, we have found that while there is radio emission from both merger (internal) and accretion shocks, the emission from the hot, dense intracluster medium associated with the merger shocks dominate the total emission. This balance is redshift-dependent, with accretion shocks being more important at high redshift.
-
We have generated scaling relationships using over 2000 simulated halos that give insight to how radio emission scales with mass and X-ray luminosity. These relationships evolve with redshift and there is a large scatter for individual halos as a result of merger state.
-
By studying the time evolution of a cluster undergoing a merger, we find that the radio emission is highly dependent on the merger state, varying on time scales of a few hundred million years.
-
We have produced a synthetic radio luminosity function that gives observational predictions for the number of clusters with radio relics. This can be used to compare to future observed cluster luminosity functions and as a test of synchrotron emission models.
In future studies we plan to examine the merger history and morphology of these objects in greater detail. The redshift evolution of individual clusters is likely to be heavily correlated with merger state, and a statistical study of this relationship is vital to future observational studies. Finally, in order to correctly model these radio relics, we need to self-consistently follow the electron population, taking into account effects of particle aging and re-acceleration. Future studies will also examine larger cosmological volumes and implement techniques such as light cones.
Appendix A Varying Magnetic Field Models
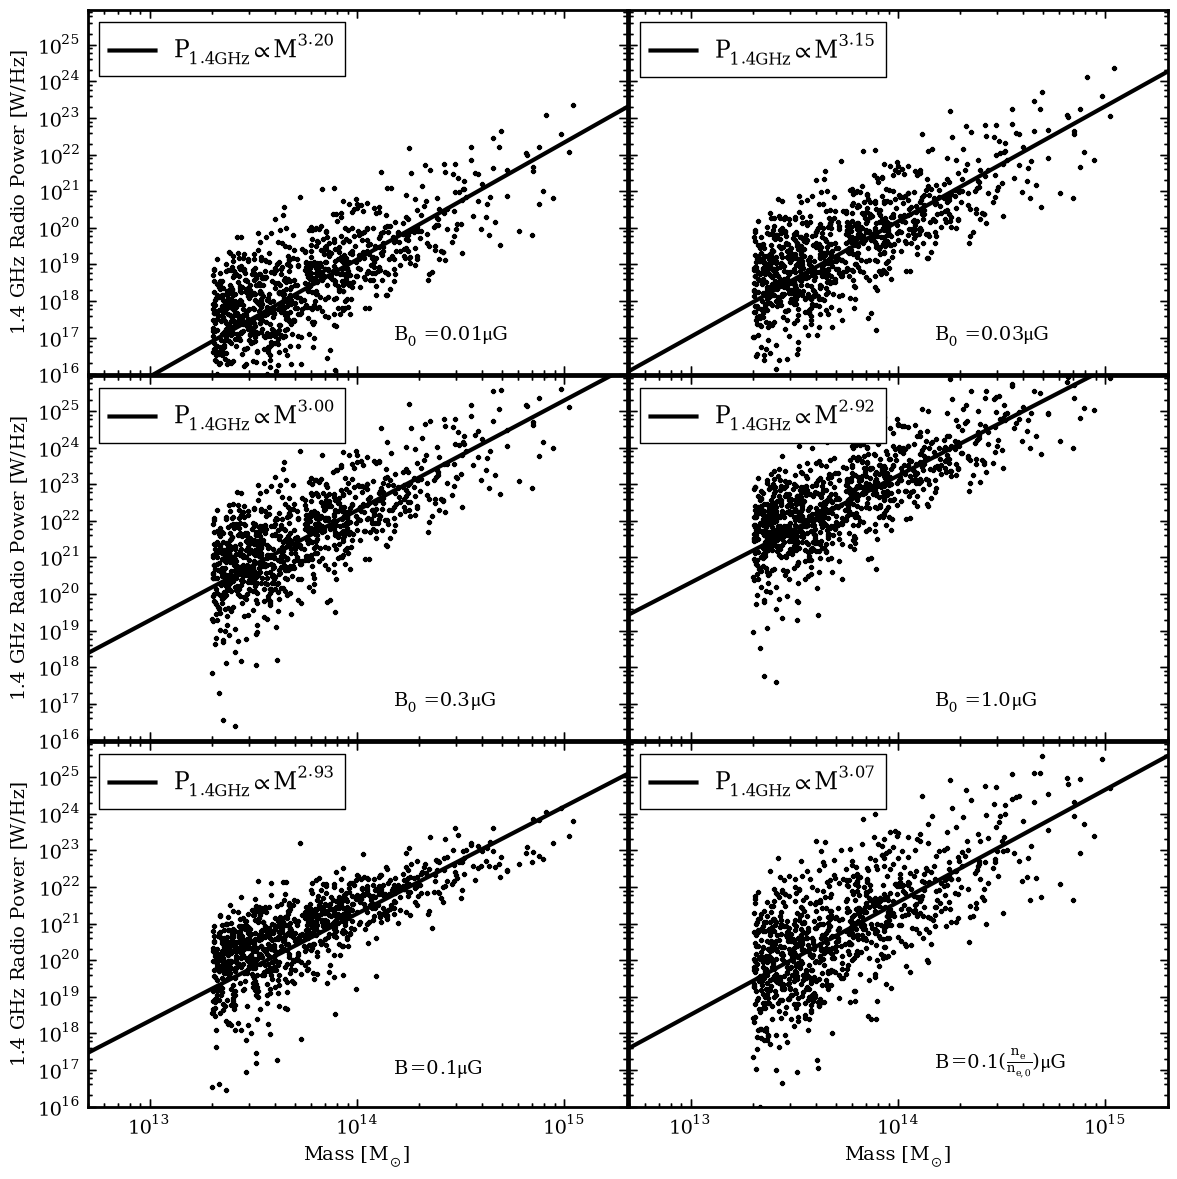
Here we briefly examine the impact of an alternate magnetic field model. We will concentrate on two of our results, and leave further in-depth analysis to future work. In both cases, we present 6 alternate models. The first four concentrate on changing the reference magnetic field value, . The second two models test the dependence of the magnetic field with respect to the electron number density. For these two cases, we chose simple parameterizations that simply give a feel for how this relationship affects our results. In one case, we keep the magnetic field constant throughout the domain at . In the second case, we scale the magnetic field proportionally with the number density , with and .
First we examined the fundamental impact on the phase of the gas responsible for the radio emission. In Figure 14 where we show the relative emission to our fiducial parameters, the primary effect of lowering is to decrease the total emission as roughly , as expected. If we instead increase , because it starts to become comparable to , the emission enhancement is preferably increased in the high temperature, low-Mach number regime corresponding to merger shocks. In the case where we have a flat magnetic field, the emission in the high temperature, high density, low Mach number regions is greatly diminished. However, the accretion shock emission is increased by a factor of 100-1000. If we let the magnetic field scale proportionally to number density, the opposite is true. Accretion shocks have weaker radio emission, whereas the merger shocks are more luminous.
If we instead examine the effect of a changing magnetic field model on the radio luminosity-mass relationship, we again find a coherent picture, as shown in Figure 15. The key concept is that as the magnetic field approaches , the added emission per unit increase is diminished by the second term in the denominator of Eq. (3). Therefore, for low values of when the magnetic field is much lower than , the higher magnetic field strengths in larger clusters has more of an effect, steepening the radio luminosity-mass relationship. On the other hand, when is increased, the relative gains in magnetic field in large clusters does not impact the emission as strongly, flattening the relationship. In changing the relationship, a flat magnetic field removes the density bias between large and small clusters, thereby flattening the scaling relationship. A linear scaling with number density increases this bias, steepening the relationship.

References
- Aleksić et al. (2010) Aleksić, J. et al. 2010, ApJ, 710, 634
- Bell (1978) Bell, A. R. 1978, MNRAS, 182, 147
- Berger & Colella (1989) Berger, M. J. & Colella, P. 1989, J. Comp. Phys., 82, 64
- Blandford & Eichler (1987) Blandford, R. & Eichler, D. 1987, Phys. Rep., 154, 1
- Blandford & Ostriker (1978) Blandford, R. D. & Ostriker, J. P. 1978, ApJ, 221, L29
- Bonafede et al. (2009) Bonafede, A., Giovannini, G., Feretti, L., Govoni, F., & Murgia, M. 2009, A&A, 494, 429
- Bondi & Hoyle (1944) Bondi, H. & Hoyle, F. 1944, MNRAS, 104, 273
- Brunetti et al. (2001) Brunetti, G., Setti, G., Feretti, L., & Giovannini, G. 2001, MNRAS, 320, 365
- Bryan & Norman (1997a) Bryan, G. & Norman, M. 1997a, 12th Kingston Meeting on Theoretical Astrophysics, proceedings of meeting held in Halifax; Nova Scotia; Canada October 17-19; 1996 (ASP Conference Series # 123), ed. D. Clarke. & M. Fall, 363
- Bryan & Norman (1997b) —. 1997b, Workshop on Structured Adaptive Mesh Refinement Grid Methods, ed. N. Chrisochoides (IMA Volumes in Mathematics No. 117), 433
- Bryan et al. (1995) Bryan, G. L., Norman, M. L., Stone, J. M., Cen, R., & Ostriker, J. P. 1995, Computer Physics Communications, 89, 149
- Burns & LUNAR Consortium (2009) Burns, J. O. & LUNAR Consortium, t. 2009, ArXiv e-prints
- Cassano et al. (2006) Cassano, R., Brunetti, G., & Setti, G. 2006, MNRAS, 369, 1577
- Clarke & Ensslin (2006) Clarke, T. E. & Ensslin, T. A. 2006, AJ, 131, 2900
- Clarke et al. (2001) Clarke, T. E., Kronberg, P. P., & Böhringer, H. 2001, ApJ, 547, L111
- Drury (1983) Drury, L. O. 1983, Reports on Progress in Physics, 46, 973
- Efstathiou et al. (1985) Efstathiou, G., Davis, M., White, S. D. M., & Frenk, C. S. 1985, ApJS, 57, 241
- Eisenstein & Hu (1999) Eisenstein, D. J. & Hu, W. 1999, ApJ, 511, 5
- Eisenstein & Hut (1998) Eisenstein, D. J. & Hut, P. 1998, ApJ, 498, 137
- Ensslin et al. (1998) Ensslin, T. A., Biermann, P. L., Klein, U., & Kohle, S. 1998, A&A, 332, 395
- Feretti (2002) Feretti, L. 2002, in IAU Symposium, Vol. 199, The Universe at Low Radio Frequencies, ed. A. Pramesh Rao, G. Swarup, & Gopal-Krishna, 133–+
- Ferland et al. (1998) Ferland, G. J., Korista, K. T., Verner, D. A., Ferguson, J. W., Kingdon, J. B., & Verner, E. M. 1998, PASP, 110, 761
- Fusco-Femiano et al. (2001) Fusco-Femiano, R., Dal Fiume, D., Orlandini, M., Brunetti, G., Feretti, L., & Giovannini, G. 2001, ApJ, 552, L97
- Giacintucci et al. (2008) Giacintucci, S. et al. 2008, ArXiv e-prints, 803
- Govoni et al. (2006) Govoni, F., Murgia, M., Feretti, L., Giovannini, G., Dolag, K., & Taylor, G. B. 2006, A&A, 460, 425
- Hockney & Eastwood (1988) Hockney, R. W. & Eastwood, J. W. 1988, Computer Simulation Using Particles (Institute of Physics Publishing)
- Hoeft & Brüggen (2007) Hoeft, M. & Brüggen, M. 2007, MNRAS, 375, 77
- Hoeft et al. (2008) Hoeft, M., Brüggen, M., Yepes, G., Gottlöber, S., & Schwope, A. 2008, MNRAS, 391, 1511
- Jones & Ellison (1991) Jones, F. C. & Ellison, D. C. 1991, Space Sci. Rev., 58, 259
- Kang et al. (2007) Kang, H., Ryu, D., Cen, R., & Ostriker, J. P. 2007, ApJ, 669, 729
- Komatsu et al. (2008) Komatsu, E. et al. 2008, ArXiv e-prints, 803
- Miniati et al. (2001a) Miniati, F., Jones, T. W., Kang, H., & Ryu, D. 2001a, ApJ, 562, 233
- Miniati et al. (2001b) Miniati, F., Ryu, D., Kang, H., & Jones, T. W. 2001b, ApJ, 559, 59
- Miniati et al. (2000) Miniati, F., Ryu, D., Kang, H., Jones, T. W., Cen, R., & Ostriker, J. P. 2000, ApJ, 542, 608
- Napier (2006) Napier, P. J. 2006, in Astronomical Society of the Pacific Conference Series, Vol. 356, Revealing the Molecular Universe: One Antenna is Never Enough, ed. D. C. Backer, J. M. Moran, & J. L. Turner, 65–+
- Norman & Bryan (1999) Norman, M. & Bryan, G. 1999, Numerical Astrophysics : Proceedings of the International Conference on Numerical Astrophysics 1998 (NAP98), held at the National Olympic Memorial Youth Center, Tokyo, Japan, March 10-13, 1998., ed. S. M. Miyama, K. Tomisaka, & T. Hanawa (Kluwer Academic), 19
- Orrú et al. (2007) Orrú, E. et al. 2007, A&A, 467, 943
- O’Shea et al. (2005a) O’Shea, B., Bryan, G., Bordner, J., Norman, M., Abel, T., & Harkness, R. amd Kritsuk, A. 2005a, Adaptive Mesh Refinement - Theory and Applications, ed. T. Plewa, T. Linde, & G. Weirs (Springer-Verlag), 341
- O’Shea et al. (2005b) O’Shea, B. W., Nagamine, K., Springel, V., Hernquist, L., & Norman, M. L. 2005b, ApJS, 160, 1
- Paul et al. (2011) Paul, S., Iapichino, L., Miniati, F., Bagchi, J., & Mannheim, K. 2011, ApJ, 726, 17
- Pfrommer (2008) Pfrommer, C. 2008, MNRAS, 385, 1242
- Pfrommer et al. (2008) Pfrommer, C., Enßlin, T. A., & Springel, V. 2008, MNRAS, 385, 1211
- Pfrommer et al. (2006) Pfrommer, C., Springel, V., Enßlin, T. A., & Jubelgas, M. 2006, MNRAS, 367, 113
- Rephaeli & Gruber (2003) Rephaeli, Y. & Gruber, D. 2003, ApJ, 595, 137
- Rephaeli et al. (2006) Rephaeli, Y., Gruber, D., & Arieli, Y. 2006, ApJ, 649, 673
- Roettiger et al. (1999) Roettiger, K., Stone, J. M., & Burns, J. O. 1999, ApJ, 518, 594
- Rottgering et al. (1997) Rottgering, H. J. A., Wieringa, M. H., Hunstead, R. W., & Ekers, R. D. 1997, MNRAS, 290, 577
- Rudnick et al. (2009) Rudnick, L. et al. 2009, in Astronomy, Vol. 2010, AGB Stars and Related Phenomenastro2010: The Astronomy and Astrophysics Decadal Survey, 253–+
- Ryu et al. (2008) Ryu, D., Kang, H., Cho, J., & Das, S. 2008, Science, 320, 909
- Ryu et al. (2003) Ryu, D., Kang, H., Hallman, E., & Jones, T. 2003, ApJ, 593, 599
- Skillman et al. (2008) Skillman, S., O’Shea, B., Hallman, E., Burns, J., & Norman, M. 2008, ApJ, 689, 1063
- Smith et al. (2008) Smith, B., Sigurdsson, S., & Abel, T. 2008, MNRAS, 385, 1443
- Spitkovsky (2008) Spitkovsky, A. 2008, ApJ, 682, L5
- Stone & Norman (1992a) Stone, J. M. & Norman, M. L. 1992a, ApJS, 80, 753
- Stone & Norman (1992b) —. 1992b, ApJS, 80, 791
- Turk et al. (2011) Turk, M. J., Smith, B. D., Oishi, J. S., Skory, S., Skillman, S. W., Abel, T., & Norman, M. L. 2011, ApJS, 192, 9
- van Weeren et al. (2009a) van Weeren, R. J. et al. 2009a, ArXiv e-prints
- van Weeren et al. (2009b) van Weeren, R. J., Rottgering, H. J. A., Bruggen, M., & Cohen, A. 2009b, ArXiv e-prints
- Vazza et al. (2009) Vazza, F., Brunetti, G., & Gheller, C. 2009, MNRAS, 395, 1333
- Warren et al. (2006) Warren, M. S., Abazajian, K., Holz, D. E., & Teodoro, L. 2006, ApJ, 646, 881
- Woodward & Colella (1984) Woodward, P. R. & Colella, P. 1984, J. Comp. Phys., 54, 174