Service de Physique de l’Etat Condensé, Orme des Merisiers, CEA Saclay (CNRS URA 2464), 91191 Gif sur Yvette cedex, France
Laboratoire des Champs Magnétiques Intenses, UPR 3228, CNRS-UJF-UPS-INSA, 31400 Toulouse, France
Superconducting Fluctuations, Pseudogap and Phase Diagram in Cuprates
Abstract
We report transport measurements using pulsed magnetic fields to suppress the superconducting fluctuations (SCF) conductivity in a series of YBa2Cu3O6+x samples. These experiments allow us altogether to measure the temperature at which SCF disappear, and the pseudogap temperature . While the latter are consistent with previous determinations of , we find that is slightly larger than similar data taken by Nernst measurements. A careful investigation near optimal doping shows that becomes smaller than , which is an unambiguous evidence that the pseudogap cannot be assigned to preformed pairs. Studies of the incidence of disorder on both and allow us to propose a phase diagram including disorder which explains most observations done in other cuprate families, and to discuss the available knowledge on the pseudogap line in the phase diagram.
pacs:
74.25.Dwpacs:
74.40.npacs:
74.72.Kfpacs:
74.62.EnSuperconductivity phase diagrams Fluctuation phenomena Pseudogap regime Effects of disorder
1 Introduction.
The discovery of High Temperature Superconductivity (HTSC) in the cuprates has been a turning point in the physics of correlated electron systems. Superconductivity (SC) happens indeed in a doped Mott insulator for which nobody would have predicted its occurrence beforehand [1]. While the search of the ”pairing glue” remains a very important aim, it has become progressively clear during the last 15 years that it would only be possible to solve this issue after understanding another remarkably robust experimental property of these systems, the pseudogap, which occurs most markedly in underdoped systems. The anomalous behaviour of the electronic properties of these compounds was discovered from a drop of the spin susceptibility measured by NMR shifts [2] below a temperature marking the opening of the pseudogap. Specific heat data [3] soon allowed to establish that the density of states is also strongly reduced. The pseudogap has been found generic, that is has a similar variation with doping in bilayer and monolayer [4] systems. Experimentally it was already clear [2] that decreases so abruptly with increasing doping that it was bound, as shown in Fig.1, either to intersect the SC dome or to merge with the SC line on the overdoped side of the phase diagram (PD). Surprisingly, even for such a simple experimental question, no consensus has been reached so far and the pseudogap line remains nearly evenly distributed between these two possibilities in most recent publications.
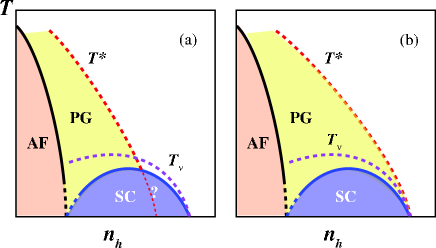
More importantly, these two types of PD have been associated with radically different physical explanations of the pseudogap phenomena [1], either a crossover (or even phase transition) towards a low correlated state independent or competing with SC [5, 6] for Fig.1a, or a simple precursor pairing state, the pseudogap limiting then the range where SC pairs survive as fluctuating entities above , for Fig.1b.
A strong support for a preformed pair scenario has been initially advocated from the detection of a large Nernst effect [7, 8, 9] and of diamagnetism above [10]. Indeed such effects could be associated with superconducting fluctuations (SCF) and/or vortices persisting in the normal state. These experiments introduced a new crossover line which one would like to locate in the phase diagrams of Fig.1. As the SCF or vortices require some coherence of the preformed pairs, the initial proposal that the onset of the Nernst effect occurred at , appeared plausible enough to link the pseudogap to the appearance of preformed pairs. However further data [11, 9] invalidated this simple relation between and and established that does not follow the increase of at low doping but rather drops and appears more related to the dome, especially for systems with reduced intrinsic disorder [9].
This inhibits any conclusion concerning the pseudogap to be taken so far from those experiments. So to discriminate between the PD of Fig.1, one rather needs to find external parameters acting differently on and the two crossover temperatures. Many attempts to locate a crossing of the and lines have been done by exploiting the robustness of to disorder, established early on [12, 13]. The reduction of by Zn substitution allowed through analyses of the specific heat [14] or the NMR shift [15] to conclude that, in presence of disorder, any possible value would be below slightly above optimal doping. This has been taken as evidence [14] that the pseudogap line crosses the SC dome and reaches , which would correspond to a quantum critical point (QCP). However this conclusion relies on the assumption that, even if merges with the onset of superconductivity, impurities would still suppress and not the pseudogap [15]. But so far no reliable experiment has ever established the occurrence of values within the SC dome [13].
The main experimental difficulty remains to distinguish signatures of the SCF and the pseudogap near optimal doping, both for macroscopic probes and for spectral studies by superconducting tunneling (STM) [16] or Angle Resolved Photoemission (ARPES) [17].
In the present work we therefore use a novel experimental approach we established recently [18], which allowed us to suppress the SCF contribution to the ab plane conductivity in single crystal samples with large pulsed magnetic fields. We do then delineate the onset of the SCF, which we find located slightly above and recover the variation of the normal state resistivity down to from which is determined independently. We exploit here this possibility to determine both and crossover lines with a single experiment and do give evidence that they intersect around optimal doping, which prohibits considering the pseudogap as the universal onset of pair formation, and favours the PD of Fig.1a. Our results allow us then to discuss the experimental significance of the pseudogaps detected by the spectroscopic experiments.
2 Samples and techniques
Single crystals of YBa2Cu3O6+x (YBCO) with various oxygen contents have been grown and electrically contacted as described elsewhere [19]. We have studied two underdoped samples (labelled as UD57 and UD85) with (taken at the midpoint of the resistive transition) of 57.1 and 84.6K corresponding approximatively to oxygen contents of 6.54 and 6.8 respectively, an optimally-doped sample (OPT93.6) with K and a slightly overdoped sample (OD92.7) with K. The hole doping in these different samples is estimated from the parabolic relationship between and [20].
Let us first recall the method we have proposed [18] to recover in high fields the magnetoresistance (MR)associated with the normal state quasiparticles. In a single band metal the transverse orbital MR can be written as
| (1) |
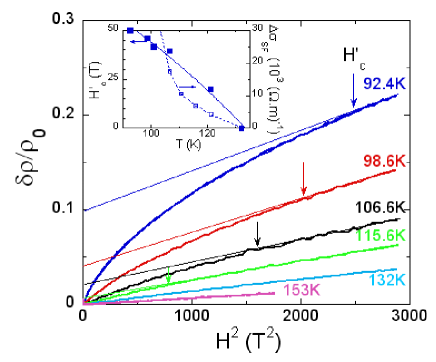
where is the cyclotron frequency and an electronic scattering time, so that, as shown by Harris et al [21], the dependence expected in the low field limit is obtained in the cuprates at high for moderate low fields. We have extended this approach by performing measurements, using pulse fields as large as 55 Tesla. In view of the required accuracy, we have eliminated any Hall contribution to the measured voltage by reversing the magnetic field. The dependence could be seen to persist in fields as large as 55 Tesla in the cuprates as long as . As exemplified in Fig.2 for the UD85 sample, indeed displays an variation for K, which indicates that the weak field limit still applies up to 55T.
However large departures with respect to this quadratic behaviour appear when is lowered towards . As already stated in the case of the UD57 [18], we associate the initial fast increase of with the applied field to the destruction by the applied field of the paraconductivity contribution. In such a case the normal state magnetoresistance is only recovered at fields exceeding a dependent threshold field . This experimental approach allows us then to single out the normal state properties and separate the contributions of SCF to the in plane transport.
3 Determination of
To analyse then the data, it appears quite natural to apply a two fluid model, for which, at a given , the conductivities due to the normal state quasi-particles and that of the superconducting fluctuations are additive, that is
| (2) |
At a given , the limiting high field behaviour displayed in Fig.2 allows us then to determine
| (3) |
Extending such an analysis to the various values for which the normal state can be recovered with 55Tesla applied field allows us then to determine both and from Eq.2 and Eq.3. Here we shall concentrate on the conditions for which is fully suppressed, that is for . It can be seen in Fig.2 that vanishes for increasing at a temperature which naturally coincides with that for which vanishes.
This procedure also allows us to extrapolate the zero field resistivity in the absence of SC fluctuations, which is identical to down to . As an example, the analysis of the UD85 sample data of Fig.2 yields the given in Fig.3.
Let us note that in the pure UD57 sample has been found larger [18] than the onset of found for the same samples [9], which reflects the fact that the SCF regime is a crossover towards normal state behaviour. The present method is then a quite sensitive experimental approach to study the magnitude of the SCF. The raw data similar to those in Fig.2 and the detailed analysis of the and dependences of will be discussed in a full report [22].
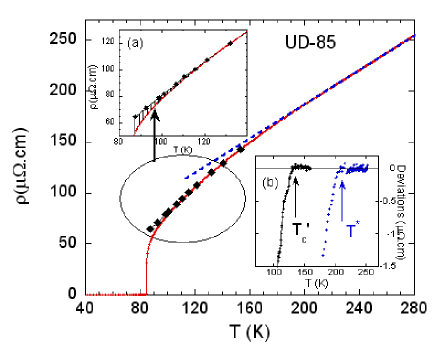
4 Normal state resistivity versus , determination of
In transport measurements, it has often been assumed that the pseudogap can be determined from the downward departure of from its linear high variation [23, 24, 25]. In very underdoped cases such as those of UD85 or UD57 one can determine directly without considering the occurrence of SCF at , as those two crossovers are quite well separated. For instance in UD85, the resistivity deviates from linearity below K, well above 130K as evidenced in Fig.3. This value of agrees well with that (250K) obtained from 89Y NMR shift data for similar oxygen contents [12, 26].
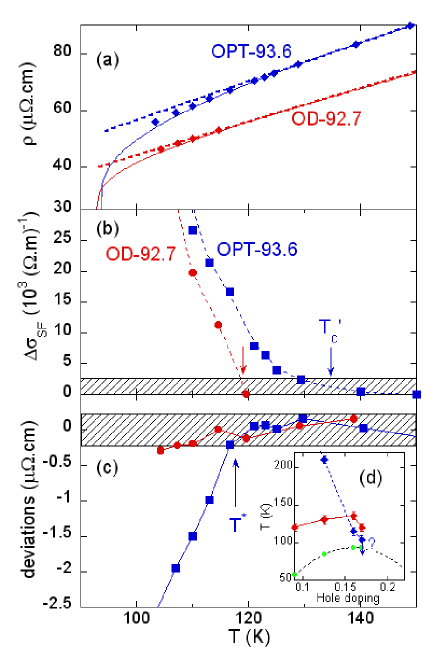
However, more care is required for larger dopings, when approaches . If one considers the zero field transport data given in Fig.4a for OPT93.6 and OD92.7, the slopes of the linear dependences of are quite well defined, and distinct downward deviations are apparent. Those could be associated with the pseudogap if one were to ignore the SCF. However, as can be seen in Fig.4b, the data for or give evidence that SCF are the primary source for these downturns, with values of 135(5) K and 120(5)K respectively (in agreement with diamagnetic measurements for the OPT sample [27]). But one can see on Fig.4a that, when the contribution of SCF is suppressed, the data for still displays a downward curvature due to the pseudogap. This is better displayed in Fig.4c, in which the deviation of from linearity has been magnified. There one can determine K for OPT-93.6, while one cannot ascertain any deviation for OD92.7 within experimental accuracy, so that K in that case. Notice that we consistently defined here and at temperatures for which deviations of or correspond to the same magnitude (hatched areas in Fig.4b and c).
So, while is always smaller than for underdoped samples, the present data give evidence that for OPT93.6, while for OD92.7 any possible value for would only also occur below . This establishes that the pseudogap line crosses the onset of SCF for a hole content slightly below optimal doping, as shown in Fig.4d, where the data for and are summarized versus the equivalent hole contents. This result definitively prohibits considering that the pseudogap could be the onset of pairing. We shall discuss its importance after showing the incidence of disorder on these two lines in the phase diagram.
5 Influence of disorder
It is well established that disorder strongly depresses while is not affected [12, 13]. This can be directly evidenced from resistivity measurements in electron irradiated crystals. Electron irradiation at low has been shown to introduce homogeneously distributed point defects without changing the hole doping [28, 29].
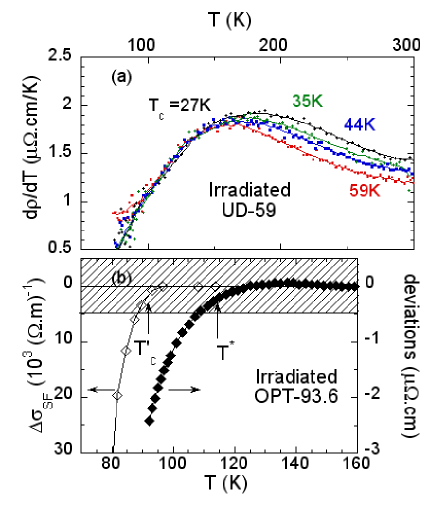
For an UD59 single crystal, Fig.5a shows that increases with decreasing below 300K, which would correspond to K, in agreement with to K found from NMR [2, 12, 14] for all samples with oxygen contents between 6.6 and 6.7 at the 60K plateau. In such samples one cannot use the deviation of from linearity to determine , as diffusion of oxygen takes place above room temperature yielding significant variations of the chain contributions to [30]. However it has been shown that the inflexion point in is located at [24, 25]111Ando et al. [31] propose another determination of based on the variation of the second derivative of the resistivity. This leads to much lower values of than those determined by NMR.. The fact that this point only slightly increases with increasing defect content is a good confirmation of the NMR results that is not modified by disorder . This is also a different phrasing of the evidence that Matthiessen’s rule applies in the normal state of cuprates [28]. On the contrary, we have previously shown from Nernst effect data [9] and high field measurements [18] that disorder depresses and , although in much less proportion than .
We have also performed pulse field measurements on an OPT-93.6 sample with reduced down to 70.7K by electron irradiation in order to test the influence of disorder on both and when these temperatures become comparable. As can be seen in Fig.5b, is found there to decrease markedly down to 92(4)K. Therefore, above 92K, the magnetoresistance remains quadratic in magnetic field and the data for is not influenced by SCF for this sample. The detected deviation from the high linear behaviour gives =114(6)K, in good agreement with that obtained above in the pure sample after suppressing the SCF in high fields. So we confirm here that defects depress and , but have a much smaller incidence on , which shows that these two crossover temperatures are associated with independent physical phenomena.
6 Discussion
The use of high applied fields has been essential in allowing us to depress the SCF in pure YBCO samples, which permits us to shed some light on the continuing debate concerning the pseudogap and SCF in cuprates. We do demonstrate that over the hole concentration range from underdoped to slightly overdoped, the SCF crossover and are quite similar. Furthermore is affected in the same manner by large applied fields. On the contrary the pseudogap crossover is shown to depend markedly on doping and to cross at optimal doping, so that the onset of pairing occurs there above . Here we have consistently located and for different dopings at temperatures corresponding to resistivity deviations of the same magnitude.
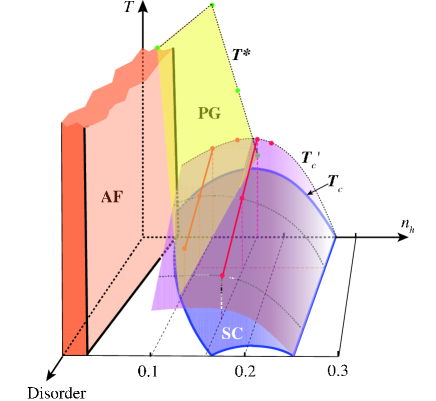
Furthermore we confirmed, within the same experimental procedure, that disorder does not affect while it depresses , so that the clean case phase diagram displayed in the inset of Fig.4c can be extended in a third dimension by introducing a disorder axis in Fig.6, for realistic ranges of disorder. There we display that i) the depression is faster for underdoped samples than for optimal ones, ii) the line does not evolve with disorder, iii) the onset of SCF decreases at a much slower rate in the underdoped case than for optimal doping.
Consequently the SCF regime appears then much more extended with respect to values in the underdoped samples when a large disorder is introduced. Such fluctuations were even detected in underdoped samples for which was nearly reduced to zero [18]. This PD therefore mimics the situation encountered for Nernst data taken in La2-xSrxCuO4, for which the SCF regime was found to be peaked in the underdoped range [8]. This agrees with our former proposal that large intrinsic disorder explains the metal to insulator crossover seen in that case. For similar dopings, YBCO remains in a well defined metallic state at low [32].
The specific behaviours of the SCF and of the pseudogap remain among the most important features of the cuprate physics. It is quite clear that, independently of the actual possible origin of the pseudogap, SCF are present above the 3D in these 2D systems with short coherence length. A detailed coherent analysis of these fluctuations will be performed elsewhere [22].
As for the pseudogap phenomenon, anomalies of distinct transport experiments have been detected above and assigned as well to the pseudogap, locating it at much higher values for optimal doping than found here. This has been the case for an increase in the c axis conductivity [33] or for the onset of in plane anisotropy of the Nernst coefficient [34] in YBCO samples. While in plane transport and magnetic susceptibilities have been studied at length in a variety of cuprates for the last twenty years, these recent experiments are less understood and might as well be unable to separate the SCF from the pseudogap. The reproducibility of the detected anomalies in other HTSC, and their insensitivity to disorder have not been established so far, so that their use to locate does not appear to us as robust as the present approach.
Meanwhile STM [16] or ARPES [17] spectroscopic experiments, have detected gaps in the energy spectrum, which are found to persist above in underdoped but also in overdoped cuprates . The excited states detected by STM experiments are easier to analyze in the overdoped cuprates in the absence of pseudogap [35, 36]. The d-wave superconducting gap detected at low does not fully disappear above the 3D , so that the remaining dips in the energy spectrum can only be associated with SCF in this doping range.
For optimally doped samples the SCF may extend below or above the onset of the pseudogap, as shown here. But it is not possible so far to use large enough fields to separate them in the spectroscopic ARPES and STM experiments. This explains why remnants of the SC gap due to SCF could be often taken inadvertently as ”pseudogaps”.
We have shown that the robustness of the pseudogap to disorder is an important clue to separate its spectral features from those associated with SC. In the STM and ARPES experiments for which surface inhomogeneities are apparently extremely important [37], it seems to us that the large gap detected in underdoped samples ought to be associated with the pseudogap, in view of its robustness and reproducibility. The Fermi arcs (or pockets) are also undoubtedly experimental features associated with the pseudogap state.
The pseudogap being distinct from SCF, one then expects to detect different spectral responses by STM or ARPES for these two phenomena below optimal doping. But for underdoped samples experimental difficulties could have been anticipated from the early experiments on the cuprates. Indeed, NMR experiments have shown for long that the depression of at low is so large that it was nearly impossible to detect the further reduction of expected below . So if the large gap detected in the underdoped systems is indeed associated with the pseudogap, it renders quite difficult the detection of spectral modifications occurring then below . This explains the debate between one gap [38] and two gap scenarios [39, 40] which has been engaged for a while, and for which no consensus has emerged so far.
Finally, if any feature detected above is not always connected with the pseudogap, one may wonder as well if anything detected below is an essential phenomenon or a secondary transition which might be non universal to the cuprate physics and driven by specific system details. If a competing order which breaks time reversal symmetry occurs somewhat below the determined here [41, 42, 43], one still needs to establish the correlation between the various experimental aspects of the pseudogap -loss of spin susceptibility, transfer of spectral weight from low to high energies, Fermi arc observations,…- and the symmetry breaking.
Acknowledgements.
This work was supported by ANR grant NT05-4_41913. We thank C. Proust for support during experiments at LNCMP-Toulouse which have been funded by the FP6 ”Structuring the European Research Area, Research Infrastructure Action” contract R113-CT2004-506239.References
- [1] \NameLee P. A., Nagaosa N. Wen X.G. \ReviewRMP 78 2006 17.
- [2] \NameAlloul H., Ohno T. Mendels P. \ReviewPhys. Rev. Lett. 63 1989 1700.
- [3] \NameLoram J. W. et al. \ReviewPhys. Rev. Lett. 71 1993 1740.
- [4] \NameBobroff J. et al. \ReviewPhys. Rev. Lett. 78 1997 3757.
- [5] \NameEmery V.J. Kivelson S.A. \ReviewNature 374 1995 434.
- [6] \NameVarma C.M. \ReviewPhys. Rev. B 55 1997 14554; \ReviewPhys. Rev.Lett. 83 1999 3538.
- [7] \NameCapan C. et al. \ReviewPhys. Rev. Lett. 88 2002 056601.
- [8] \NameWang Y. et al. \ReviewScience 299 2003 86.
- [9] \NameRullier-Albenque F. et al. \ReviewPhys. Rev. Lett. 96 2006 067002.
- [10] \NameWang Y. et al. \ReviewPhys. Rev. Lett. 95 2005 247002.
- [11] \NameWang Y., Li L. Ong N.P. \ReviewPhys. Rev. B 73 2006 024510.
- [12] \NameAlloul H. et al. \ReviewPhys. Rev. Lett. 67 1991 3140.
- [13] \NameAlloul H. et al. \ReviewRev. Mod. Phys. 81 2009 45.
- [14] \NameWilliams G.V.M. et al. \ReviewPhys.Rev. Lett. 78 1997 721.
- [15] \NameMahajan A.V. et al. \ReviewPhys. Rev. Lett. 72 1994 3100.
- [16] \NameRenner Ch. et al. \ReviewPhys. Rev. Lett. 80 1998 149.
- [17] \NameDing H. et al. \ReviewNature 382 1996 51; \NameMarshall D. S. et al. \ReviewPhys. Rev. Lett. 76 1996 4841.
- [18] \NameRullier-Albenque F. et al. \ReviewPhys. Rev. Lett. 99 2007 027003.
- [19] \NameRullier-Albenque F. et al. \ReviewEurophys. Lett. 50 2000 81.
- [20] \NameTallon J.L. et al. \ReviewPhys. Rev. B 51 1995 12911.
- [21] \NameHarris J.M. et al. \ReviewPhys. Rev. Lett. 75 1995 1391.
- [22] \NameRullier-Albenque F. et al. in preparation.
- [23] \NameIto T. et al. \ReviewPhys. Rev. Lett. 70 1993 3995.
- [24] \NameWuyts B., Moshchalkov V. V. Bruynseraede Y. \ReviewPhys. RevB 53 1996 9418.
- [25] \NameKonstantinovic Z., Li Z. Raffy H. \ReviewPhysica C 351 2001 1297.
- [26] \NameTallon J.L. Loram J.W. \ReviewPhysica C 349 2001 53.
- [27] \NameLi L. et al. \ReviewPhys. Rev.B 81 2010 054510.
- [28] \NameRullier-Albenque F., Alloul H. Tourbot R. \ReviewPhys. Rev. Lett. 87 2001 157001.
- [29] \NameRullier-Albenque F., Alloul H. Tourbot R. \ReviewPhys. Rev. Lett. 91 2003 047001.
- [30] \NameLavrov A.N. Kozeeva L.P. \ReviewPhysica C 253 1995 313 and references therein.
- [31] \NameAndo Y. et al. \ReviewPhys. Rev. Lett. 93 2004 267001.
- [32] \NameRullier-Albenque F. et al. \ReviewEurophys. Lett. 81 2008 37008.
- [33] \NameShibauchi T. et al. \ReviewPhys. Rev. Lett. 86 2001 5763.
- [34] \NameDaou R. et al. \ReviewNature 463 2010 519.
- [35] \NameKugler M. et al. \ReviewPhys. Rev. Lett.86 2001 4911.
- [36] \NameGomes K.K. et al. \ReviewNature 447 2007 569.
- [37] \NameLang K.M. et al. \ReviewNature 415 2002 412.
- [38] \NameKanigel A. et al. \ReviewPhys. Rev. Lett. 101 2008 137002.
- [39] \NameLe Tacon M. et al. \ReviewNature Physics 2 2006 537.
- [40] \NameLee W.S. et al. \ReviewNature 450 2007 81.
- [41] \NameKaminski A. et al. \ReviewNature 416 2002 610.
- [42] \NameFauqué B. et al. \ReviewPhys. Rev. Lett. 96 2006 197001.
- [43] \NameXia J. et al. \ReviewPhys. Rev. Lett. 100 2008 127002.