The Directly Imaged Planet around the Young Solar Analog 1RXS J160929.1-210524: Confirmation of Common Proper Motion, Temperature and Mass
Abstract
Giant planets are usually thought to form within a few tens of AU of their host stars, and hence it came as a surprise when we found what appeared to be a planetary mass ( 0.008 ) companion around the 5 Myr-old solar mass star 1RXS J160929.1-210524 in the Upper Scorpius association. At the time, we took the object’s membership in Upper Scorpius —established from near-infrared, - and -band spectroscopy— and its proximity (2.2″, or 330 AU) to the primary as strong evidence for companionship, but could not verify their common proper motion. Here, we present follow-up astrometric measurements that confirm that the companion is indeed co-moving with the primary star, which we interpret as evidence that it is a truly bound planetary mass companion. We also present new -band spectroscopy and 3.0-3.8 m photometry of the companion. Based on a comparison with model spectra, these new measurements are consistent with the previous estimate of the companion effective temperature of K. We present a new estimate of the companion mass based on evolution models and the calculated bolometric luminosity of the companion; we obtain a value of , again consistent with our previous result. Finally, we present angular differential imaging observations of the system allowing us to rule out additional planets in the system more massive than 1 , 2 and 8 at projected separations larger than 3″ (440 AU), 0.7″ (100 AU) and 0.35″ (50 AU), respectively. This companion is the least massive known to date at such a large orbital distance; it shows that objects in the planetary mass range exist at orbital separations of several hundred AU, posing a serious challenge for current formation models.
Subject headings:
stars: pre-main sequence — stars: low-mass, brown dwarfs — planetary systems1. Introduction
The detection and characterization of low-mass substellar companions on large orbits (over several tens of AU) around stars is of great importance for our understanding of planet, brown dwarf and star formation, as well as for our understanding of the dynamical evolution of such companions in multiple systems or in circumstellar disks. Currently most formation models of planets or low-mass brown dwarf companions – core accretion (e.g. Pollack et al., 1996), gravitational instability (e.g. Boss, 1997) and fragmentation of a pre-stellar core (e.g. Padoan & Nordlund, 2002; Bate et al., 2003) – cannot easily explain the existence of such companions at large orbital separations. A good determination of the semi-major axis, mass and mass ratio distributions of far out giant planets will help us understand these mechanisms in more detail and disentangle the role played by each one.
Over the past decade, observations of young stars have led to the discovery of several companions with separations of several tens to hundreds of AU and masses only slightly above the 13 deuterium burning limit: TWA 5 B (Lowrance et al., 1999), AB Pic B (Chauvin et al., 2005b), GQ Lub B (Neuhäuser et al., 2005), DH Tau B (Itoh et al., 2005), CHXR 73 B (Luhman et al., 2006), LP 261-75 B (Reid & Walkowicz, 2006), HN Peg B (Luhman et al., 2007), and CT Cha B (Schmidt et al., 2008). For higher mass brown dwarf companions, the list of known companions with similar orbital separations is even longer, the reader is referred to Zuckerman & Song (2009) for a recent compilation. More recently, the mass limit of known substellar companions on very wide orbits has been pushed down below the deuterium burning limit —i.e. in the planetary range— by a rapid succession of discoveries, an 8 planetary mass object around the young solar analog 1RXS J160929.1-210524 (Lafrenière et al., 2008; hereafter called Paper I), three 7–10 planets around the A-type star HR 8799 (Marois et al., 2008), a 1 planet orbiting inside the dust belt of the A-type star Fomalhaut (Kalas et al., 2008), and an 8 planet candidate within the circumstellar disk of the A-type star Pictoris (Lagrange et al., 2009). The newly-found companion to the Sun-like star GJ 758 (Thalmann et al., 2009), a 10–40 object orbiting at a separation of 29 AU, could add to the list of planetary mass companions if its true age turns out to be at the young end of current estimates. A few planetary mass objects have also been found in large orbits around brown dwarf primaries: 2MASS 1207b (Chauvin et al., 2005a), 2MASS 0441b (Todorov et al., 2010) and possibly UScoCTIO 108 b (Béjar et al., 2008). Beside actual planet detections, observations of asymmetries or ring-like structures in some debris disks offer indirect evidence for the presence of planets on large orbits around stars. Good examples include Pic, HR 4796, Eri, Vega, HD 141569, Corvi, Fomalhaut, and AB Aur (Holland et al., 1998; Greaves et al., 1998; Weinberger et al., 1999; Schneider et al., 1999; Kalas et al., 2005; Wyatt et al., 2005; Oppenheimer et al., 2008; see also Wyatt 2008). The peculiar disk morphologies observed in those systems could arise from gravitational perturbations by unseen planets. Modeling indicates that Neptune to Jupiter mass planets at several tens of AUs are typically needed to reproduce the observations. Although the current picture is still far from complete, all of these results offer a very interesting first glimpse of the full extent of orbital separations and masses of giant planets and low-mass brown dwarf companions around stars.
The planetary mass candidate companion to the young solar mass star 1RXS J160929.1-210524, which is a member of the 5 Myr-old Upper Scorpius association (Preibisch et al., 2002) is the subject of this paper. The candidate companion, lying only 2.2″(330 AU projected) from the primary star, appears to be a young planetary mass ( ) object in the Upper Sco association, based on near-infrared imaging () and spectroscopy (). In particular, the triangular shape of its -band spectrum clearly indicates low surface gravity, and the overall spectrum is in excellent agreement with the spectra of known low-mass brown dwarfs in the same association as well as with model spectra with K and , consistent with the inferred age and mass. While at the time of discovery, we had no proper motion measurements and hence could not confirm it was gravitationally bound, the proximity and youth of the candidate companion offered very compelling evidence that the two form a bound pair. In this paper, we present follow-up astrometric observations that confirm the common proper motion of the candidate companion with the primary star. In addition, to improve the characterization of this system, we present new photometric observations at 3.05 m and 3.78 m (), new spectroscopic observations in the -band, and new high-contrast angular differential imaging (ADI, Marois et al., 2006) observations.
2. Observations and data reduction
All observations used for this paper111In addition to the observations described in this paper, we also obtained exploratory VLA observations at 21 and 6 cm as the NVSS catalog lists a radio source with a brightness of 5 mJy near the source. However the radio source is not associated; at 6 cm, the 0.7 mJy point source is at and . were obtained with the Gemini North telescope and the ALTAIR adaptive optics system (Herriot et al., 2000). The target star itself was used for wave front sensing and the field lens of ALTAIR was used to reduce off-axis Strehl degradation due to anisoplanatism.
2.1. Imaging
All imaging observations were obtained with the NIRI camera (Hodapp et al., 2003) in mode. Used with the AO system and the field lens, this yields a pixel scale of 21.4 mas and a field of view of for the full detector array.
The initial imaging observations of 1RXS J1609-2105 were obtained in 2008 April and June and are detailed in Paper I. For astrometric follow-up of the candidate companion, the star was observed again on 2009 April 6 and 2009 July 1. These observations were made in the filter and used a 5-point dither pattern corresponding to the center and four corners of a square of side 10″. At each dither position, we obtained one co-addition of thirty 0.3 s integrations in fast, high read-noise mode, and one 10 s integration in slow, low read-noise mode. At each position this provides an unsaturated image of the target star and a much deeper image of the field that can be spatially registered and scaled in flux without ambiguity.
These imaging data were reduced using custom IDL routines. A sky frame was constructed by taking the median of the images at all dither positions after masking out the regions dominated by the target’s signal. After subtraction of this sky frame, the images were divided by a normalized flat-field. Then isolated bad pixels were replaced by the interpolated value of a third-order polynomial surface fit to the good pixels in a pixels box while clustered bad pixels were simply masked out. Next the images were distortion corrected using the distortion solution provided by the Gemini staff.222The distortion correction used is centro-symmetric and is given by , where and are respectively the distortion-corrected and distorted radial pixel distances from the array center. Finally, the long-exposure images were properly scaled in intensity and merged with their corresponding short-exposure images.
Follow-up observations of the system were also obtained at 3.05 m (H2O ice filter, 5% bandpass) and 3.78 m ( filter) on 2009 May 2 and 2009 June 8, respectively, to constrain the spectral energy distribution of the candidate companion further. For 3.05 m, 20 co-additions of ten 5 s integrations were obtained over 20 dither positions covering a square of side 8″. To enable a shorter integration time and avoid saturation for 3.78 m, only the central pixels of the array was read and 30 co-additions of three hundred 0.2 s integrations were obtained over 30 dither positions covering a square of side 6″.
For the long wavelength imaging, the data reduction involved first removing the sky background by subtracting, for each image, the mean of the two images acquired closest in time for which the star is not located in the vicinity of the candidate companion in the image considered. The images were then divided by a normalized flat field image created by taking the median of all images after masking out the star in each one and normalizing them to a median value of one. A pixels median-filtered image was subsequently subtracted from each image to remove any low spatial frequency residual background signal, which was occasionally present; to avoid any potential bias in doing this, the median filter was computed after masking out a pixel box over the star and companion. All images were finally aligned and combined using a 3 clipped average.
An angular differential imaging (ADI, Marois et al. 2006) sequence of observations was obtained on 2009 April 6 to search for additional, closer and/or fainter companions in the system. These observations were done in the filter and only the central pixel region of the detector was read. The main ADI sequence consisted of 320 exposures of 10 s in low read noise mode; after every 20 of these images, two short, unsaturated co-additions of ten 0.3 s exposures in medium read noise mode were obtained to monitor the star position, the Strehl ratio, and the sky transparency. The total duration of the sequence is 1.9 hours and the total field of view rotation is 39°. Both before and after the main ADI sequence, a 5-position dither pattern of short unsaturated observations () was obtained to provide a sky frame for the reduction of the short exposures as well as additional image of the point-spread-function (PSF) core.
The short, unsaturated exposures for the ADI observations were reduced as above for the -band imaging. The long, saturated exposures were dark subtracted, divided by a normalized flat field image, corrected for distortion using the solution provided by the Gemini staff, and padded with zeros to increase their size to pixels and thus avoid loosing parts of the field of view during subsequent shifts and rotations. Bad pixels were corrected or masked as explained above. To compensate for possible variations in AO correction and sky transparency, each long, saturated image was intensity scaled to a common flux in an aperture of radius 4 pixels by interpolating the values measured for the short, unsaturated images obtained through the ADI sequence; these intensity corrections were 11% on average. The center of the stellar PSF in all saturated images was found by maximizing their cross-correlation with the closest unsaturated image in an annulus where both images are unsaturated; the images were then then shifted to position the star at the center of the frame. As a verification of the star positions determined in this way, we calculated the centroid of the planetary mass companion for all centered, de-rotated images and found a scatter of only 0.12 pixels per axis. An azimuthally symmetric intensity profile was then subtracted from each image to remove the smooth seeing halo. Next, the stellar PSF speckles were removed from each image by subtracting an optimized reference PSF image obtained using the “locally optimized combination of images” (LOCI) algorithm detailed in Lafrenière et al. (2007b). The individual residual images were then rotated to align their FOV and their median was taken to obtain the final residual image.
2.2. Spectroscopy
The spectroscopic observations in and , obtained on 2008 June 21 and 2008 August 21 and 24 with NIRI, have already been presented in Lafrenière et al. (2009). The new -band spectroscopic observations were obtained with the integral field spectrograph NIFS (McGregor et al., 2003) on 2009 July 3. The grating was used with the blocking filter, yielding a spectral resolving power of 6000. Given the lower Strehl ratio in the band and the proximity and contrast of the candidate companion relative to the primary star, the observations were obtained in ADI mode to enable a subtraction of the primary star PSF from every spectral slice of the data cube. The primary star was positioned near a corner of the NIFS field of view and the position angle of the instrument was adjusted to ensure that the candidate companion would remain within the field of view during the ADI sequence. The individual exposure time was 240 in low read noise mode. The observations were split into two sub-sequences, of 15 and 10 exposures respectively, each one immediately followed by observation of an Ar lamp for wavelength calibration and of the A0 star HD 155379 for telluric and instrumental transmission correction. Before the first sequence and after the second sequence, two images were obtained with a dither of 15″ to provide a sky frame. A standard NIFS flat field calibration sequence was also obtained.
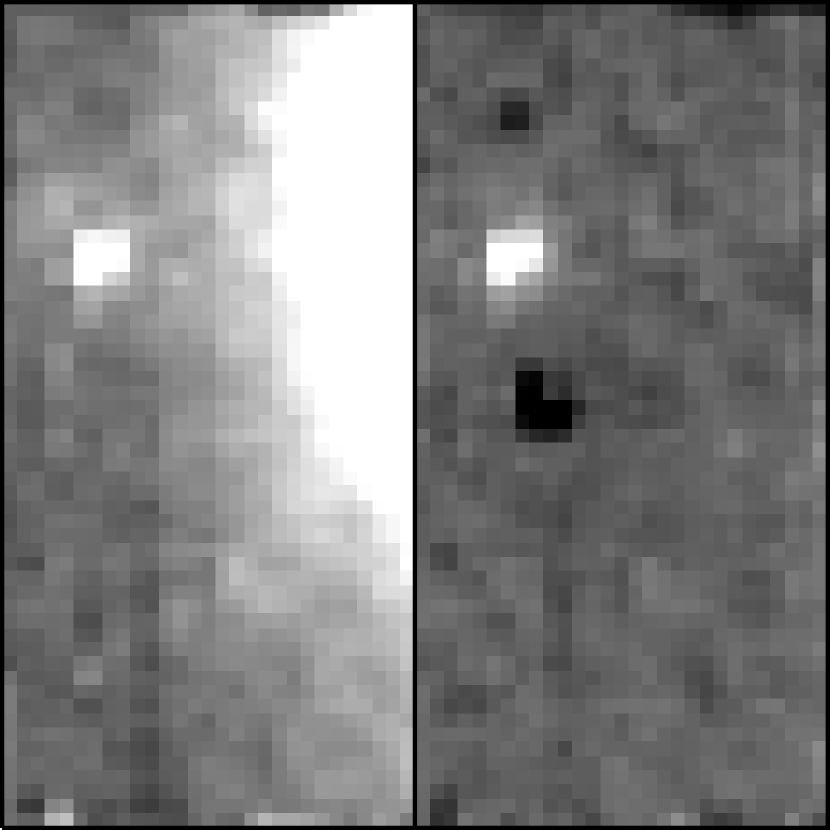
The reduction of the NIFS data, up to the reconstruction of the data cube, was made using the Gemini IRAF pipeline. The steps covered in this pipeline are sky background subtraction, flat-field and bad pixel correction, spatial and spectral calibration, and data cube reconstruction. The spatial sampling of the reconstructed data cube is 0.043″ pixel-1. The instrumental/telluric transmission correction and spectrum extraction, which could be done using the Gemini pipeline, were instead done using custom IDL routines as described below. First the center of the stellar PSF were registered to a common position in all slices and all cubes of the sequence; the center positions were calculated by fitting a 2D Gaussian function. The stellar PSF was then subtracted, slice by slice, using a LOCI algorithm. The ‘allowed’ reference images included all those in which the companion had moved by at least 9 pixels (0.4″) due to field of view rotation. The optimization region was a section of annulus with inner and outer radii of 1.63″ and 2.24″ (14 pixel wide), respectively, excluding disks of diameter 8 pixels at each positions where the companion was present in any of the images to avoid any bias during the subtraction. Figure 1 shows the collapsed cube before and after PSF subtraction. Following PSF subtraction, the spectrum of the companion was extracted by summing the flux in a circular aperture of diameter 5 pixels. The spectrum of the telluric standard was extracted using the same aperture, corrected for its spectral slope using a 9520 K blackbody curve, and its Paschen line at 1.28 m was removed by dividing out a Voigt profile fit. The companion spectrum was divided by this spectrum to correct for telluric and instrumental transmission. Finally, the median of the 25 companion spectra was obtained.
3. Analysis and results
3.1. Verification of common proper motion
The relative position and flux ratio of the star and companion were determined in two ways which yielded values in very good agreement. First, the centroids were determined by fitting a 2D Gaussian function to both components and their flux ratio was found using aperture photometry. Second, the relative position and relative flux were determined simultaneously by minimizing the residual noise after subtraction of one component from the other. For a given observation, these measurements were repeated for all dither positions and their average was taken. The NIRI+ALTAIR with field lens pixel scale of 21.4 mas pixel-1 and sky position angle from the images FITS headers were used to convert image coordinates to separations and position angles. We did not observe astrometric standards to monitor and calibrate possible changes in the pixel scale of the instrument between the epochs; such changes could occur, in principle, as a result of small changes in the shape or position of some components of the telescope, AO system or camera. Nevertheless, we can calculate upper limits on pixel scale changes using several background sources in our field of view (see §3.3). For this purpose we used four background stars that have been well detected at all epochs. At each epoch, we computed the mean length and position angle of all baselines between these four stars (6 baselines, lengths of 180–475 pixels). We then calculated the changes in values between the epochs for each baseline, and we finally computed, for each epoch, the average change over all baselines. The maximum pixel scale change observed was 0.14%, corresponding to 3 mas at the separation of the companion (2.219″ or 103.7 pixels), and the maximum change in position angle was 0.05°. These changes constitute upper limits as they can be affected by non-zero proper motion of the background sources. Beside these possible changes in pixel scale, our measurements are affected by larger systematic uncertainties which are estimated below. We also note that, as mentioned on the Altair webpage333http://www.gemini.edu/sciops/instruments/altair/field-lens-option, the plate scale of NIRI when used with the field lens of Altair is not accurately calibrated. This does not affect our analysis below but we mention it as it should be considered when comparing our measurements with data from other telescopes or other instruments.
| Epoch | Band | (″) | P.A. (deg) |
|---|---|---|---|
| 2008.3205 | |||
| 2008.4596 | |||
| 2008.4596 | |||
| 2009.2621 | |||
| 2009.4972 |
Note. — The position reported in the discovery paper was the mean of the first three rows.
Table 1 provides a list of our astrometric measurements and figure 2 shows the changes in offset between the companion and primary over all epochs compared with the expected changes for a distant background star, based on the proper motion and estimated distance of the primary; the figure also shows the same measurements for four background stars. For the proper motion of the primary, we used the value given in the UCAC3 catalog (Zacharias et al., 2009): mas yr-1 in RA and mas yr-1 in DEC. A few other values, differing by less than 6 mas yr-1 per axis, are also available in the literature but have larger uncertainties; using those other values would not affect our conclusions. For the parallax motion we assumed the mean distance and spread of the Upper Sco association given in Preibisch et al. (2002), namely pc. As visible on the figure, the background star measurements are in good agreement with the background source model, although there are large systematic errors for the individual data points. These systematic errors are likely due in part to residual geometric distortion. The average absolute difference between the measurements and the model for the background stars is 4.5 mas in both RA and DEC, or 6 mas in separation and 0.1° in position angle; we adopt these values as our overall astrometric errors. Figure 2 also clearly shows that, within our uncertainties, the companion’s position relative to the primary did not change over time; conversely, the measurements for the companion are inconsistent with the background model. From the earliest to the latest epoch, the measurements are off from the background source hypothesis. The values for the common proper motion or background source hypotheses are 2.3 and 33, respectively. A simple linear fit of the astrometry measurements with time yields changes of mas yr-1 for the separation and deg yr-1 for the position angle (or mas yr-1 in RA and mas yr-1 in DEC), providing limits on the differential motion of the companion. Our precision is insufficient, however, to constrain the orbital motion of the companion, expected to be 2.2 mas yr-1 assuming that the planet semi-major axis is close to its projected separation.
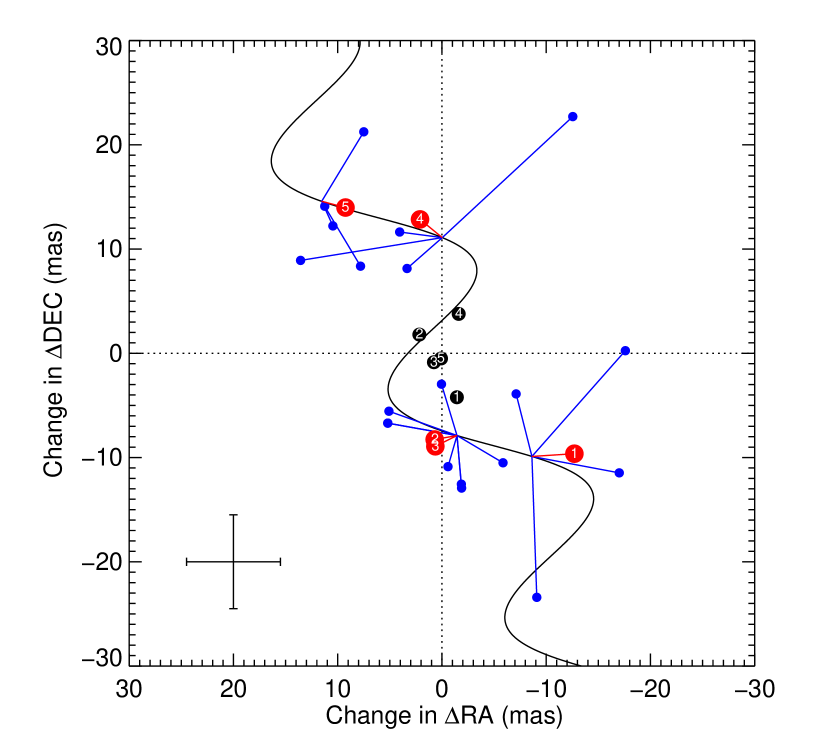
Our new measurements clearly confirm the common proper motion of the two objects, but as pointed out in Paper I this does not in itself prove physical association as the velocity dispersion in the Upper Sco association is small. We previously presented an analysis indicating that, conservatively, the probability that a planetary mass object in Upper Sco would fall within 2.5″ of any of the stellar members we observed is only 0.002. We can now factor the common proper motion constraint into the analysis. Using the proper motion dispersion of 8 mas yr-1 in RA and DEC reported by (Bouy & Martín, 2009) for the low-mass members of Upper Sco, the probability that two unrelated Upper Sco objects would share a common proper motion within 4-5 mas yr-1 per axis, as we have observed, is 0.13. Thus taken together, the proximity and common proper motion of the primary and companion indicate a probability of of chance alignment. So given this very small probability, despite the lack of orbital motion detection, we treat the candidate companion as a truly bound companion for the remainder of this paper.
3.2. Properties of the companion
The new -band spectrum of the companion is shown in Fig. 3 along with the spectrum of a field L3 dwarf, the spectrum of a young L0 brown dwarf member of Upper Sco, and model spectra from the DUSTY (Chabrier et al., 2000) and DRIFT PHOENIX (Witte et al., 2009; Helling et al., 2008) atmosphere models for low and high surface gravity. The new -band spectrum shows typical features of late-M or early-L dwarfs, namely important absorption by H2O beyond 1.33 m, the K I doublet at 1.24-1.25 m, and absorption by FeH at 1.24 m; the S/N is too small to identify other individual features but the general shape of the continuum is qualitatively as expected through the band. As seen from the reasonable agreement with the model spectrum of K, the new spectrum is consistent with the previous estimate of the effective temperature of the companion.
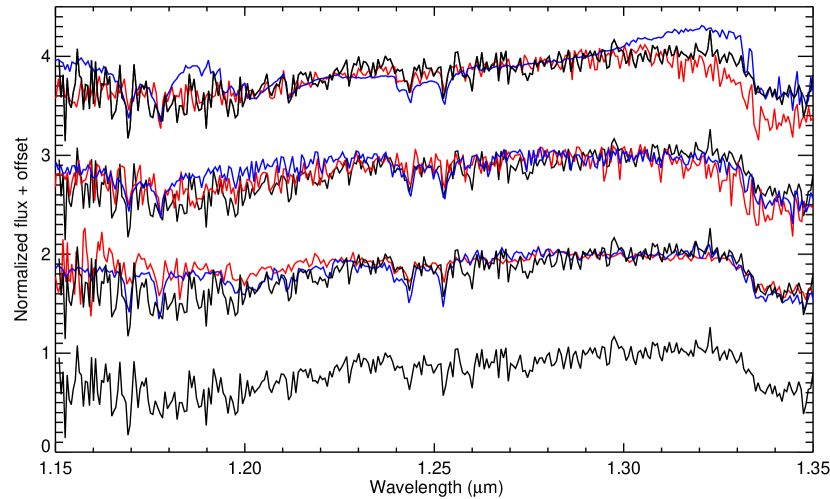
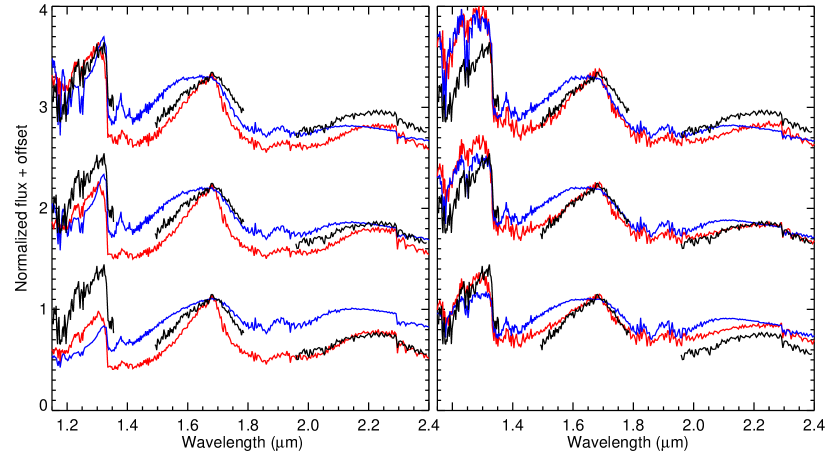
Figure 4 shows the merged spectrum of 1RXS J1609-2105 b along with synthetic spectra from the DUSTY and DRIFT PHOENIX atmosphere models for different temperatures and surface gravities. From this figure, it is clear that the companion has low surface gravity: the slope of the continuum through the and bands are much better fit by low gravity spectra for both sets of models. The DRIFT PHOENIX models provide a better fit of the overall spectral shape. In particular, the red side of the band, which is poorly fit by the low-gravity DUSTY models owing to uncertainties in the model opacities used, is well fit the by the DRIFT PHOENIX models. For the latter models, the steepness of the slope on either side of the band even provides some constraint on the effective temperature, favoring 1700–1800 K. Although less apparent from the figure, the band is also better reproduced by the DRIFT PHOENIX models, the DUSTY models spectra falling off slightly too rapidly at the blue side. The shape of the band spectrum, according to the DRIFT PHOENIX models, also favors a temperature of 1800 K.
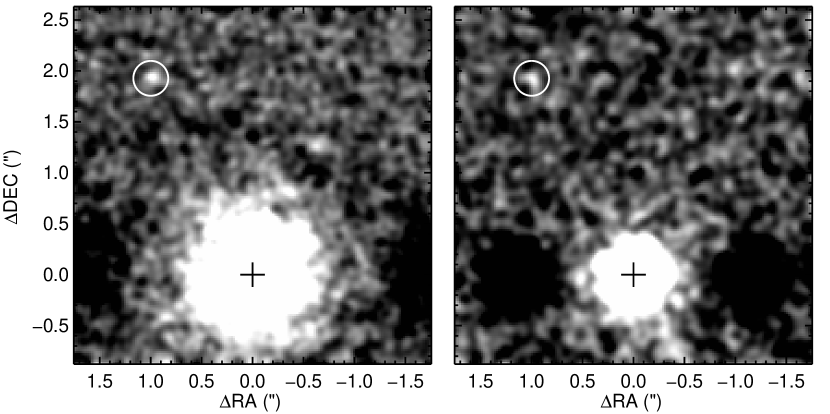
The companion was detected in both the NB3.05 and images at the level of 5 and 3, respectively; see Fig. 5. The flux of the companion and primary were determined from photometry in an aperture of diameter 6 pixels. The uncertainty on the companion flux was estimated from the dispersion of the noise in 21 such apertures spread azimuthally around a circle of radius 2.2″ centered on the primary star. We obtained a contrast of mag in NB3.05 and mag in .
Unfortunately, we cannot derive the companion’s flux in a straightforward manner as we did not observe photometric standard stars to calibrate the photometry, and no measurements of the primary flux in the same filters exist in the literature. However there exist calibrated flux measurements of the primary in several infrared bands that closely bracket the wavelength range of our observations: 2MASS , and (Cutri, 2003), Spitzer IRAC 4.5 m and 8.0 m, and Spitzer IRS peak-up imaging at 16 m (Carpenter et al., 2006). We used these measurements, together with model spectra, to estimate the flux of the primary in the NB3.05 and filters. More specifically, we used synthetic spectra from the NextGen models (Hauschildt et al., 1999) to compute synthetic fluxes in all the bands listed above, we then adjusted those synthetic fluxes to the measured values, and finally computed the synthetic average fluxes of the primary star in the NB3.05 and bands. For the 2MASS bands, the synthetic average flux densities were computed using the relative spectral response curves given on the 2MASS project webpage444http://www.ipac.caltech.edu/2mass/releases/allsky/doc/sec6_4a.html and the flux zero points determined by Rieke et al. (2008); for the Spitzer IRAC and IRS bands, the spectral response curves and zero points were taken from the respective instruments webpages555see http://ssc.spitzer.caltech.edu/irac/calibrationfiles
and http://ssc.spitzer.caltech.edu/irs/calibrationfiles/. Various synthetic spectra were adjusted to the photometric measurements by minimizing the reduced . The spectrum yielding the best fit, K and was used in combination with the spectral response curves of the NIRI NB3.05 and filters, taken from the NIRI website666http://www.gemini.edu/sciops/instruments/niri/, to compute the primary star flux density in those two bands. We obtained values of W m-2 m-1 for NB3.05 and W m-2 m-1 for . Then using the observed contrast for the companion we obtained fluxes of W m-2 m-1 for NB3.05 and W m-2 m-1 for .
To verify the accuracy of the above procedure in estimating the primary star flux, we repeated it by ignoring one band ( or IRAC 4.5 m) when adjusting the synthetic fluxes to the observations and then retrieving the synthetic flux in that band from the adjusted spectrum. For both and IRAC 4.5 m, the flux retrieved was within 3% from the measured value. Thus the error on the primary star flux resulting from this procedure is a small contribution to the error on the companion flux.
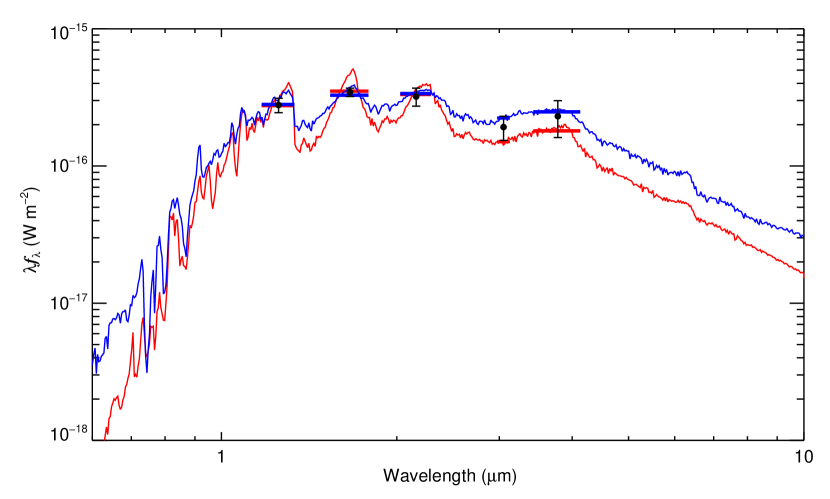
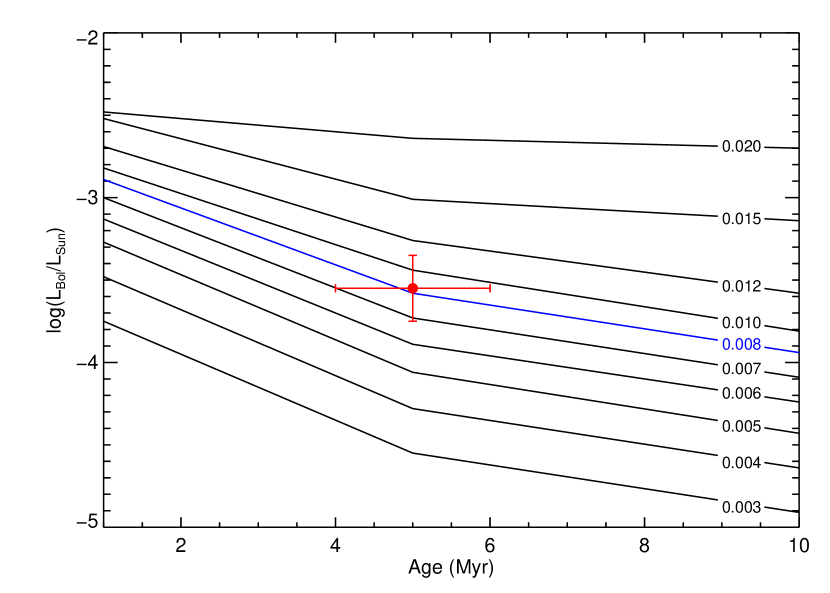
In Lafrenière et al. (2008) we derived a mass estimate for the companion primarily from our estimate of its effective temperature, and commented that the value found was consistent with the observed brightness. Here we adopt a different approach based on the bolometric luminosity of the companion inferred from a fit of model spectra to all photometric measurements available. The synthetic spectra were adjusted to the photometry in the same way as done above for the primary. After adjustment to the data points, the model spectra were integrated over all wavelengths to obtain the total irradiance, which was then converted to bolometric luminosity using the primary star distance estimate of pc. We repeated this procedure using both the DUSTY and DRIFT PHOENIX model spectra for a range of from 1600 K to 2000 K and from 3.5 to 6.0. For both sets of models, the spectra yielding the best agreement with the data points have 1700–1800 K and 3.5–4.5; representative spectra are shown in Fig. 6. Despite significant differences in the model spectra over the range explored, the range of bolometric luminosities obtained ( dex) is rather small, as noted by Marois et al. (2008) who used the same procedure for the HR 8799 planets. Then accounting for the uncertainty in distance, we obtain a bolometric luminosity of . Compared to the prediction of the DUSTY evolution models (see Fig. 7), this luminosity indicates a mass of , in perfect agreement with the value reported in Lafrenière et al. (2008). For this mass, the dusty evolution models predict a of 1800 K, fully consistent with the best spectral fit. Thus, notwithstanding uncertainties in evolution models, the mass of 1RXS J1609-2105 b is in the planetary regime.
We also used the same procedure, with NextGen model spectra of 3800-4000 K (K7-M0) and 3.5-4.5, to estimate the bolometric luminosity of the primary star. We obtained a value of , in good agreement with the prediction (-0.36) of the evolution models of Baraffe et al. (1998) with for an age of 5 Myr and of 4000 K. The ratio of the companion bolometric luminosity to that of the companion, which is independent of our distance uncertainty, is thus .
3.3. Search for other companions
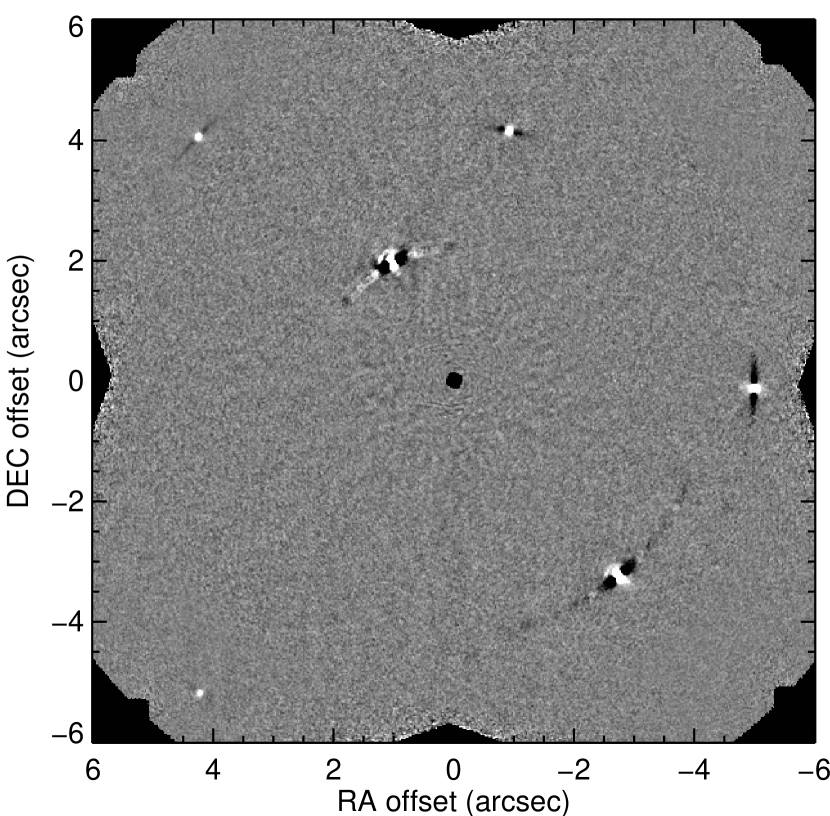
The residual ADI image is shown in Fig. 8. In addition to the companion, this image shows 5 other point sources that are clearly detected. These sources are all further away from the primary and fainter than the companion. All of these five sources were detected at least twice in our multiple epoch normal imaging and the astrometric measurements were sufficient to determine that they are background stars. For reference, the position and contrast of these sources are given in Table 2. Visual inspection of the image did not reveal any other new, fainter point source.
| (″)aaAt epoch 2009.2621. | P.A. (deg)aaAt epoch 2009.2621. | (mag) |
|---|---|---|
Detection limits in difference of magnitude as a function angular separation were computed from the standard deviation of the pixel values in an annulus of width equal to one PSF FWHM; the photometry was properly calibrated using the procedure described in §3.3 of Lafrenière et al. (2007a). The result is shown in Fig. 9. The evolution models of Baraffe et al. (2003), Chabrier et al. (2000) and Baraffe et al. (1998) were used to translate these detection limits into planetary masses, assuming an age of 5 Myr. Our results allow us to rule out the presence of planets more massive than 1 , 2 and 8 at projected separations larger than 3″ (440 AU), 0.7″ (100 AU) and 0.35″ (50 AU), respectively. These limits indicate that if the planetary companion migrated outward (or was ejected) to its current location through planet-planet scattering, then the perturbing body, likely more massive, would have to be located within 50 AU.

4. Concluding remarks
The planetary mass companion 1RXS J1609-2105 b is the least massive known to date with an orbital separation of a few hundreds of AU. As discussed in Paper I, the existence of such a low mass companion orbiting so far away from its star poses a great challenge for star and planet formation models. Indeed, all main modes of formation –core accretion, gravitational instability or binary-like formation– and migration –disk interaction or planet-planet interaction– face some obstacles when trying to account for such a companion. A lot of work has been done over the past two years in an attempt to explain the handful of companions at moderate-to-large separations recently found by direct imaging, the general outcome being that, although it remains challenging, given the right initial conditions, the above mechanisms can indeed succeed in producing distant gas giants. For example, gravitational scattering between multiple planets is a viable explanation for the planet we have found at 330 AU (e.g. Scharf & Menou, 2009; Veras et al., 2009), but of course this would require that several massive planets have successfully formed at smaller orbital separations (30–100 AU). If this is the case, then 1RXS J1609-2105 b should have a highly eccentric orbit and would likely eventually be ejected from the system. Alternatively, some authors have found that gravitational instability may also be a viable explanation, provided that the disk of this system was sufficiently massive, extended and had a relatively low opacity (e.g. Meru & Bate, 2010; Boley et al., 2010); although admittedly, the regime where gravitational instability is effective remains a matter of debate (e.g. Kratter et al., 2010; Stamatellos & Whitworth, 2008; Rafikov, 2007; Boss, 2006).
More follow-up observations of this system over the coming years should help establish which, if any, of these mechanisms can best explain the origin of this planet. In particular, multi-epoch high-resolution spectroscopy of the primary and additional high-contrast imaging with improved sensitivity below 0.35″ would allow to search for even closer-in companions; this would guide migration and ejection scenarios involving dynamical interaction between multiple planets. Also, higher S/N and/or higher resolution spectroscopy of the companion would allow to constrain the differential radial velocity of the primary and companion. This would constrain the orbital velocity of the companion –and its true physical bound– or its possible recent ejection. These data could also be used to constrain the metallicity of the planet, which could provide some clues to its formation mechanism. Better spectroscopy would also enable a much more detailed comparison with model spectra. Along the same line, photometry over an extended spectral range would be useful to verify model spectra. A parallax measurement for the primary star would remove a big part of the uncertainty on the companion luminosity, which would then lead to a better mass estimate and/or a more constraining verification of evolution models. Finally, continued astrometry monitoring should begin to constrain the orbital motion of the companion within a few years, given the expected differential motion of 2.2 mas yr-1.
References
- Allard et al. (2001) Allard, F., Hauschildt, P. H., Alexander, D. R., Tamanai, A., & Schweitzer, A. 2001, ApJ, 556, 357
- Baraffe et al. (1998) Baraffe, I., Chabrier, G., Allard, F., & Hauschildt, P. H. 1998, A&A, 337, 403
- Baraffe et al. (2003) Baraffe, I., Chabrier, G., Barman, T. S., Allard, F., & Hauschildt, P. H. 2003, A&A, 402, 701
- Bate et al. (2003) Bate, M. R., Bonnell, I. A., & Bromm, V. 2003, MNRAS, 339, 577
- Béjar et al. (2008) Béjar, V. J. S. et al. 2008, ApJ, 673, L185
- Boley et al. (2010) Boley, A. C., Hayfield, T., Mayer, L., & Durisen, R. H. 2010, Icarus, 207, 509
- Boss (1997) Boss, A. P. 1997, Science, 276, 1836
- Boss (2006) Boss, A. P. 2006, ApJ, 637, L137
- Bouy & Martín (2009) Bouy, H., & Martín, E. L. 2009, A&A, 504, 981
- Carpenter et al. (2006) Carpenter, J. M., Mamajek, E. E., Hillenbrand, L. A., & Meyer, M. R. 2006, ApJ, 651, L49
- Chabrier et al. (2000) Chabrier, G., Baraffe, I., Allard, F., & Hauschildt, P. 2000, ApJ, 542, 464
- Chauvin et al. (2005a) Chauvin, G., Lagrange, A., Dumas, C., Zuckerman, B., Mouillet, D., Song, I., Beuzit, J., & Lowrance, P. 2005a, A&A, 438, L25
- Chauvin et al. (2005b) Chauvin, G., Lagrange, A., Zuckerman, B., Dumas, C., Mouillet, D., Song, I., Beuzit, J., Lowrance, P., & Bessell, M. S. 2005b, A&A, 438, L29
- Cushing et al. (2005) Cushing, M. C., Rayner, J. T., & Vacca, W. D. 2005, ApJ, 623, 1115
- Cutri (2003) Cutri, R. M. e. a. 2003, 2MASS All Sky Catalog of point sources.
- Greaves et al. (1998) Greaves, J. S. et al. 1998, ApJ, 506, L133
- Hauschildt et al. (1999) Hauschildt, P. H., Allard, F., & Baron, E. 1999, ApJ, 512, 377
- Helling et al. (2008) Helling, C., Dehn, M., Woitke, P., & Hauschildt, P. H. 2008, ApJ, 675, L105
- Herriot et al. (2000) Herriot, G. et al. 2000, in Proc. SPIE, Vol. 4007, Adaptive Optical Systems Technology, ed. P. L. Wizinowich, 115–125
- Hodapp et al. (2003) Hodapp, K. W. et al. 2003, PASP, 115, 1388
- Holland et al. (1998) Holland, W. S. et al. 1998, Nature, 392, 788
- Itoh et al. (2005) Itoh, Y. et al. 2005, ApJ, 620, 984
- Kalas et al. (2008) Kalas, P., Graham, J. R., Chiang, E., Fitzgerald, M. P., Clampin, M., Kite, E. S., Stapelfeldt, K., Marois, C., & Krist, J. 2008, Science, 322, 1345
- Kalas et al. (2005) Kalas, P., Graham, J. R., & Clampin, M. 2005, Nature, 435, 1067
- Kratter et al. (2010) Kratter, K. M., Murray-Clay, R. A., & Youdin, A. N. 2010, ApJ, 710, 1375
- Lafrenière et al. (2007a) Lafrenière, D. et al. 2007a, ApJ, 670, 1367
- Lafrenière et al. (2008) Lafrenière, D., Jayawardhana, R., & van Kerkwijk, M. H. 2008, ApJ, 689, L153
- Lafrenière et al. (2009) Lafrenière, D., Marois, C., Doyon, R., & Barman, T. 2009, ApJ, 694, L148
- Lafrenière et al. (2007b) Lafrenière, D., Marois, C., Doyon, R., Nadeau, D., & Artigau, É. 2007b, ApJ, 660, 770
- Lagrange et al. (2009) Lagrange, A. et al. 2009, A&A, 493, L21
- Lodieu et al. (2008) Lodieu, N., Hambly, N. C., Jameson, R. F., & Hodgkin, S. T. 2008, MNRAS, 383, 1385
- Lowrance et al. (1999) Lowrance, P. J. et al. 1999, ApJ, 512, L69
- Luhman et al. (2007) Luhman, K. L. et al. 2007, ApJ, 654, 570
- Luhman et al. (2006) Luhman, K. L. et al. 2006, ApJ, 649, 894
- Marois et al. (2006) Marois, C., Lafrenière, D., Doyon, R., Macintosh, B., & Nadeau, D. 2006, ApJ, 641, 556
- Marois et al. (2008) Marois, C., Macintosh, B., Barman, T., Zuckerman, B., Song, I., Patience, J., Lafrenière, D., & Doyon, R. 2008, Science, 322, 1348
- McGregor et al. (2003) McGregor, P. J. et al. 2003, in Society of Photo-Optical Instrumentation Engineers (SPIE) Conference Series, Vol. 4841, ed. M. Iye & A. F. M. Moorwood, 1581–1591
- Meru & Bate (2010) Meru, F., & Bate, M. R. 2010, MNRAS, 858
- Neuhäuser et al. (2005) Neuhäuser, R., Guenther, E. W., Wuchterl, G., Mugrauer, M., Bedalov, A., & Hauschildt, P. H. 2005, A&A, 435, L13
- Oppenheimer et al. (2008) Oppenheimer, B. R. et al. 2008, ApJ, 679, 1574
- Padoan & Nordlund (2002) Padoan, P., & Nordlund, Å. 2002, ApJ, 576, 870
- Pollack et al. (1996) Pollack, J. B., Hubickyj, O., Bodenheimer, P., Lissauer, J. J., Podolak, M., & Greenzweig, Y. 1996, Icarus, 124, 62
- Preibisch et al. (2002) Preibisch, T., Brown, A. G. A., Bridges, T., Guenther, E., & Zinnecker, H. 2002, AJ, 124, 404
- Rafikov (2007) Rafikov, R. R. 2007, ApJ, 662, 642
- Reid & Walkowicz (2006) Reid, I. N., & Walkowicz, L. M. 2006, PASP, 118, 671
- Rieke et al. (2008) Rieke, G. H. et al. 2008, AJ, 135, 2245
- Scharf & Menou (2009) Scharf, C., & Menou, K. 2009, ApJ, 693, L113
- Schmidt et al. (2008) Schmidt, T. O. B., Neuhäuser, R., Seifahrt, A., Vogt, N., Bedalov, A., Helling, C., Witte, S., & Hauschildt, P. H. 2008, A&A, 491, 311
- Schneider et al. (1999) Schneider, G. et al. 1999, ApJ, 513, L127
- Stamatellos & Whitworth (2008) Stamatellos, D., & Whitworth, A. P. 2008, A&A, 480, 879
- Thalmann et al. (2009) Thalmann, C. et al. 2009, ApJ, 707, L123
- Todorov et al. (2010) Todorov, K., Luhman, K. L., & McLeod, K. K. 2010, ApJ, 714, L84
- Veras et al. (2009) Veras, D., Crepp, J. R., & Ford, E. B. 2009, ApJ, 696, 1600
- Weinberger et al. (1999) Weinberger, A. J. et al. 1999, ApJ, 525, L53
- Witte et al. (2009) Witte, S., Helling, C., & Hauschildt, P. H. 2009, A&A, 506, 1367
- Wyatt (2008) Wyatt, M. C. 2008, ARA&A, 46, 339
- Wyatt et al. (2005) Wyatt, M. C., Greaves, J. S., Dent, W. R. F., & Coulson, I. M. 2005, ApJ, 620, 492
- Zacharias et al. (2009) Zacharias, N. et al. 2009, VizieR Online Data Catalog, 1315, 0
- Zuckerman & Song (2009) Zuckerman, B., & Song, I. 2009, A&A, 493, 1149