Probing the mechanical properties of graphene using a corrugated elastic substrate
The exceptional mechanical properties of graphene have made it attractive for nano-mechanical devices and functional composite materials Geimstatus . Two key aspects of graphene’s mechanical behavior are its elastic and adhesive properties. These are generally determined in separate experiments, and it is moreover typically difficult to extract parameters for adhesion. In addition, the mechanical interplay between graphene and other elastic materials has not been well studied. Here, we demonstrate a technique for studying both the elastic and adhesive properties of few-layer graphene (FLG) by placing it on deformable, micro-corrugated substrates. By measuring deformations of the composite graphene-substrate structures, and developing a related linear elasticity theory, we are able to extract information about graphene’s bending rigidity, adhesion, critical stress for interlayer sliding, and sample-dependent tension. The results are relevant to graphene-based mechanical and electronic devices, and to the use of graphene in composite Geimstatus , flexible Rogers , and strain-engineered Guinea materials.
The elastic properties of graphene have previously been measured using nano-indentation Hone and pressurization McEuen techniques, and Young’s modulus was found to be exceptionally high, . Graphene’s van der Waals adhesion to surfaces has been examined theoretically Dunn , and local adhesion to nanoparticles has been studied Zong . Substrate interactions, due to surface adhesion, highly modify graphene’s doping Andrei ; Bolotin and carrier mobility. In addition, adhesion to sidewalls in suspended graphene introduces strain and modifies mechanical behavior Bunch ; Metzger . Here, we explore both elasticity and adhesion, which are evident in the interaction between micro-scale-corrugated elastic substrates and graphene samples of thickness ranging from 1 to 17 atomic layers. By using an atomic force microscope (AFM) to determine surface adhesion and deformations, we find that the FLG can fully adhere to the patterned substrate, and that thicker samples flatten the corrugated substrate more than thinner samples do. By developing a linear elasticity theory to model the flattening and adhesion as a function of layer thickness, we are able to extract estimates of, or bounds on, various fundamental and sample-dependent properties of the system.
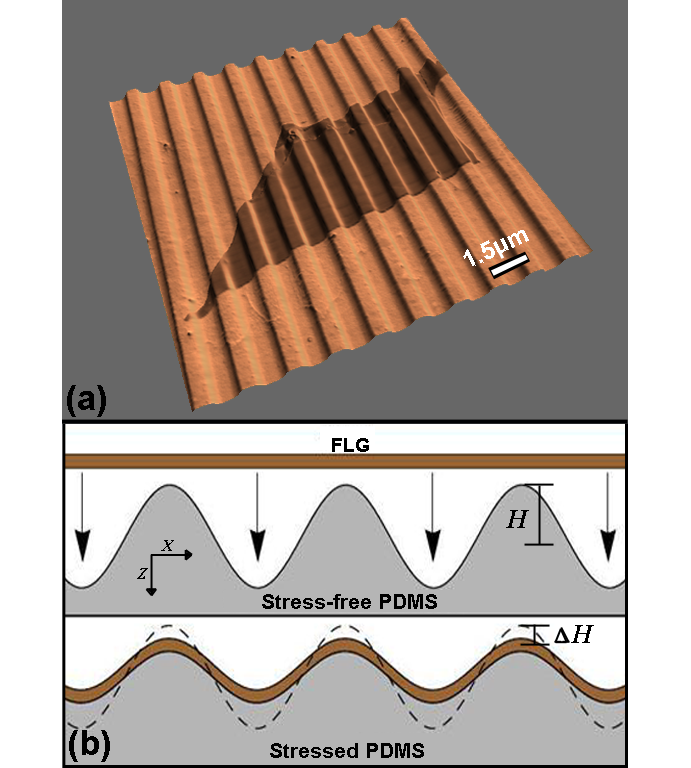
Sample substrates were prepared by casting a 3 mm thick layer of polydimethylsiloxane (PDMS)—which cures into a flexible, rubbery material—onto the exposed surface of a writable compact disc. This resulted in approximately sinusoidal corrugations on the PDMS, having a wavelength of and a depth of (see Fig. 1a). Graphene was then deposited onto the PDMS via mechanical exfoliation Scotch . Candidate samples were first located using optical microscopy, then imaged on an Asylum Research MFP-3D AFM. Figure 1a shows a topographic image of FLG on the PDMS; it is evident from the image that the graphene conforms to the corrugations, as illustrated in Fig. 1b.
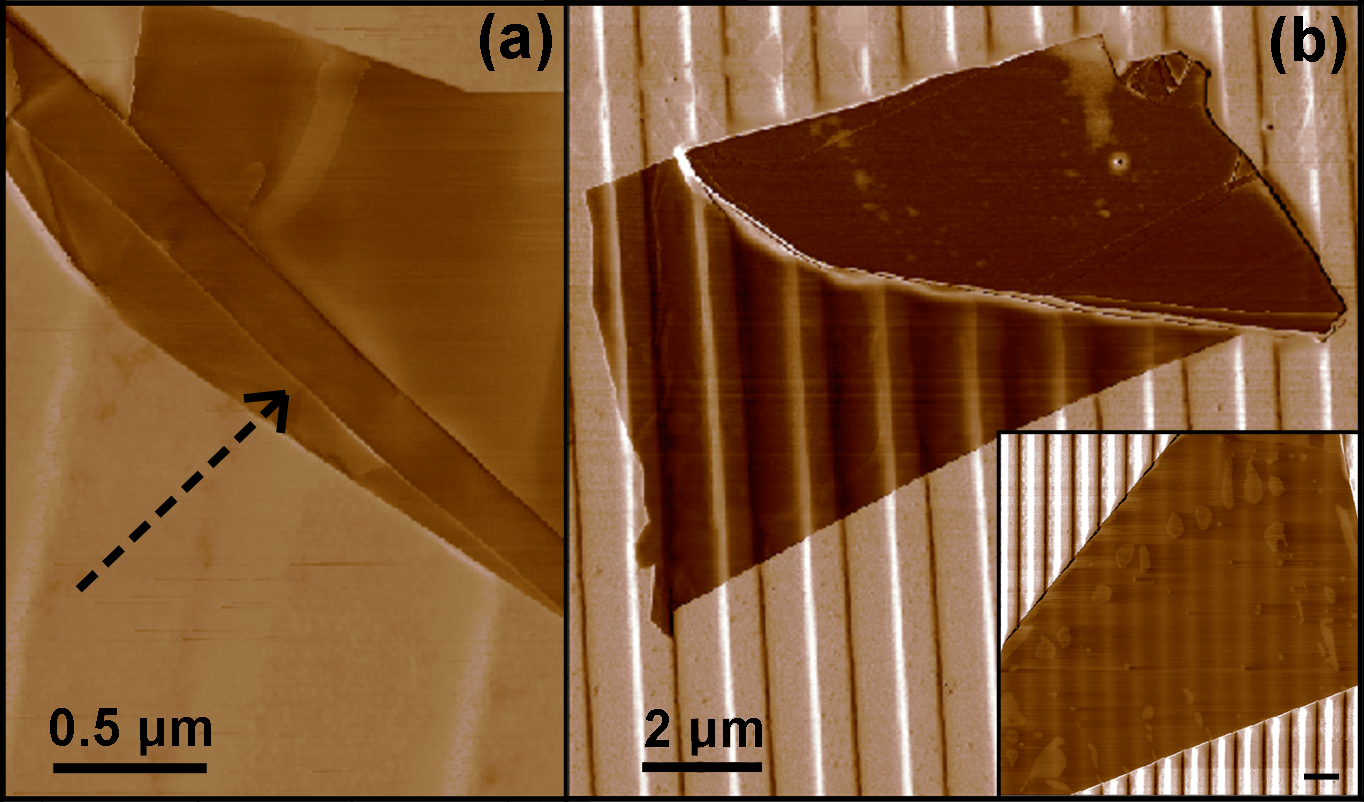
In order to fit the experimental data to a theoretical model, it was necessary to determine (1) the thickness of the FLG, (2) the adhesion between the FLG and the PDMS, and (3) the height profile of the PDMS-FLG system. The soft, non-standard substrate created difficulty in measuring FLG thickness via established AFM and Raman techniques. Thus, the thickness was determined by using the AFM (in contact mode) to fold the flake onto itself, and then using the AFM again to measure the resultant FLG-FLG step height. An example of AFM-folded FLG is shown in Fig. 2a. The same flake could be folded at multiple locations to increase accuracy (typical accuracy was 1-2 layers), although, because the method was destructive, it had to be undertaken once all other measurements were completed.
The degree of adhesion between the FLG and PDMS was obtained by measuring the phase of the oscillation of the AFM cantilever. This phase is determined by the electrostatic properties of the surface; in other words, sections having the same adhesion have common electrostatic properties and thus a common phase. The main image of Fig. 2b shows a two-dimensional phase map for 2-layer FLG, in which the phase is uniform across the sample (except where adhesion is lost at the steepest slopes of the corrugation). These data demonstrate the near-conformal adhesion between the FLG and the PDMS, and are consistent with previous work on graphene placed over more shallow depressions Metzger . The AFM height data similarly indicate that the FLG adheres to the corrugations of the PDMS (e.g., see Fig. 3). In contrast, the inset to Fig. 2b shows the phase data for 13-layer FLG, where bubble-like structure appears across the sample, showing that the phase is not uniform and, hence, that the FLG does not adhere well to the PDMS. In general, we found that samples having fewer than layers showed full adhesion, whereas thicker samples did not fully adhere. The adhesive properties did not seem to depend on the size or aspect ratio of the graphene samples, only their thickness.
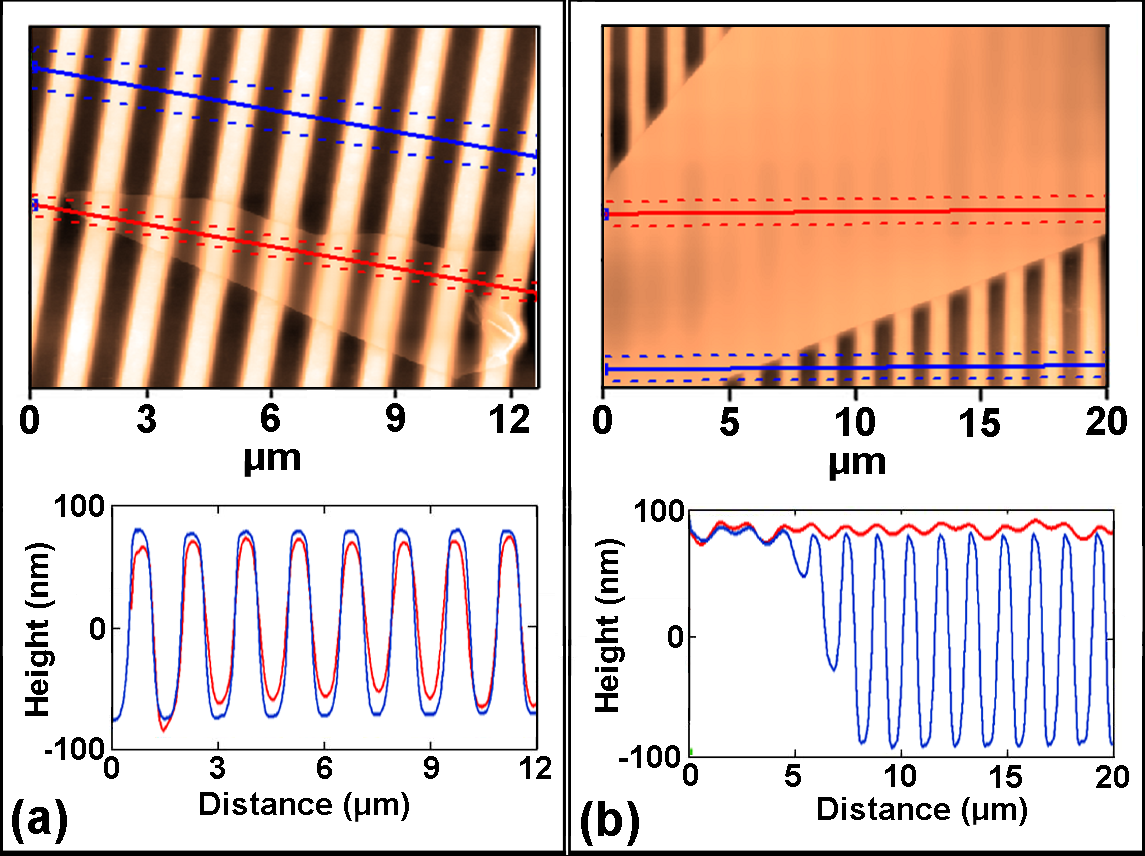
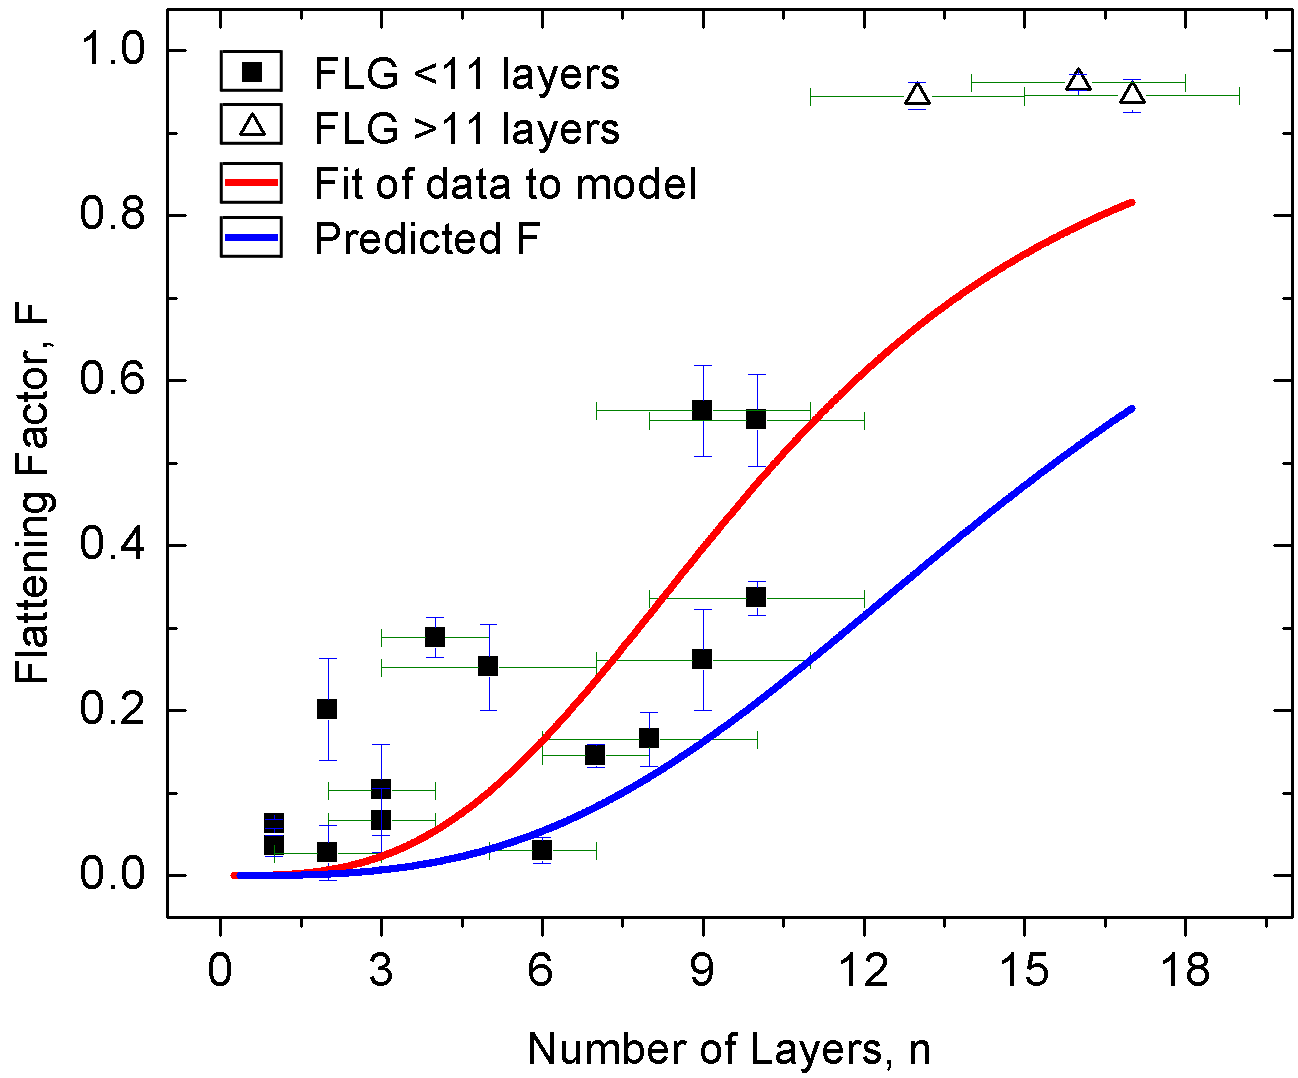
The most remarkable aspect of the FLG-PDMS system is that interplay between the rigidity of the graphene and the shear modulus of the PDMS causes the FLG to become corrugated and the PDMS to be flattened. Figures 3a and b show image and height measurements for 8- and 13-layer FLG on PDMS, respectively. In Fig. 3a it is clear that the FLG maintains the basic shape of the PDMS corrugations, but pulls the corrugations up in the valleys and pushes them down on the plateaus. In contrast, Fig. 3b shows that 13-layer FLG sits on top of the PDMS; while the FLG likely strongly deforms the PDMS, the amount of flattening is difficult to determine because of the lack of adhesion. Figure 4 shows the fractional height difference between the FLG-PDMS composite and the bare PDMS, plotted against graphene thickness, for 18 samples (measured on 9 different PDMS substrates); it is clear that the amount of flattening increases with layer number.
We now develop a linear elasticity theory that models the effect of stress at the interface between the relatively flat FLG (ignoring the nanometer-scale intrinsic ripples) and the corrugated PDMS. To start, we consider an undeformed PDMS substrate having a corrugated surface: (see Fig. 1b for coordinates). Height profiles that are not simple sine waves can be handled via the superposition of suitable terms. Graphene adheres to and flattens this surface, reducing the corrugation amplitude to (as discussed below). The normal stress required to deform the graphene in this way follows from thin plate theory landau , and is related to the deformed height profile via
| (1) |
where is the flexural, or bending, rigidity of the FLG, so that . An equal and opposite stress acts on the PDMS substrate, so we next determine how the PDMS responds to this stress.
We regard the PDMS as being a semi-infinite, isotropic, incompressible medium, and describe distortions of it by means of a displacement field . (We only consider configurations that are translationally invariant in the -direction, and hence are effectively two-dimensional.) At the linear level, to which we are working, incompressibility implies divergence-free displacements: . The displacement obeys the condition of mechanical equilibrium, i.e.,
| (2) |
in which is the pressure field, introduced to implement incompressibility, which requires that . In determining , the appropriate boundary condition involves specifying the normal component of the stress, which amounts to the condition (summing over repeated indices)
| (3) |
in which is the external force acting on the PDMS at its surface and is the unit normal vector pointing outward from the PDMS surface. The force exerted by the graphene on the PDMS can be taken to have a simple, sinusoidal form: . It is then straightforward to show that the PDMS responds by undergoing the position-dependent displacement
| (4) |
In particular, the surface of the PDMS is displaced according to , which creates a surface profile . The amplitude is diminished from by an amount
| (5) |
Rearranging gives the flattening factor
| (6) |
A model of the FLG as a uniform elastic continuum suggests that , where is the number of graphene layers and is the bending rigidity of a single graphene layer. We assume the thickness of -layer graphene to be times the thickness of single-layer graphene. Thus, we arrive at the result that should increase with increasing .
We now compare the model to the data, to elucidate the FLG’s mechanical behavior. Figure 4 shows measured values of vs. , along with a least squares fit to equation (6) (red curve). From the fit we extract a dimensionless graphene rigidity parameter . The shear modulus of PDMS was measured separately via nanoindentation and an ultrasonic probe, which gave and , respectively (the difference is possibly due to probing surface vs. bulk moduli). Using , as well as , the bending rigidity of graphene is then obtained as . This value is higher than that predicted using Kirchhoff plate theory, from which , using the graphene Young’s modulus kelly , Poisson ratio , and single-layer thickness kelly . The predicted values for are plotted as the blue curve in Fig. 3.
The spread in the data is greater than can be accounted for by measurement uncertainty. This leads us to hypothesize that the discrepancy between extracted and predicted values of (or ) is caused by tension in the graphene, resulting from sample-dependent friction between the PDMS and the graphene. A tension could modify the flattening factor in equation (6), giving
| (7) |
If we assume that the difference between the predicted values of (blue curve) and the data in Fig. 4 is due to tension, we can use equation (7) to extract a value of tension for each sample. This yields tension values between and , with no discernible trend with thickness. The tension is positive for each sample, to within the margin of error, consistent with the picture that friction opposes the contraction of FLG as it conforms to the corrugated PDMS.
The maximum tension corresponds to a maximum axial strain of . We can also use the tension to estimate the magnitude of the stress due friction: assuming the friction acts over a distance , we find a stress of less than . The condition that tension be positive, taken together with our data, implies that graphene’s bending rigidity is no greater than , consistent with predicted values. If, as seems reasonable, the tension is negligibly small for at least one sample, then this bound would become an estimate of the graphene rigidity.
The data shown in Fig. 4 can also be used to estimate the normal interface stress , which ranges from . The data also show that no samples which adhere to the surface have , implying that the adhesive strength between the graphene and the PDMS is . Note that this stress is model-independent.
We can extract bounds on the graphene-PDMS adhesion energy by considering that the energy of the adhesion must be at least as large as the spatially-averaged elastic deformation energy. This energy can be regarded as a sum of contributions: the elastic deformation of the substrate ; the FLG deformation under tension ; and the FLG bending landau . Ignoring the negligible tension contribution, these sum to . The maximum elastic energy (which is also the lower bound of the adhesive energy) in our samples is thus . This is consistent with the theoretical prediction of for the van der Waals adhesive energy between graphene and a substrate Sabio . Absent any other significant contributions to the energy budget (such as work done against friction), so adhesion energy must equal the elastic energy and becomes an estimate of the adhesive energy.
Because interlayer forces within FLG are weak, it is also important to consider shear forces, which could cause the graphene layers to slide relative to one another. In this case, the impact on the flattening factor is to replace the bending rigidity of a cohesive sample by the sum of the bending rigidities of the individual slabs. We find that such a model does not improve the fits to the data, and thus find no evidence that the graphene layers slide. The physical effect of sliding would be to decrease the flattening factor, and thus sliding cannot explain the discrepancy between the theoretical values and data of Fig. 4. We hypothesize that there does, however, exist some critical shear stress beyond which layers slide relative to one another. Considering the finite thickness of the FLG, Mindlin plate theory Mindlin shows that the boundary stress needed to deform the FLG generates a central shear strain of
| (8) |
The absence of evidence for sliding in samples of layers thus suggests a lower bound on the critical shear strain of . Multiplying by the graphene shear modulus, which we take to be half its Young’s modulus, this implies a critical shear stress between the layers of .
To conclude, we have developed a method of measuring the mechanical properties of graphene using deformable, micro-corrugated substrates. We are able to put bounds on—or extract estimates for—fundamental properties such as graphene’s bending rigidity, critical shear stress, and the FLG-PDMS adhesive strength and energy. We also extracted sample-dependent properties such as the tension and normal interface stress. The experimental and theoretical techniques developed in this paper may be readily extended to various substrates having a range of surface geometries.
Acknowledgments. We thank Scott Maclaren (UIUC CMM) and Richard Nay (Hysitron) for technical assistance. This work was supported by DOE DE-FG02-07ER46453, NSF DMR06-44674, NSF DMR09-06780, and an NDSEG Fellowship (DZR).
References
- (1) See, e.g., Geim, A. K. Graphene: status and prospects. Science 324, 5934 (2009).
- (2) Rogers, J. A., Someya, T. & Huang, Y. Materials and mechanics for stretchable electronics. Science 327, 1603 (2010).
- (3) Guinea, F., Katsnelson, M. I. & Geim, A. K. Energy gaps and a zero-field quantum Hall effect in graphene by strain engineering. Nature Physics 6, 30 (2010).
- (4) Lee, C., Wei, X., Kysar, J. W. & Hone, J. Measurement of the elastic properties and intrinsic strength of monolayer graphene. Science 321, 385 (2008).
- (5) J. S. Bunch et al. Impermeable atomic membranes from graphene sheets. Nano Lett. 321, 385 (2008).
- (6) Lu, Z., Dunn & M. L. van der Waals adhesion of graphene membranes. Jour. App. Phys. 8, 2458 (2008).
- (7) Zong, Z., Chen, C., Dokmeci, M. R. & Wan, K. Direct measurement of graphene adhesion on silicon surface by intercalation of nanoparticles. Jour. App. Phys. 107, 026104 (2010).
- (8) Du, X., Skachko, I., Barker, A. & Andrei, E. Y. Approaching ballistic transport in suspended graphene. Nature Nanotech. 3, 491 (2008).
- (9) Bolotin, K. I., Sikes, K. J., Hone, J., Stormer, H. L. & Kim, P. Temperature-dependent transport in suspended graphene. Phys. Rev. Lett. 101, 096802 (2008).
- (10) Bunch, J. S. et al. Electromechanical resonators from graphene sheets. Science 315, 490 (2007).
- (11) Metzger, C. et al. Biaxial strain in graphene adhered to shallow depressions. Nano Lett. 10, 6 (2010).
- (12) Novoselov, K. S. et al. Electric field effect in atomically thin carbon films. Science 306, 666 (2004).
- (13) See, e.g., Landau, L. D. & Lifshitz, E. M., Theory of Elasticity (Course of Theoretical Physics, Vol. 7) (Pergamon, Oxford, 1986), Sec. 11,12.
- (14) Kelly, B. T., Physics of Graphite (London: Applied Science, 1981).
- (15) Sabio, J., et al. Electrostatic interactions between graphene layers and their environment. Phys. Rev. B 77, 195409 (2008).
- (16) Mindlin, R. D. Influence of rotatory inertia and shear on flexural motions of isotropic, elastic plates. Jour. Appl. Mech. 18, 31 (1951).