High-Angular Resolution Dust Polarization Measurements: Shaped B-field Lines in the Massive Star Forming Region Orion BN/KL
Abstract
We present observational results of the thermal dust continuum emission and its linear polarization in one of the nearest massive star-forming sites Orion BN/KL in Orion Molecular Cloud-1. The observations were carried out with the Submillimeter Array. With an angular resolution of 1 (2 mpc; 480 AU), we have detected and resolved the densest cores near the BN/KL region. At a wavelength of 870 m, the polarized dust emission can be used to trace the structure of the magnetic field in this star-forming core. The dust continuum appears to arise from a -shaped region, with a cavity nearly coincident with the center of the explosive outflows observed on larger scales. The position angles (P.A.s) of the observed polarization vary significantly by a total of about 90 but smoothly, i.e., curl-like, across the dust ridges. Such a polarization pattern can be explained with dust grains being magnetically aligned instead of mechanically with outflows, since the latter mechanism would cause the P.A.s to be parallel to the direction of the outflow, i.e., radial-like. The magnetic field projected in the plane of sky is therefore derived by rotating the P.A.s of the polarization by 90. We find an azimuthally symmetric structure in the overall magnetic field morphology, with the field directions pointing toward 25 west to the center of the explosive outflows. We also find a preferred symmetry plane at a P.A. of 36, which is perpendicular to the mean magnetic field direction (120) of the 0.5 pc dust ridge. Two possible interpretations of the origin of the observed magnetic field structure are discussed.
1 Introduction
Massive star-forming sites are typically further away than low mass cases are. Moreover, massive stars are formed in groups and are almost always in a more complex environment (Lada & Lada 2003). Therefore, observations with higher spatial resolution are vital in order to study the massive star formation process. As one of the closest massive star-forming sites, with a size scale 0.07 pc the KleinmannLow (KL; Kleinmann & Low 1967) nebula in the Orion molecular cloud is the best candidate for study. In this paper, we adopt a distance of 480 pc to the KL nebula (Genzel et al. 1981). Within the KL nebula region, there are many young stars. The BecklinNeugebauer (BN) object is the brightest near-infrared source (Scoville et al. 1983). The source IRc2 is strong in mid-IR emission and has been resolved into several isolated peaks (Shuping, Morris & Bally 2004), suggesting that it is a cluster-forming region. Using high angular resolution (up to 07) sub-millimeter (sub-mm) observations, Beuther et al. (2004; 2006) further identified the sub-mm counterpart of the radio source I and a new sub-mm source SMA 1. The reported gas mass of source I as estimated from the sub-mm continuum is 0.2 M☉, while the mass of SMA 1 could not be inferred from their data because of line contamination; almost no line-free channels were found (Beuther et al. 2004).
Some of the stars are young enough that accretion and outflows can be detected. Reid et al. (2007) reported the existence of an ionized accretion disk surrounding source I with a radius of 35 AU at a position angle (P.A., positive from the north to the east) of 40. Plambeck et al. (2009) detected a bipolar molecular outflow along a NESW axis as traced by the SiO =0 =2-1 line which originates from source I. The orientations of this accretion disk and the outflow are consistent with the observations of the proper motion of the SiO masers (Chandler 2005; Goddi et al. 2009). In contrast, the high velocity outflow detected in CO (Zapata et al. 2009; Chernin & Wright 1996) and in H2 (Kaifu et al. 2000; Nissen et al. 2007) are in the NWSE direction and are extended over much larger scales of 0.10.2 pc. These outflows at different size scales are most likely driven by different sources and ejected at different times.
The stellar motions suggest a different kind of outflow. Based on the proper motions of BN, source I, and source n, which are on the order of 10 mas yr-1 , Gomez et al. (2005) have proposed that they are run-away stars from a common center, somewhere between BN and source I about 500 yr ago. Hereafter, we will refer to this common center as the BN-I center. The adopted coordinate of the BN-I center is: R.A.(J2000) = 05h35m14s.35, decl(J2000) =5°22′277. Recent observations of the large-scale CO outflow by Zapata et al. (2009) suggest that it is linked to the proper motions of BN, and the sources I and n. Associated with BN/KL is a hot molecular cloud core with a size of 0.01 pc (Beuther et al. 2006). Observed with NH3 =3-2 with an angular resolution of 1, the linewidths of the individual clumps in the Orion BN/KL core are narrow, smaller than the velocity resolution of 1.3 km s-1 in most clumps (Migenes et al. 1989). However, the relative peak velocities of the clumps are much larger than the thermal motions. This supersonic motion between clumps could be due to H II expansion, outflow motions, Alfvénic motions driven by the field, or other systematic motions.
The polarization of the emission from the Orion Nebula has been observed at various wavelengths and on various size scales. At a 0.5 pc (35) scale, the polarization at 350 and 450 m seems to be uniform, and the magnetic () field directions are perpendicular to the dust ridge at that scale (Houde et al. 2004; Vaillancourt et al. 2008). Schleuning (1998) proposed that the field starts to exhibit an hourglass-like morphology at a 0.5 pc scale based on the 100 m polarization results. Observed with a higher angular resolution of 0.01 pc (4) at 1.3 mm and 3 mm with the BIMA interferometer, the P.A.s of the polarization were found to vary significantly on the 0.02 pc (10) scale (Rao et al. 1998). Observations with 1 resolution at mid-IR by Aitken et al. (1997) also showed a significant change in P.A.s near IRc2. Similar structures in the polarization were also reported by Chrysostomou et al. (1994) using the H2 1-0 S(1) line, which traces hot gas originating primarily in shocks. In contrast to the mid-IR results, the polarized emission observed at sub-mm wavelengths can directly trace the dense regions, where the stars are forming. High angular resolution observations of the polarization at sub-mm can therefore be crucial to understanding the field structure near IRc2.
In this paper, we present 870 m observations of the Orion BN/KL region. By combining three different array configurations, we are able to achieve a much better coverage than the observations by Beuther et al. (2004), which also had a comparable angular resolution of 08. We detect dust structures 0.01 M☉ (see Section 3.1), with size scales ranging from 1.7 mpc to 0.19 pc. We compare the mass distribution and dynamics of these structures with the field morphology as deduced from the dust polarization maps.
2 Observation and Data Reduction
The observations were carried out on 2008 Jan 6, and 2009 Jan 25 and Feb 15 using the Submillimeter Array (SMA; Ho, Moran & Lo 2004)111The SMA is a joint project between the Smithsonian Astrophysical Observatory and the Academia Sinica Institute of Astronomy and Astrophysics and is funded by the Smithsonian Institution and the Academia Sinica. in the compact, subcompact, and extended array configuration, respectively. The projected baseline lengths ranged from 7 to 253 k ( = 870 m), corresponding to structures from 08 to 80 in size. The phase center was at R.A.(J2000) = 5h35m14.5s, decl(J2000) = -5°22′304. Other observational details are listed in Table 1. The SMA receiver system had two sidebands, each with a bandwidth of 2 GHz, when the observations were carried out. The sampled sky frequencies range from 345.5 to 347.5 GHz in the upper sideband and from 335.5 to 337.5 GHz in the lower sideband, with a uniform spectral resolution of 0.812 MHz (corresponding to a velocity resolution of 0.7 km s-1 ). At these frequencies, the primary beam (field of view) of the SMA is 32. Within the observational bandwidth, there is a significant contribution to the total emission from spectral lines of a number of molecular transitions (notably CO =3-2 and SiO =8-7). The continuum is generated after removing the spectral line contamination. The relative pointing accuracy of our maps is 006, which is estimated from the mean phase noise of 10 of the gain calibrators within the synthesized beam of 1.
The angular resolution (synthesized beam) achieved depends on the weighting of the visibilities used to make the map. Using natural weighting of the visibilities combined from all three tracks, the is 12 11. The noise level of the Stokes image is 90 mJy beam-1, which is 14 times the theoretical expectation. The reason for the degraded is the presence of bright large-scale structures, which could not be recovered because of the lack of short spacings. The noise levels of both the Stokes and images, which are much fainter, are much closer to the theoretical noise level, at 9 mJy beam-1. For the maps obtained from the extended array data with natural weighting, is 08 07 and is 40 mJy beam-1. The presented maps are made by combining different tracks with different visibility weightings in order to show both the high-resolution compact structures as well as large-scale extended structures. We note that these presented results are one of the highest spatial resolutions and the most sensitive synthesis maps of the polarization properties of thermal dust continuum at 870 m (§3.2) toward Orion BN/KL at the moment.
The data were calibrated and processed using the software package MIRIAD (Wright & Sault 1993). The gain calibration was obtained from observations of the quasar 0528+134, 0423013, or 0510+180 (see Table 1). It is necessary to remove the contributions due to instrumental polarization (leakage), as these are roughly similar in magnitude to the observed source polarization and can corrupt the data (see Marrone et al. 2006 and Marrone & Rao 2008 for the details of this method). The instrumental polarization was obtained from observations of the strong quasar 3c273 for 2 hr during transit in each track. The leakage term for each antenna and each sideband is derived independently. The total intensity (Stokes ) map was deconvolved using the task CLEAN in MIRIAD. When deriving the polarized intensity () and P.A.s with the task IMPOL, we used the dirty maps of Stokes and instead of the cleaned ones. This was done in order to avoid any possible bias that could be introduced by the CLEANing process. The task IMPOL also removed the effects of the bias of the positive measure of . The noise level of , is 9, 12, and 8 mJy beam-1 for the maps obtained from the combined three tracks, from the combined compact and subcompact tracks, and from the extended track, respectively. Except in Section 4.3, the P.A.s of polarization and the field throughout this paper are defined to start from the north and increase counter-clockwise from 0 to 180. The uncertainties of the detected polarization P.A.s are in the range of 216.
3 Results
3.1 Continuum Emission
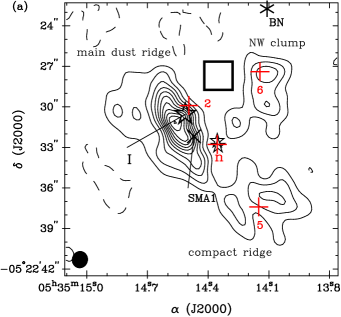
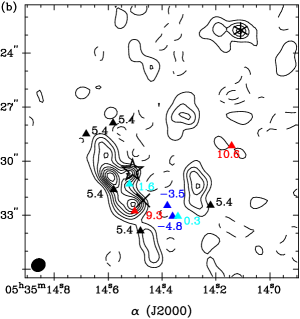
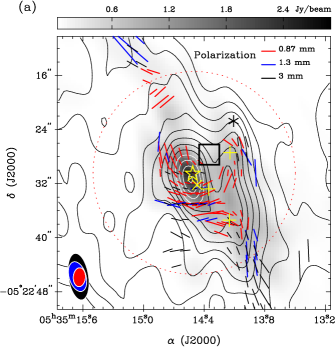
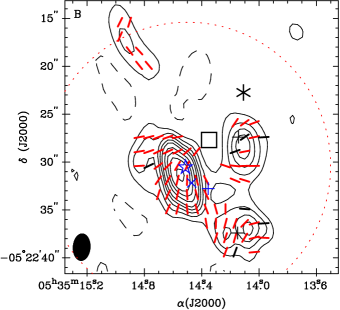
The 870 m continuum emission in Orion KL is resolved into three clumps (Figure 1) which form a shape. Note that nearly all of the 870 m emission is due to thermal dust emission (later in this section). The brightest dust continuum clump is associated with source I and SMA 1; hereafter, we call it the main dust ridge. The continuum peak is 1 southeast of source I and 2 north-east of SMA 1. The infrared sources IRc2 are to the northwest of source I, again offset from the peak of the main dust ridge. With the highest angular resolution obtained with the data from the extended array with natural weighting (Figure 1(b)), the continuum peaks near source I and SMA 1 were resolved. The position of SMA 1 is offset from the one reported by Beuther et al. (2004) by 05. This could be due to the difference in the deconvolution process or difference in the coverage. Nevertheless, our results confirm the detection of the peaks of source I and SMA 1 by Beuther et al. (2004). Besides, we also find that SMA 1 is embedded in the larger structure associated with the hot core.
In the west, two fainter dust clumps are detected to the south of BN. Note that the sub-mm counterpart of BN is clearly detected in our maps generated from the longest baselines only but not from the combined tracks. This could be due to the limitation of the dynamical range in the combined tracks, where bright and extended structures are recovered. The southwest clump is situated at the so-called compact ridge , where strong line emission of oxygen-bearing molecules was detected (Beuther et al. 2005). The infrared sources IRc4 and IRc5 are in the periphery of the compact ridge. The northwest clump is near the infrared sources IRc3, IRc6, and IRc20. Note that all the infrared sources are offset from the dust continuum peaks. Such offsets suggest that these sources are most likely physically located outside of the dense dust continuum clumps. Measurements of the extinctions toward these sources are required to estimate their relative positions along the line of sight, with respect to the dust emission peaks.
The detected flux density in the main dust ridge, compact ridge, and the northwest clump is 222 Jy, 81 Jy, and 81 Jy, respectively. When measured with the James Clerk Maxwell telescope, the brightest point with 14 angular resolution is 132 Jy beam-1 (Vallée & Fiege 2007). The reported SMA measurement therefore recovers 29% of the total flux density. When fitted with Gaussians toward the emission peaks in Figure 1(b), the detected flux density in BN, Source I, and SMA 1 is 2.20.2 Jy, 1.40.1 Jy, and 3.30.3 Jy, respectively. Note that the freefree emission in the region is very faint, being 4.5, 1.1, and 2 mJy at 3.6 cm and 31, 13, and 4 mJy at 7 mm for BN, source I, and source n, respectively (Menten & Reid 1995). The estimated freefree emission toward source I is in the range of 44400 mJy at 870 m, depending on the emission sources and physical conditions in source I (Beuther et al. 2006; Reid et al. 2007). Compared to the flux density detected toward source I within a 1 region, the freefree contribution is in between 3 and 30%. It is 2% when compared to the main dust ridge, which is 10 in length.
There is no 870 m continuum peak detected at source n and the BN-I center. Furthermore, the morphology of the 870 m dust continuum emission is similar to the NH3 line emission structure as seen by Migenes et al. (1989) and Wilson et al. (2000), i.e., being bright to the east of source I, source n, and SMA 1, and with a cavity to the west of these sources. The coincidence with the NH3 line emission suggests that the revealed 870 m continuum is mostly tracing the dense gas. Due to the significant differences in the spatial distributions of the molecules detected in these regions, Blake et al. (1987) and Beuther et al. (2005) suggest that these molecular line maps may help to differentiate evolutionary stages. The importance of the 870 m dust emission is that it is optically thin, impervious to chemistry and reliably tracks the total mass distribution if dust grains are not destroyed.
Associated with the main dust ridge is a ”hot core”, where a lot of hot core lines were detected (Beuther et al. 2005). The gas temperature is 165400 K (Wilson et al. 2000). Assuming of local thermal equilibrium, the dust emission traced here is most likely tracing dense and hot gas. We assume that the dust grains are at a temperature of 160 K as traced with NH3. The gas mass () in the main dust ridge estimated from the dust continuum is then 212 M☉, assuming a gas to dust ratio of 100, where the limits for are from the dust emissivity of 1 or 2. Note that the stellar mass of source I derived based on the kinematics of the maser spots is 610 M☉ (Greenhill et al. 2004). Based on the linewidths of 10 NH3 clumps, Migenes et al. (1989) reported the binding mass within each clump using the virial theorem. All of the clumps have a binding mass in the range 0.7 M☉ to 17.3 M☉. Note that all estimated from the kinematics are larger than our estimates, e.g., of source I is in the range 0.10.8 M☉ from the dust continuum but in the range 0.7 to 17.3 M☉ from the virial estimate. Possible explanations for this discrepancy might be that the majority of the dust grains we traced have been dispersed by stellar feedback, the gas temperature is extremely low in the cores, the gastodust ratio is significantly higher than 100, or the NH3 clumps are not in virial equilibrium. Based on the same assumptions, in the compact dust ridge and the NW clump are both in the range 0.64 M☉. Note that the elongation of the main dust ridge is perpendicular to the 0.5 pc field direction in the OMC-1 dust ridge as traced by Schleuning (1998) at a wavelength of 100 m.
3.2 Polarization
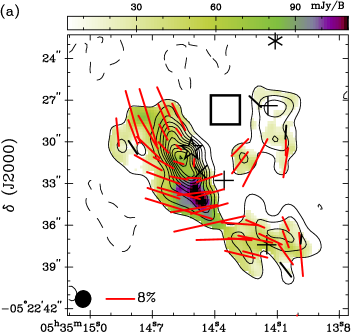
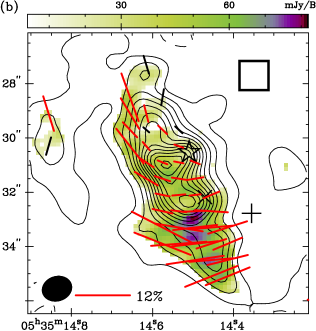
The linearly polarized emission () is detected and resolved in the main dust ridge and in the southwest clumps (color scale in Figure 2), and it is barely detected in the northwest clump. Near IRc2 to the west of the main dust ridge, there is weak or no detected (Figure 2(b)). is brightest in the south of SMA 1.
The detected polarization exhibits significant deviations in P.A.s between clumps. Among these, the polarization vectors extending from source I toward the south have very different P.A.s from the larger scale polarization direction at a mean P.A. of 26 detected at a 0.5 pc scale (Vallée & Fiege 2007). The rest of the vectors in the main dust ridge are consistent with the larger scale polarization direction, indicating that the field is retained mainly on a larger scale but not in the cores. With the combined data from the compact and subcompact arrays, the polarization from the extended structures is better detected (Figure 2(c)). The polarization in the northwest clump and in between the three clumps is detected. Extending from the northwest clump toward infrared source n and then toward the hot core, the polarization direction appears to vary continuously and smoothly. The polarization direction in the northwest clump, in the west, and east of the main dust ridge is nearly parallel to the field direction at the 0.5 pc scale. The most striking feature revealed with the 870 m polarization data is that the P.A.s vary smoothly and substantially across the main dust ridge, from a P.A. of 10 in the northeast to a P.A. of 100 in the south. With higher weighting toward more extended structures (Figure 2(c)), the variation of polarization appears to be continuous to the northwest clump and to the compact ridge.
3.3 Comparison of Polarization at 3 mm, 1.3 mm and 0.87 mm
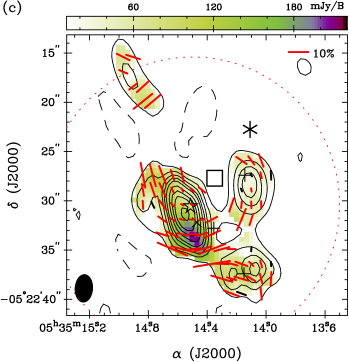
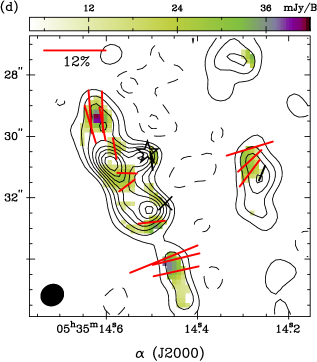
With BIMA, Rao et al. (1998) measured the polarized emission at 3 mm and 1.3 mm with an angular resolution of 4 (Figure 3). The polarization at 3 mm and 1.3 mm extends along the major axis of the OMC-1 dust ridge, where the P.A.s are consistent with the 0.5 pc scale polarization direction. Apart from the components along the dust ridge, there is one peculiar extension detected at 3 mm from the main dust ridge toward the southeast, where the direction of polarization (with P.A. of 70 100) is very different from the ones at other positions (with P.A. of 30, roughly parallel to the 0.5 pc polarization). Note that in Rao et al. (1998), the polarized emission at 3 mm seems to have a more extended structure as compared to the 1.3 mm map. This is most likely due to the differences in sensitivities at these two wavelengths.
With the higher angular resolution of the SMA, the polarizations north of source I and near IRc5 are clearly detected. Previous BIMA maps appear to be depolarized here. At these two locations, the P.A.s appear to vary significantly within the dust ridge. We have tested the effects of differences in resolution by convolving our CLEANed images of Stokes , , and maps with of the BIMA measurements at 3 mm. Most polarization vectors disappeared near IRc5 and north of source I. The depolarization previously seen is clearly due to the smearing of a more complex underlying structure, alike what we have found in the W51 e2/e8 region (Tang et al. 2009). Since the 870 m polarization is observed with only a single field, we are able to image the polarization only within the field of view of 32. The reason why there is no polarization detected at 870 m along the major axis of the OMC-1 dust ridge is mainly due to the decrease of the primary beam response near the edge of our field of view. Although the polarizations vary significantly in the KL region, our results show that such a variation is smooth and continuous. The extension toward the southeast, with a very different polarization direction at 3 mm, can possibly be traced back toward the south of the main dust ridge and the eastern compact ridge. In summary, our 0.87 mm polarization map reveals consistent polarized emission as compared to that seen at 3 mm and 1.3 mm. The abrupt change previously seen in P.A.s near IRc5 is shown to be due to the more complex underlying structure.
4 Discussion
What is new and important in this experiment?
-
1.
The dust continuum emission and its polarized components are resolved in a massive star-forming region at the 1 ( 2 mpc = 480 AU) scale for the first time.
-
2.
The detected polarization is in general consistent with and complementary to the 3 mm and 1.3 mm measurements by BIMA at 4 resolution. With higher angular resolution, the polarization in the north of IRc2 and adjacent to IRc5 have been detected and resolved in our 870 m map. In the fainter region, the polarization direction is consistent with the 0.5 pc scale polarization direction. However, in the south of SMA 1 extending toward IRc5, the P.A.s are nearly perpendicular to the larger scale direction. The striking feature is that this deviation is smooth across the dust ridge.
-
3.
In the main dust ridge, is much lower or absent on the western side of the main dust ridge, immediately to the west of source I.
Based on these results, in the following sections we discuss possible interpretations of the polarization properties, together with the known kinematics.
4.1 Kinematics and Field
4.1.1 Largescale Kinematics and 870 m Dust Continuum
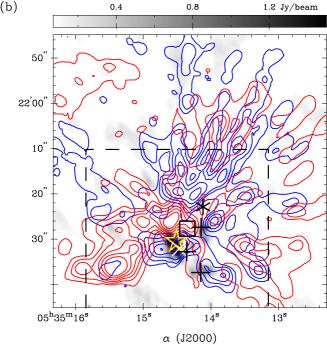
Zapata et al. (2009) noted the comparable energies released in the CO outflows and the ejection of the three sources (BN, source I, and source n) from the BN-I center, which are both on the order of 1047 erg s-1. Both the outflows and the ejection phenomenon are estimated to have happened 500 yr ago. Moreover, the very special morphologies of this highly impulsive and poorly collimated molecular outflow (Figure 3(b)) indicate that this case is very different from the typical bipolar outflows associated with the isolated star formation process. They propose that the 0.14 pc CO outflow may be the result of the disintegration of a central cloud core or circumstellar disks near the BN-I center, when these three sources underwent a close dynamical encounter.
The fact that the 0.14 pc CO outflow filaments are numerous and bright preferentially in the northern part of the BN-I center can be explained by our detected 870 m continuum emission. First, there is no dust continuum emission at the BN-I center. As discussed in Section 3.1, the similarity between the dust continuum emission and the integrated NH3 line emission suggests that the central cavity is real, and the gas density here is lower. The close encounter 500 yr ago might have cleared out the majority of the molecular gas near the BN-I center. Second, the densest structures appear to be stronger in the SE of the BN-I center, where the dust ridges are dense enough to withstand the ionizing radiation and the shock fronts released in the event of the close encounter. Note that the gas mass of the large-scale outflow is 10 (Kwan & Scoville 1976). The gas mass within the 14 beam toward IRc2 is 11100 M☉ as estimated from the single dish 870 m continuum measurement by Vallée and Fiege (2007) with the same assumptions as in Section 3.1. It is difficult to conclude if there was sufficient gas to truncate the outflows before the majority of the gas was dispersed. Note that the luminous Ori C is 1 away from source I. Besides, the large-scale jets traced by H2 are also less numerous in the southeast. It is therefore less likely that the CO bullets were photo-dissociated by Ori C.
4.1.2 Clump Outflow Interaction and Estimate of B Field Strength
The kinematics within the dense dust ridge also provide some clues of the physical conditions in this region. Note that the NH3 clumps are narrow in linewidths, being smaller than the spectral resolution of 1.3 km s-1, but having a maximum difference in velocity between clumps of 15 km s-1 (Migenes et al. 1989; marked in Figure 1(b)). As suggested by the same authors, there must be systematic motions driving the motions between the clumps. Based on the comparison of NH3 (3,2) maps integrated at different velocity ranges, Migenes et al. (1989) suggested that the NH3 emission traces an incomplete expanding cylinder.
Besides the above scenario, it is highly possible that the molecular gas and the clumps have been impacted by the outflows which may have driven large relative velocities between clumps. The question then arises as to why the linewidths of individual clumps remain so small. Can the existence of a field help to confine the clumps? To check if the clumps can be held together by their own gravity in the presence of the outflows, we first compare the ram pressure, , and the gravitational binding force per unit area, , of the clumps. is given by , where is the mass density of the outflow, and is the relative velocity between the NH3 clumps and the outflows. No exact value for is found from the literature for this region. We assume that the mass of 10 M☉ contained in the outflow is uniformly distributed within a sphere with a radius of 7. is then 3.7 10-17 g cm-3, which translates into a number density 2 107 cm-3. The outflows detected closest to the BN-I center in Zapata et al. (2009) start from the radial velocity with respect to the local standard of rest, , of 40 and 30 km s-1 for the redshifted and blueshifted parts, respectively. Since the NH3 clumps are at of 5 to 10.6 km s-1 (Migenes et al. 1989), is then in the range between 25 and 45 km s -1. The estimated is 2 - 7 10-4 dyn cm-2. is equal to 2G, where and are the surface mass density of the gas and of the NH3 clumps, respectively. From Migenes et al. (1989), of the NH3 clumps is 108 cm-3, which gives the mass density of the clump 4.3 10-16 g cm -3. From the same reference, the diameters of the clumps are all 1, which gives a mean of 3 g cm-2. Assuming = , is 3.9 10-6 dyn cm-2. Thus, is 12 orders of magnitude smaller than , indicating that these clumps would not be able to withstand the ram pressure. Consequently, over time they would disintegrate. This would likely result in broader linewidths than what is observed.
The major uncertainty in the estimated is probably . If is 2 orders of magnitude smaller, being 3.7 10-19 g cm-3, the clumps can still remain confined. Otherwise another force is needed to sustain the clumps. One possible force is the field surface tension between the outflows and the clumps. This tension, in addition to self-gravity, can maintain the clump shape and help to suppress surface instabilities (KevinHelmholtz instability) resulting from ram pressure with sufficient velocity shear. Following Vikhlinin, Markevitch, & Murray (2001), if + 4, the clumps can remain confined. Assuming is 3.7 10-17 g cm-3, the estimated latter term is 4 10-4 erg cm-3. Therefore, if = 8 mG, the clumps can remain confined. If is 10 times smaller, being 3.7 g cm-3 ( cm-3), the field strength needs to be 3 mG. On the other hand, if is 10 times larger - because 3.7 10-17 g cm-3 is also possibly a lower limit because the outflows are not uniformly distributed over a sphere - a field strength of 30 mG is needed.
In summary, in order to confine the NH3 clumps in the presence of the outflows with of 2545 km s-1 and of the outflows 2106 cm-3, the field strength within the NH3 clumps or the outflows needs to be larger than 3 mG. The estimated lower limit of 3 mG is roughly consistent with the observed field strength from OH masers (see Section 4.3.2) of 116 mG. Larger field strengths, which are required because of larger , might be achievable through local field compression. The method presented here provides an independent estimate of the total field strength in this region.
4.2 Dust Grains Being Mechanically or Magnetically Aligned?
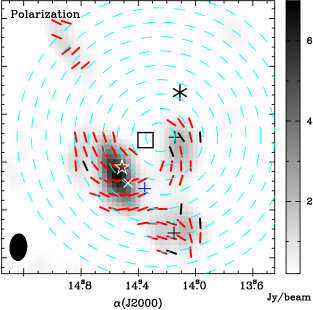
There are several molecular outflows detected in the Orion BN/KL region. The largescale CO outflows (0.08 pc) are in the northwestsoutheast direction (Chernin & Wright 1996). As observed with a 3 resolution and a larger field (0.14 pc), the outflow is more spherically symmetric centered at the BN-I center (Zapata et al. 2009; Figure 3(b)). The velocities of the outflows are up to 100 km s-1. The low velocity outflow centered on source I is in the NESW direction. An ionized flow has been proposed centered on source n in nearly a northsouth direction (Greenhill et al. 2004; Menten & Reid 1995). If the dust grains are mechanically aligned by these outflows, the detected polarization should be nearly parallel to the direction of these outflows due to the Gold alignment (Gold 1952), where the elongated dust grains have their major axis aligned with the flow direction due to dynamical interactions with the outflowing gas. In this case with a dominating mechanical alignment the detected coherent polarization is not related to any field. Although the driving sources of these outflows are different, they are located within 10 from the BN-I center. In the case of dust grains that are mechanically aligned, the directions of the polarization P.A.s should be nearly radial around the center of the spherical outflows detected by Zapata et al. (2009). No field is needed in this scenario. As shown in Figure 3 and in the right panel of Figure 4, the polarization segments appear to be curl-like, rather perpendicular to the explosive outflow. Additionally, the smooth variation in P.A.s as a function of azimuth (see discussions in Section 4.3) across the dust ridge seems to be difficult to explain by the alignment via outflows. Therefore, a mechanical alignment by outflows seems unlikely.
Based on the theoretical calculations on magnetic alignment mechanisms, it has been suggested that dust grains are aligned by the field in most cases (Lazarian 2007). We will adopt this in the following section (Section 4.3) when discussing the polarization patterns as a result of magnetic alignment. The direction of the projected field can then be derived by rotating the detected polarization angles by 90.
4.3 Interpretation of the Polarization Resulting from Magnetic Alignment Possible Overall Field Morphologies
Before discussing two possible interpretations of our higher resolution field morphology, we first summarize the large-scale field geometry. At the 0.5 pc scale observed with a 15 resolution, the field appears to be uniform across OMC-1. Schleuning (1998) further proposed that the field is hourglass-like along the OMC-1 ridge. The same author further pointed out that there is no local pinched field detected near the BN/KL region. When zooming in with a 4 angular resolution, Rao et al. (1998) showed that the polarization nearly 20 away from IRc2 is consistent with the 0.5 pc field direction. In the same paper, the polarization near BN/KL was found to change abruptly. With a 1 resolution, we find that the field morphology near IRc2 varies significantly but smoothly. Besides, the field direction away from IRc2 appears to be consistent with the 0.5 pc large-scale field direction. In summary, the fields traced at 0.5 pc (Schleuning 1998), at 0.05 pc (Rao et al. 1998) and at 0.01 pc (this paper) exhibit consistent field directions away from IRc2. With a 1 resolution, the field geometry near the densest region BN/KL is clearly resolved.
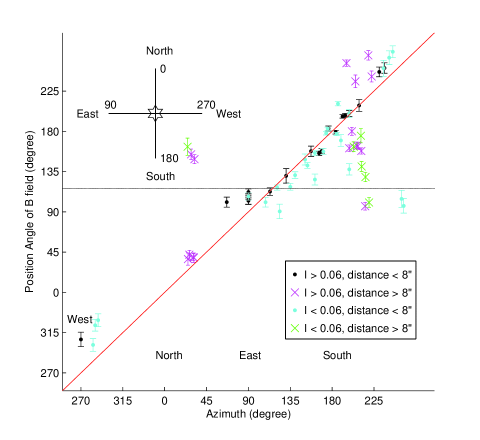
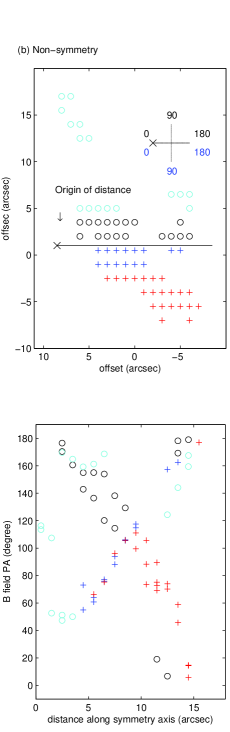
Following the argument in Section 4.2, the dust grains are most likely aligned via the field and a mechanical alignment is unlikely. In Figure 4, the field map is presented by rotating the polarization P.A. by 90 with identical length for each segment. We note that the field lines detected near IRc2 in BN/KL all point toward the BN-I center. In order to further analyze this possible correlation, we plot the distribution of the field P.A.s as a function of the azimuth angle of the emitting region. For this purpose, azimuth is defined to increase counterclockwise from 0 to 360 starting from the north. The origin of the azimuth reference frame is chosen to be 25 west of the BN-I center, as determined by the best correlation between the field directions and the azimuth angles. Note that in order to check the azimuthal symmetry property, the P.A.s of the observed fields (conventionally defined in a range of 180) are re-defined in the same way as the azimuth angle over a range of 360. For example, a P.A. of 20 for the field is re-defined as 200 if the corresponding azimuth angle is 270. As shown in Figure 5, there is a general trend that the observed field direction varies linearly as a function of azimuth with a slope of one. This characterizes the azimuthally symmetric structure in the overall field morphology, especially for the data points close to the reference center and with stronger intensity. If the origin of the azimuth reference frame is set to the BN-I center, there is a systematic shift of data points and therefore, the correlation with azimuth angle is less pronounced.
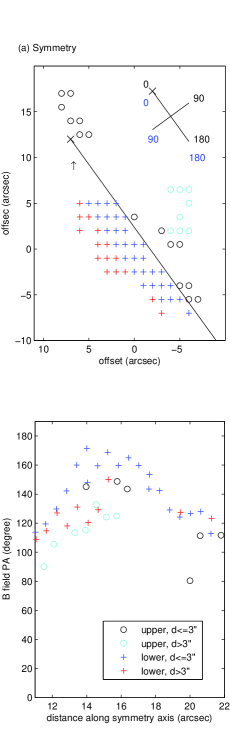
Nevertheless, given some deviations from the straight line in Figure 5 especially in the southern region we further check if there is also a preferred (single) azimuth direction possibly revealing a symmetry plane. Indeed, we find that there is a preferred symmetry plane (Figure 6), where the corresponding field lines above and below the plane show symmetric structures. As a measure of symmetry, we check the rms of the difference in the field P.A.s, P.A., for corresponding data points in the upper and lower symmetry planes. For this purpose, the field P.A.s above and below a possible symmetry plane are re-defined conventionally in the range 0 180 clockwise in the upper plane and counterclockwise in the lower plane. With this definition, a mirror symmetrical structure will give P.A. = 0, and the smaller P.A. the closer the structure is to a mirror symmetry. Since there is no exact one-to-one correspondence of the detected polarization in the upper and lower planes, we interpolate the data onto a regular grid and then calculate P.A.. The formulation is P.A. = . For the best-guess symmetry plane along a P.A. of 36, P.A. is 26. For a typical non-symmetry plane (rightpanel in Figure 6), P.A. is 48. Consequently, the symmetry along the plane at a P.A. of 36, where P.A. is 26, is very significant, minimizing P.A. to a level where it is close to the measurement uncertainties (10). We note that this preferred symmetry plane (plane along a P.A. of 36) is nearly perpendicular to the largescale field direction (mean field direction is 120), as might be expected for dense structures forming in the contraction process under a strong field.
Besides the symmetry morphologies discussed above, the P.A. patterns also exhibit remarkably smoothly changing features. Such smooth but significant variations in the P.A.s across the dust ridges are consistent with the polarization maps obtained in the H2 S(1) emission reported by Chrysostomou et al. (1994). Again, we emphasize that the submm continuum and polarization maps are sensitive to the dense structures, while the H2 emission traces warm/hot gas with typically 1000 K resulting from shocks (e.g., Kristensen et al. 2007). The consistency between the submm and NIR polarizations indicates that the smooth variation in the field directions is continuous, regardless of the physical environments. How can the field lines vary so significantly within 0.1 pc? Since the two dominant forces in the system are gravity and the explosive event, in the following subsections, we discuss two possible shaping mechanisms of the field morphology where either one of the two forces is dominant.
4.3.1 Poloidal and Toroidal B Fields?
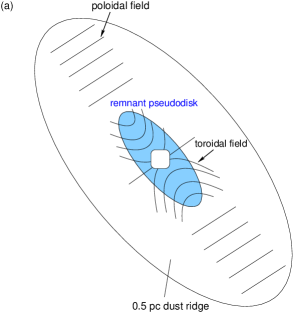
The field morphology can originate from collapse and accretion. The partially ionized molecular gas flows along the largescale field, and then dense structures are elongated perpendicular to the field lines. When the dense elongated structures (pseudo-disks) form inside the molecular cloud, a toroidal field is expected in a magnetized and ionized cloud. The existence of a toroidal field component can be due to the differential rotation of the disk (Newman, Newman, & Lovelace 1992), where the field lines are anchored to the rotating disk such that the field direction is nearly perpendicular to the rotation axis in or near the disk. In this scenario, the fields in the extension following the OMC-1 dust ridge are tracing the poloidal field. This is schematically illustrated in Figure 7(a). However, there is no evidence of such a largescale disk based on our continuum map (Figure 1). As discussed in Section 3.1, the dense structures form a V-shape pattern, where the cavity is near the BN-I center. It is possible that this shape of dense structures can be formed as a process of ring fragmentation as discussed in Machida et al. (2005), although in their model this occurs at a much smaller scale (100 AU scale) and in an environment with much higher number density. Alternatively, it is also possible that the disk-like structure has been swept away in the event of the close encounter 500 yr ago (Section 4.3.2), still possibly preserving poloidal and toroidal field structures.
In order to test this scenario, we have to estimate the period of rotation. The rms velocity of the detected NH3 emission is 5 km s-1 (Migenes et al. 1989). If the radius of the pseudo-disk is 10, as estimated from the scale where the change in polarization direction is detected, the period of the rotation is 3 104 yr. As compared to the time scale of the formation process of a typical lowmass young stellar object, on the order of Myr, the period is short, which means that any disk should have rotated many times. The toroidal field lines embedded in the disk would have been dragged for many revolutions and would be wound up. One possibility is that ambipolar diffusion allowed the field lines to slip relative to the rotating disk. However, it appears contrived to maintain the observed field geometry after many rotations of the disk. It is also possible that the field lines are mainly pulled by the contraction process and the accretion rate is high enough to overcome the sustaining field tension. In this scenario, the toroidal field structure seen near IRc2 is organized by the contraction process and therefore possibly exhibits an incomplete hourglass structure.
We also note that an accreting disk for source I has been proposed (Reid et al. 2007; Matthews et al. 2010), which is the most convincing disk near an intermediate mass protostar. The disk direction is nearly parallel to the largescale field direction, and it is not correlated with the pseudodisk, indicating that field directions are not necessarily retained in the cores due to an event of a recent close encounter (Zapata et al. 2009) or simply due to the difference of angular momentum at various scales (e.g., L1489; Brinch et al. 2007).
4.3.2 B field lines being shaped and dragged along with explosive outflows?
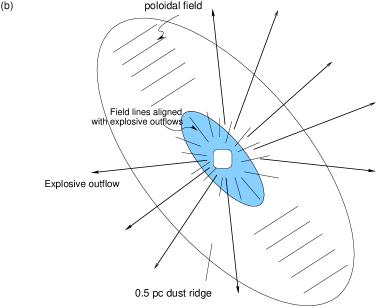
Another possible shaping mechanism is that the field lines together with the dust grains are dragged along with the outflows (Figure 7(b)). In this case in order to explain the polarization patterns perpendicular to the outflows (Section 4.2) the dust grains are required to remain anchored to the field in an environment where the bulk motions are substantial and dramatic, so that a mechanical dust grain alignment might be possible. The velocity of the outflow is up to 100 km s-1, which is highly supersonic. However, if the explosive outflows drag along the field lines, dust grains, and other molecules all together, the dust grains in the local rest frame might not suffer from a higher collision rate and therefore can still remain magnetically aligned. Furthermore, the kinematics within the clumps, inferred from the narrow linewidths of NH3 lines, indicates that the clumps do not have large internal velocity dispersions. This is consistent with the suggestion that the outflow motions affect mainly the bulk motions and also largescale field lines. It remains to be determined whether the outflow energy density (pressure) is enough to drag and shape the field lines.
The field tension, , can be approximately estimated by using the equation: = . The field strength, , near IRc2 is in the range 1 mG16 mG, based on the OH maser Zeeman splitting (Johnston, Migenes, & Norris 1989; Cohen et al. 2006) and is 0.4 mG along the line of sight based on the Zeeman splitting of the CN line (Crutcher et al. 1999). Note that estimated to confine the NH3 clumps (Section 4.1.2) is 3 mG if of the outflows is 10-6 cm -3, which is consistent with the OH maser measurements. The curvature of the field, , is difficult to estimate because of the azimuthal symmetry and also the existence of a preferred symmetry plane. Here, we adopt a curvature of 1/10 based on the change in P.A.s along the dust ridge. The estimated is then in the range of 1 10-24 to 3 10-22 (dyn cm-3). The momentum transfer rate per unit volume, , can be estimated from 8 106 L☉ c-1 (Kwan & Scoville 1976) divided by the volume of interest, where is the speed of light. Since the largescale outflows have a common center near the BN-I center, it is reasonable to assume that the energy contained in the outflows originates in the BN-I center. Assuming that the energy released in the outflows is uniformly distributed over a sphere of radius of 10, is 4 10-15 (dyn cm-3). Even assuming a volume with a radius 10 times larger, which would cover the entire outflow area, would still give 4 10-18 (dyn cm-3). Although depends on the assumed age of the outflow, where 3000 yr is used in Kwan & Scoville (1976), the fact that is at least 4 orders of magnitude larger than suggests that the outflows are energetic enough to distort the field lines of curvature of 1/10. However, it is extremely difficult to shape the field lines because in the shaping process, both and increase. This scenario is more likely if such a distortion happens as bulk motion, i.e., will not decrease infinitely but has a minimum of 0.5 AU, which is 10-4 of 10, if remains as 16 mG in the process.
In order to distinguish between the driving mechanisms for the shaped field lines, observations with a more complete coverage, higher angular resolution, and higher sensitivities are needed. The link of the field geometry near the BN-I center and the locations where no polarization was detected will be helpful. ALMA will be able to improve this picture. For example, if the field lines are shaped by explosive outflows, an azimuthal symmetry of field lines is expected to point all the way back toward the BN-I center, where there is de-polarization in current observational results. If the field lines are shaped by rotation or accretion, both the toroidal field lines, which are connected to the magnetized cores, and the poloidal fields from largescale fields are expected. The polarization emission from different molecular lines via the GoldreichKylafis mechanism (Goldreich & Kylafis 1981) might also be helpful to trace the field geometry in different physical conditions, e.g., lower density regions. Besides observations, analysis tools to quantify the mirror and radial symmetry will be needed.
4.4 Comparison with other massive star formation sites
The field geometries in the collapsing cores of the massive star formation regions W51 e2/e8 (Tang et al. 2009) and G31.41 (Girart et al. 2009) are found to be highly pinched, similar to what has been found in the low mass cases. We note that both W51 e2/e8 and G31.41 are at larger distances of 7 kpc and 7.8 kpc, respectively. The signature of rotation has been detected with the recombination line in W51 e2/e8 and with molecular lines in G31.41. The radius of the rotation is 1. If these sources were at the distance of 480 pc as Orion BN/KL, the scale of the rotation signature would be up to 16, comparable to the scale of the distorted field lines presented here.
A uniform field on the scale of 0.5 pc is found in W51 e2/e8 with two collapsing cores inside a larger scale envelope. Tang et al. (2009) have proposed that these are most likely due to magnetic fragmentation. In OMC-1, we find that the structures seen in the W51 e2/e8 region are possibly not a unique case. At a 0.5 pc scale, the field is also uniform, and there are dense cores (Orion BN/KL and Orion south) detected. The comparison with starforming cores within stable envelopes is important to test different fragmentation scenarios. When observed with higher angular resolution, the field lines within dense cores in both regions appear to be shaped by either gravity or outflows. This might be a hint of the changing role of the field as a function of scale. To test the dependence of scale, we have started a statistical analysis with polarization measurements combining data from different scales. See Koch, Tang & Ho (2010) for more details.
Observational and theoretical predictions indicate that the ambipolar diffusion scale is on the order of 1 mpc. In this paper, we are able to measure the field morphology close to this turbulence scale. Based on the smooth polarization morphology, we conclude that the field is also dominant over turbulence close to the scale of 2 mpc. This is consistent with previous observations in M17 by Li & Houde (2008). As compared to gravity and the largescale kinematics, the B field is clearly overwhelmed by these two forces at the 2 milli-pc scale. Even though the field lines are highly shaped by the large scale kinematics, the overall B field morphology is still organized and not affected much by the small-scale turbulence, if they are present.
5 Summary and Conclusion
The 870 m dust continuum and its linearly polarized emission are detected and resolved in the Orion BN/KL region. With an angular resolution of 1, it is the first time that the polarized emission from the dust continuum at submillimeter wavelengths in the Orion region is resolved at 2 mpc (480 AU), which is about the ambipolar diffusion scale in M17. As compared to the dust polarization previously detected, the revealed polarization in the south of IRc2 changes smoothly by 90 instead of abruptly as previously reported at lower angular resolution. The continuum emission appears to be -shaped with a cavity near the center of the explosive outflows (Section 3.1), called the BN-I center in this paper. The brightest dust clump is associated with source I and SMA 1.
The detected polarization appears to be curl-like near the BN-I center (Section 3.2). Such a polarization pattern indicates that the dust grains are most likely magnetically aligned instead of mechanically aligned with the outflows because the latter mechanism would produce a radial-like polarization pattern (Section 4.2). The magnetic () field projected in the plane of sky is therefore derived by rotating the P.A.s of the polarization by 90.
We have checked the symmetry properties of the inferred field lines. There is an azimuthal symmetry of the field lines centered about 25 west of the BN-I center (Section 4.3), indicating that the field pattern might be correlated with the explosive outflows. Besides the azimuthal symmetry, there are polarization patches which clearly deviate from a radial symmetry. Therefore, we have further checked if there is additionally a mirror symmetry in the detected field lines. Indeed, there is a preferred plane of symmetry at a P.A. of 36, nearly perpendicular to the largescale field direction at a P.A. of 120. This is expected in the formation of a dense core within a magnetized molecular cloud, where most material can flow along the field lines and thus dense structures form perpendicular to the field direction.
One possible interpretation of the detected field lines is that there are both poloidal and toroidal fields near the BN/KL region, possibly associated with a remnant pseudo-disk (Section 4.3.1). In this scenario, the detected field inferred from the dust continuum is toroidal in the south of source I and east of IRc5, and is mostly poloidal in the rest of the detected field lines. The poloidal field is consistent with the field direction observed at 0.5 pc scale in the OMC-1 dust ridge. Since the estimated period of such a remnant pseudo-disk is 12 orders of magnitude shorter than the typical star formation time scale, mechanisms to prevent the field lines from winding up are needed. Another interpretation of the detected field is that the field lines are dragged along with the 0.14 pc scale, explosive CO outflows (Section 4.3.2). The momentum transfer rate of the outflow is at least 4 orders of magnitude larger than the field tension with a curvature of 10, indicating that the outflows are energetic enough to distort the field lines. However, it will require much more energy to distort the field lines if the curvature of the field lines decreases and if the field strength increases due to flux conservation. This scenario is more likely if such distortion happens as bulk motion.
In order to distinguish between these two scenarios, it will be very helpful to obtain the field geometry of the depolarization region near the BN-I center and of the lower density regions. Observations with higher angular resolution and sensitivity are required. ALMA will be able to provide much more sensitive and higher angular resolution images. Besides dust polarization, measurements of molecular line polarization also might be helpful to probe the field geometry in different physical conditions. The analysis tools to quantify the mirror symmetry and compare it to the radial symmetry will also be helpful to further solve the mystery. We note that in the main dust ridge, it has been suggested that source I and SMA are newly formed stars, indicating that further fragmentation is ongoing within the remnant disk.
The authors acknowledge the anonymous referee for the helpful comments, which have improved the presentation of the paper. Y.-W. T. is grateful to Josep M. Girart and Mike Cai for the interesting discussions. Y.-W. T. and P. T. P. H. are supported by the NSC grant NSC97-2112-M-001-007-MY3 and NSC98-2119-M-001-024-MY4.
| Date | Configuration | Gain Calib. | Flux Calib. | BP/Pol. Calib. |
|---|---|---|---|---|
| 2008 Jan 6 | Compact | 0528+134 | Uranus | 3c273 |
| 2009 Jan 25 | Subcompact | 0423013/0510+180 | Titan | 3c273 |
| 2009 Feb 15 | Extended | 0423013 | Titan | 3c273 |
Note. — BP/Pol. refers to bandpass/polarization. Calib. refers to the calibrator. In all of the observations, the local oscillator frequency was tuned at 341.482 GHz. In both compact and subcompact tracks, seven of eight antennas were available. In the extended track, there were eight antennas available.
References
- (1) Aitken, D. K., Smith, C. H., Moore, T. J. T., Roche, P. F., Fujiyoshi, T., Wright, C. M. 1997, MNRAS, 286, 85
- (2) Beuther, H., et al. 2004, ApJ, 616, L31
- (3) Beuther, H., et al. 2005, ApJ, 632, 355
- (4) Beuther, H., et al. 2006, ApJ, 636, 323
- (5) Blake, G. A., Sutton, E. C., Masson, C. R., & Phillips, T. G. 1987, ApJ, 315, 621
- (6) Brinch, C., Crapsi, A., Jrgensen, J. K., Hogerheijde, M. R., & Hill, T. 2007, A&A, 475, 915
- (7) Chandler, C. J. 2005, in ASP conf. Proc., 340, Future Directions in High Resolution Astronomy: The 10th Anniversary of the VLBA, ed. J. Romney & M. Reid. (San Francisco, CA: ASP), 317
- (8) Chernin, L. M., & Wright, M. C. H. 1996, ApJ, 467, 676
- (9) Chrysostomou, A., Hough, J. H., Burton, M. G., & Tamura, M. 1994, MNRAS, 268, 325
- (10) Cohen, R. J., Gasiprong, N., Meaburn, J., & Graham, M. F. 2006, MNRAS, 367, 541
- (11) Crutcher, R. M., Troland, Th. H., Lazareff, B., Paubert, G., Kazès, I. 1999, ApJ, 514, 121
- (12) Genzel, R., Reid, M. J., Moran, J. M., & Downes, D. 1981, ApJ, 244, 884
- (13) Girart, J. M., Rao, R., & Marrone, D. P. 2006, Science, 313, 812
- (14) Girart, J. M., Beltrán, M. T., Zhang, Q., Rao, R., & Estalella, R. 2009, Science, 324, 1408
- (15) Goddi, C., Greenhill, L. J., Chandler, C. J., Humphreys, E. M. L., Matthews, L. D., & Gray, M. D. 2009, ApJ, 698, 1165
- (16) Gold, T. 1952. MNRAS, 112, 215
- (17) Goldreich, P., & Kylafis, N. D. 1981, ApJ, 243, 75
- (18) Gomez, L., Rodriguez, L. F., Loinard, L., & Lizano, S. 2005, ApJ, 635, 1166
- (19) Greenhill, L. J., Reid, M. J., Chandler, C. J., Diamond, P. J., & Elitzur, M. 2004, in IAU Symp. 221, Star Formation in High Angular Resolution, ed. M. G. Burton, R. Jayawardhana, & T. L. Bourke (Cambridge: Cambridge Univ. Press), 115
- (20) Ho, P. T. P., Moran, J. M., Lo, K. Y. 2004, ApJ, 616, L1
- (21) Houde, M., Dowell, C. D., Hildebrand, R. H., Dotson, J. L., Vaillancourt, J. E., Phillips, T. G., Peng, R., & Bastien, P. 2004, ApJ, 604, 717
- (22) Johnston, K. J., Migenes, V., & Norris, R. P. 1989, ApJ, 341, 847
- (23) Kaifu, N., et al. 2000, PASJ, 52, 1
- (24) Kleinmann, D. E., & Low, F. J. 1967, ApJ, 149, L1
- (25) Koch, P. M., Tang, Y.-W., & Ho, P. T. P. 2010, ApJ, submitted
- (26) Kristensen, L. E., Ravkilde, T. L., Field, D., Lemaire, J. L., & Pineau des Forts, G. 2007, A&A, 469, 561
- (27) Kwan, J., & Scoville, N. 1976, ApJ, 210, L39
- (28) Lada, C. J., & Lada, E. A. 2003, ARA&A, 41, 57
- (29) Lazarian, A. 2007, J. Quant. Spectrosc. Radiat. Transfer, 106, 255
- (30) Li, H.-B., & Houde, M. 2008, ApJ, 677, 1151
- (31) Machida, M. N., Matsumoto, T., Hanawa, T., Tomisaka, K. 2005, MNRAS, 362, 382
- (32) Marrone, D. P., Moran, J. M., Zhao, J.-H., & Rao, R. 2006, ApJ, 640, 308
- (33) Marrone, D. P., & Rao, R. 2008, Proc. SPIE, 7020, 60
- (34) Matthews, L. D., Greenhill, L. J., Goddi, C., Chandler, C. J., Humphreys, E. M. L., & Kunz, M. W. 2010, ApJ, 708, 80
- (35) Menten, K. M. & Reid, M. J. 1995, ApJ, 445, L157
- (36) Newman, W. I., Newman, A. L., & Lovelace, R. V. E. 1992, ApJ, 392, 622
- (37) Migenes, V., Johnston, K. J., Pauls, T. A., & Wilson, T. L. 1989, ApJ, 347, 294
- (38) Nissen, H. D., Gustafsson, M., Lemaire, J. L., Clénet, Y., Rouan, D., & Field, D. 2007, A&A, 466, 949
- (39) Plambeck, R. L. et al. 2009, ApJ, 704, L25
- (40) Rao, R., Crutcher, R. M., Plambeck, R. L., & Wright, M. C. H. 1998, ApJ, 502, L75
- (41) Reid, M. J., Menten, K. M., Greenhill, L. J., & Chandler, C. J. 2007, ApJ, 664, 950
- (42) Schleuning, D. A. 1998, ApJ, 493, 811
- (43) Scoville, N., Kleinmann, S. G., Hall, D. N. B., & Ridgway, S. T. 1983, ApJ, 275, 201
- (44) Shuping, R. Y., Morris, M., & Bally, J. 2004, AJ, 128, 363
- (45) Tang, Y.-W., Ho, P. T. P., Koch, P. M., Girart, J. M., Lai, S.-P., & Rao, R. 2009, ApJ, 700, 251
- (46) Vaillancourt, J. E. et al. 2008, ApJ, 679, L25
- (47) Vallée, J. P., & Fiege, J. D. 2007, AJ, 133, 1012
- (48) Vikhlinin, A., Markevitch, M., & Murray, S. S. 2001, ApJ, 549, L47
- (49) Wilson, T. L., Gaume, R. A., Gensheimer, P., & Johnston, K. J. 2000, ApJ, 538, 665
- (50) Wright, M. C. H., & Sault, R. J. 1993, ApJ, 402, 546
- (51) Zapata, L., Schmid-Burgk, J., Ho, P. T. P., Rodríguez, L. F., Menten, K. M. 2009, ApJ, 704, 45