Diffuse X-ray Emissions from Dynamic Planetary Nebulae
Abstract
We present theoretical results of a piecewise isothermal shock wind model devised for predicting the luminosity and surface brightness profile of diffuse X-ray emissions primarily from the inner shocked downstream wind zone of a planetary nebula (PN) surrounded by self-similar shocked dense shell and outer slow AGB wind envelope involving self-gravity and compare/fit our computational model results with available observations of a few grossly spherical X-ray emitting PNe. Matching shocked piecewise isothermal self-similar void (ISSV) solutions with self-gravity of Lou & Zhai (LZ) for the outer zone and a stationary isothermal fast tenuous wind with a reverse shock for the inner zone across an expanding contact discontinuity, we can consistently construct dynamic evolution models of PNe with diffuse X-ray emissions. On the basis of such a chosen dynamic wind interaction model, both X-ray luminosity and radial X-ray brightness profile are determined by three key parameters, namely the so-called X-ray parameter , two radii and of the reverse shock and the contact discontinuity. We find that morphologies of X-ray emissions would appear in the forms of either a central luminous sphere or a bright ring embedded within optically bright shells. In contrast to previous adiabatic models, the X-ray brightness peaks around the reverse shock, instead of the contact discontinuity surface just inside the outer shocked dense shell. Diffuse X-ray emissions of a few observed PNe appear to support this wind-wind dynamic interaction scenario.
keywords:
hydrodynamics — ISM: clouds — planetary nebulae — radiation — shock waves — X-rays: ISM1 Introduction
Planetary nebulae (PNe) are produced at the late stage of stellar evolution, when a star transits from the asymptotic giant branch (AGB) phase where a star blows slow AGB dense wind to the later phase showing a central compact star (i.e. hot white dwarf gradually exposed). As the later tenuous fast wind chases and collides with an earlier circumstellar slow massive AGB wind envelope, a forward shock emerges and runs outwards into the slow AGB wind zone, while a reverse shock travels radially inwards relative to the inner fast wind; a contact discontinuity in between separates the forward and reverse shocks. Such dynamic shock interaction of wind-wind collision rearranges the distribution of AGB wind envelope and eventually result in a quasi-spherical PN (e.g., Kwok et al., 1978; Volk & Kwok, 1985; Chevalier, 1997; Bian & Lou, 2005; Yu et al., 2006; Lou & Zhai, 2009, – referred to as LZ hearafter). Ignoring the gravity effect completely, Chevalier (1997) presented an isothermal dynamic model for PNe and constructed spherically symmetric global hydrodynamic solutions to describe the expansion of outer shocked shell with an inner contact discontinuity of fast wind moving at a constant speed in the inner zone. LZ advanced a piecewise isothermal model framework including the gas self-gravity and showed various plausible self-similar dynamic behaviours of outer PN envelopes. The dynamic collision interaction of the inner fast tenuous wind with the outer slow AGB wind envelope is well taken into account by including forward and reverse shocks and contact discontinuity in LZ. As an illustrating example of PN application, isothermal self-similar void (ISSV) solutions of LZ appear sensible in fitting the available data of the PN NGC 7662.
Diffuse X-ray emissions due to spectral line cooling of highly ionized metals (e.g. Kastner et al. 2000; Yu et al. 2009) and probably partial thermal bremsstrahlung from hot electrons reveal important inner morphological features of PNe, i.e. the region enclosed within the dense shell. A powerful reverse shock can heat up the inner tenuous fast wind plasma on the downstream side within an estimated temperature range of K (e.g. Volk & Kwok 1985; Akashi et al. 2006; Leahy et al. 2000; Stute & Sahai 2006) and create a reverse shock heated ‘hot bubble’ largely confined by the outer dense shell at an expanding contact discontinuity. For this overall physical scenario, properties of diffuse X-ray emissions are mainly determined by the temperature, density, velocity and mass loss rate of the shocked inner wind. As a result, it offers unique insight for the shaping processes of PNe and their central hot bubbles.
In the past decade, advanced instruments in space allow us to detect diffuse X-ray emissions from PNe. Together with complementary observations for dense shells of PNe in optical and infrared bands, we are now able to test the wind-wind dynamic shock interaction scenario on more specific terms. X-ray emissions from three PNe were detected with ROSAT spacecraft (e.g. Stute & Sahai 2006), and from nine PNe with Chandra and XMM-Newton X-ray Observatories (e.g. Kastner et al. 2000, 2001, 2003; Chu et al. 2001; Guerrero et al. 2002, 2005; Sahai et al. 2003; Montez et al. 2005; Gruendl et al. 2006). With sufficiently high spatial and energy resolutions as well as detector sensitivity, Chandra and XMM-Newton spacecraft observations allow us to study the extended spatially resolved X-ray structure of PNe, which provide an unprecedented opportunity to examine the wind-wind dynamic interaction scenario.
Akashi et al. (2006) qualitatively calculated the morphology of X-ray emissions from PNe based on the adiabatic self-similar colliding wind solutions for shocked fast wind flows of Chevalier & Imamura (1983)without self-gravity and showed that the X-ray emission appears in the form of a narrow ring inside the optically bright part of a PN. This was suggested to be the case of NGC 40 by Montez et al. (2005). Akashi et al. (2007) investigated X-ray emissions from PNe by numerical simulation of adiabatic winds without gravity. They found that in order to explain the observed PNe X-ray properties, a rapidly decreasing mass loss rate is required. The adiabatic colliding wind models of Chevalier & Imamura (1983) and Akashi et al. (2007) both indicate that X-ray emissions become brightest very near the dense shell. Therefore, PNe with central luminous X-ray emission profiles cannot be accounted for by their adiabatic colliding wind models. Chevalier & Imamura (1983) also included an isothermal dense shell in their model, in addition to the innermost and outermost stationary isothermal winds.
Recent observations reveal that diffuse X-ray emissions from PNe do generally lie within the interior of the optically bright shells of relatively dense ionized gas, such as PN BD +30∘3639 (e.g. Kastner et al. 2000; Yu et al. 2009), NGC 40 (e.g. Montez et al. 2005) and NGC 2392 (e.g. Guerrero et al. 2005). From PN BD +30∘3639, ROSAT spacecraft instrument discovered a Gaussian-shape diffuse X-ray emission source (e.g. Leahy et al. 2000). With a high spatial resolution of , Chandra spacecraft well resolved this compact X-ray emission source and found a quasi-spherical central bright diffuse X-ray emission blob embedded inside the optical bright shell, with a radius . The X-ray photon flux from the centre is times more intense than that from (e.g. Kastner et al 2000). Moreover, Chandra also found the X-ray bright centre was slightly concentrated towards the east side. Different from PN BD +30∘3639, PN NGC 40 shows a distinct annulus X-ray emission e.g. Montez et al. 2005). For those PNe of bipolar morphologies that do not clearly present shell-like structures, their diffuse X-ray emissions are also from within the optically bright shells, such as NGC 7027 (e.g. Kastner et al. 2001), NGC 7009 (e.g. Guerrero et al. 2002) and NGC 6543 (e.g. Chu et al. 2001), NGC 7026 (e.g. Gruendl et al. 2006) and Menzel 3 (e.g. Kastner et al. 2003). These X-ray observations bear strong implications that wind-wind dynamic interactions or jet-wind interactions are most likely responsible for the inner diffuse X-ray emissions from PNe (e.g. Kastner 2007).
This paper establishes a quantitative connection of self-similar piecewise isothermal dynamic evolution model of PNe with diffuse X-ray emissions, especially the radial distribution of surface brightness. On the basis of LZ global ISSV model for the self-similar evolution of PNe, we show that three key model parameters determine the morphology for diffuse X-ray emissions from PNe and specifically examine observations of PN NGC 40. In our piecewise isothermal model framework, either ring-like or central bright X-ray morphologies are possible because X-ray emission peaks near the reverse shock instead of the contact discontinuity. Our results lend support to the wind-wind dynamic interaction model for PNe in general. We also compute the luminosity, surface brightness of X-ray emission from the PN 7662 and emphasize that this PN should be a highly desirable target source for Chandra further X-ray observations in the near future.
2 A spherical wind-wind dynamic interaction model for Planetary Nebulae with self-similar shells
In this section, we first describe our global piecewise isothermal dynamic evolution model for quasi-spherical PNe. At the late stage of stellar evolution, a star enters the AGB phase. During this phase, a star suffers from a rather high rate of mass loss M yr-1 and thus creates a fairly dense AGB wind shell expanding at a slow radial speed of km s-1 (e.g. Kwok et al., 1978; Chevalier & Imamura, 1983; Chevalier, 1997, LZ). The dense gas shell keeps expanding until the stellar hydrogen envelope has been almost depleted and a compact hot white dwarf gradually exposed at the centre. Meanwhile, a hot tenuous fast wind somehow emerges from the central white dwarf as indicated by observations. This tenuous fast wind blows at a high speed of km s-1 with a mass loss rate of M yr-1 (e.g. Cerruti-Sola & Perinotto 1985). This fast inner wind will not diffuse through the outer AGB slow wind, but smash onto the outer dense AGB wind shell (e.g. Kwok et al. 1978) and then give rise to a forward shock propagating outwards into the slow AGB wind and a reverse shock propagating inwards in the fast wind comoving framework of reference (e.g. Chevalier & Imamura (1983); Akashi et al. 2006). A contact discontinuity naturally forms when the gas pressures of fast wind and of AGB wind reach a dynamic balance with both density and temperature being different on the two adjacent sides. These two shocks, especially the forward shock, rearranges the distribution of gas flow and finally results in a dense shell surrounding the central compact star blowing an inner fast wind (e.g. Kwok 2000; LZ).
A quasi-spherical PN may be roughly divided into four regions (see figure 1 of Akashi et al. 2006). The fast wind occupies the inner region from the central compact white dwarf to the reverse shock front at radius . When propagating inwards relative to the fast wind, the reverse shock heats up and slows down the inner wind and creates a downstream wind region from the reverse shock front to the expanding contact discontinuity at radius . These two regions form the inner zone and are characterized by the fast wind mass loss rate, wind velocities, densities, temperatures and reverse shock speed. The shocked dense shell region stays between the contact discontinuity and the forward shock at radius . The fourth region, or the outer AGB slow wind envelope, expands outside the forward shock front at a low speed of km s-1. As in LZ, we adopt spherically symmetric nonlinear hydrodynamic partial differential equations (PDEs) in spherical polar coordinates to model the piecewise isothermal gas dynamics of these four wind regions of a quasi-spherically symmetric PN.
2.1 Inner Shocked Tenuous Wind Zone
Featuring a Reverse Shock
As already noted, a reverse shock emerges and propagates in the inner fast wind zone due to the collisional interaction between the later fast and earlier slow winds. The mass and radial momentum conservations across an isothermal shock front in the shock comoving framework are simply
| (1) |
where is the isothermal sound speed, is the mass density and is the radial flow velocity, and the two subscripts d and u denote the downstream and upstream sides of an isothermal shock and the subscript indicate association with the shock (e.g. Courant & Friedrichs, 1976; Spitzer, 1978; Shen & Lou, 2004; Bian & Lou, 2005; Yu et al., 2006, LZ). The temperature ratio across such a shock front is another parameter to be specified (see Shen & Lou, 2004). The reverse shock travels inwards relative to the inner wind, so the inner fast wind region is the upstream side of the shock and the reverse shock heated wind occupies the downstream side until the contact discontinuity at the expanding radius . In the laboratory framework of reference, a reverse shock may move inwards or outwards, or appear stationary in space depending on various specific situations (e.g., Lou, 1996, 1998).
We presume a constant mass loss rate for an isothermal inner fast wind and define , , and as the isothermal sound speed, constant temperature, mass density and constant wind velocity on the downstream (upstream) side of the reverse shock. The sound speed ratio across the shock front characterizes the downstream plasma heating of the reverse shock. Isothermal shock conditions (1) then give
| (2) |
where is the reverse shock velocity in the laboratory reference framework (LZ). Calculations show that positive, negative and zero are all physically allowed. For , the inner fast wind region shrinks radially inwards until a certain epoch. In other words, the reverse shock heats up the downstream wind plasma and leads to a hot bubble inside the contact discontinuity surface at an expanding radius .
The mass density profile within the central fast wind zone is simply
| (3) |
and that in the reverse-shocked downstream wind zone is
| (4) |
which remains steady, where the constant parameter is explicitly defined. This last approximation highlights that the downstream density of shocked inner wind does not sensitively depend on the inner fast wind speed because we typically have a small speed ratio of . Due to the reverse shock, the downstream mass loss rate just inside the contact discontinuity surface is given by
| (5) |
which is equal to the central mass loss rate only when the reverse shock remains stationary in the laboratory reference framework. The difference between and is the mass loss rate at the reverse shock front due to the reverse shock movement.
X-ray observations in the past several years appear to indicate that the temperatures of inner shocked fast wind, where X-ray photons are released, are a factor of lower than that predicted by simple energy conservation arguments (e.g. Soker & Kastner 2003). In our formulation, we use a chosen sound speed ratio to bridge the two constant temperatures of upstream and downstream sides across a moving reverse shock.
2.2 The Dense Shell Region and the
Outer AGB Slow Wind Envelope
The shocked dense shell region and the outer AGB slow wind envelope separated by an outgoing forward shock are described by the ISSV model of LZ. The piecewise isothermal hydrodynamic equations with spherical symmetry are the mass conservation
| (6) |
or equivalently,
| (7) |
and the radial momentum equation
| (8) |
where is the radial bulk flow speed; is the enclosed mass within radius at time ; is the mass density; is the isothermal sound speed; is the constant gas temperature; is the mean particle mass; is the gas pressure, is Boltzmann’s constant and cm(g s2) is the gravitational constant.
By the known isothermal self-similar transformation
| (9) |
equation (6) leads to
| (10) |
and then PDEs (7) and (8) reduce to two coupled nonlinear ordinary different equations (ODEs)
| (11) |
| (12) |
where , , are the dimensionless reduced variables corresponding to mass density , enclosed mass and radial flow speed , respectively (Shu, 1977; Hunter, 1977; Whitworth & Summers, 1985; Tsai & Hsu, 1995; Shu et al., 2002; Lou & Shen, 2004; Shen & Lou, 2004; Bian & Lou, 2005; LZ, 2009). Given proper analytic asymptotic solution conditions at large and small as well as in the neighborhood of the sonic critical point, these two coupled nonlinear ODEs (11) and (12) can be solved in a straightforward manner. Each dimensionless ISSV solution of these two ODEs gives a behaviour of the dense shell and outer AGB wind envelope outside .
The forward shock travels outwards in a self-similar manner and divides the shell into the shocked dense shell region and the outer slow AGB wind envelope. We define , , and as the sound speed, temperature, reduced mass density and reduced gas radial flow velocity on the downstream (upstream) side of the forward shock and the sound speed ratio (Shen & Lou, 2004; Bian & Lou, 2005; Yu et al., 2006, LZ). In this case, the dense shell region is the downstream side and the outer slow AGB wind envelope is the upstream side of the outgoing forward shock front. We define dimensionless variables and where is the radially outgoing velocity of the forward shock in the laboratory reference framework. Then isothermal shock conditions (1) bear the self-similar form of
| (13) |
(Shen & Lou 2004). These isothermal shock jump conditions connect the AGB outer wind envelope with the dense shell region across the forward shock front.
The analytic asymptotic solution of coupled nonlinear ODEs (11) and (12) at large is known as
| (14) |
where and are the velocity and mass parameters (Lou & Shen 2004; LZ). In our self-similar piecewise isothermal model framework, these two parameters characterize the asymptotic massive AGB wind velocity as
| (15) |
at very large and a constant AGB wind mass loss rate as
| (16) |
These asymptotic relations are used to constrain the range of model parameters for PNe.
2.3 Radial Expansion of the Spherical
Contact Discontinuity Interface
The contact discontinuity surface at expands at a constant speed and separates the inner and outer zones. LZ estimated that the gravity of inner tenuous wind zone may be negligible during the dynamic self-similar evolution of the dense shell region and outer AGB envelope in outer zone. By letting in equation (10), we then obtain the contact discontinuity surface radius and its expansion velocity . By doing this, we ignore the self-gravity from the inner shocked wind region within the contact discontinuity radius , but still retain the self-gravity of the dense shell and the AGB slow wind envelope outside the contact discontinuity radius . A contact discontinuity requires that the inner downstream wind velocity and the outer dense shell gas velocity at be equal to the contact discontinuity expansion velocity, namely
| (17) |
which is satisfied automatically when occurs. Here, is where an ISSV solution for the dense shell region and the outer envelope starts. Given a proper set of , one can readily integrate coupled nonlinear ODEs (11) and (12) from to larger (i.e. from left to right), apply self-similar shock jump conditions (13) at to cross an outgoing forward shock front once and are known and then continue further from to sufficiently large to determine velocity and mass parameters and with desired accuracies. The flow zone between the contact discontinuity and the forward shock is the dense downstream side and the outer AGB slow wind is the upstream side. The forward shock jump condition connects and . These solutions have a negligible mass within and are referred to as ISSV solutions by LZ. In total, eight parameters are involved for constructing a model ISSV solution , with five of them being actually independent.
At radius of contact discontinuity, the inner downstream wind plasma pressure is
| (18) |
where is the mean particle mass of the inner downstream wind zone. With self-similar transformation (9), we have the shocked dense shell gas pressure at the contact discontinuity radius as
| (19) |
where is the mean particle mass of the shocked dense shell zone. To physically maintain an expanding contact discontinuity at constant speed, the parameters , , , , , and are coupled by the pressure balance condition across the contact discontinuity, namely
| (20) |
In general, the two mean particle masses and are allowed to be different depending on specific situations.
2.4 Comparison with Previous Models of PNe
Chevalier & Imamura (1983) and LZ both invoke a self-similar hydrodynamic wind-interaction phase to explore the global dynamic shock evolution of PNe. In both models, the inner and outer wind zones are characterized by different yet constant mass loss rates.
More specifically, in the model of Chevalier & Imamura (1983), the innermost fast wind zone and the outermost AGB slow wind envelope are both isothermal and expand at constant speeds with both mass densities scaling as . In between these two wind regions, both shocked downstream wind zone and dense shell are solved separately by adopting a type of adiabatic self-similar transformation for hydrodynamic PDEs without gas self-gravity (Parker 1961). These two self-similar dynamic zones are joined by the pressure balance across an outgoing contact discontinuity. Two different Mach numbers are specified respectively for the reverse shock separating inner fast wind and self-similar shocked downstream wind zone (hot bubble), and for the forward shock separating self-similar dense shell and outer slow AGB wind envelope.
In comparison, LZ model also presumes a density profile for a steady piecewise isothermal fast wind zone in the central region around the remnant white dwarf. Differently, the dense shell and the outer AGB slow wind envelope are described by a self-similar dynamic solution with self-gravity and an isothermal shock jump (i.e. type self-similar solutions of LZ). The self-similar process here differs from that of Chevalier & Imamura (1983) in (a) the inclusion of self-gravity; (b) the piecewise isothermal wind (both the dense shell and the outer AGB slow wind envelope are isothermal but with different temperatures); (c) a different self-similar transformation due to the presence of self-gravity and (d) necessary shock parameters (forward shock is described by its velocity and sound speed ratio or temperature jump parameter ). In the inner shocked downstream wind zone, LZ model has constant temperature and wind speed. For a constant mass loss rate , both mass density and thermal gas pressure scale as .
In the inner shocked downstream wind zone and the dense shell, LZ piecewise isothermal model behaves differently from adiabatic self-similar solutions of Chevalier & Imamura (1983). For Chevalier & Imamura solution of colliding winds, mass density and pressure in both downstream zones (i.e., the inner shocked downstream wind and the dense shell) are lowest near the shock fronts and highest near the contact discontinuity where strong shocks were initiated. Under weak shock condition, density behaves similarly but pressure is no longer monotonic, which may lead to Rayleigh-Taylor instability (e.g. Chevalier & Imamura, 1983). Several isothermal cases with for the dense shell are also calculated by Chevalier & Imamura (1983) to find that both density and pressure peak at the forward shock front, instead of at the contact discontinuity, which is qualitatively similar to LZ solutions for the dense shell. Another difference is the behaviour of AGB envelopes. In LZ model, both velocity and mass loss rate of AGB envelopes approach constant at large radii.
Based on Chevalier & Imamura (1983) adiabatic solution for inner shocked fast wind, Akashi et al. (2006) find the morphology of the X-ray emission is in the form of a narrow ring just inside the optical bright part of a PN (i.e. dense shell). However, simulation shows that the velocity of reverse shock and contact discontinuity cannot stably remain constant (Akashi et al. 2007). This might be related to the Rayleigh-Taylor instability for some adiabatic solutions of Chevalier & Imamura (1983). Akashi et al. (2007) also find that in order to get more realistic simulation results, a rapidly decreasing mass loss rate of inner fast wind is required. In this case, the density should be no longer increasing from the reverse shock to the contact discontinuity. For Chevalier & Imamura isothermal solutions and for LZ model, mass densities increase monotonically from the contact discontinuity to the shock front. A physical consequence is that near the reverse shock gas is brighter in X-ray emissions than near the contact discontinuity.
For a PN, both forward and reverse shocks are radiative (e.g. Chevalier & Imamura, 1983). The central hot white dwarf can be a strong source of photoionizing radiation and may completely photoionize the outer dense shell (e.g. Chevalier 1997; LZ). Therefore, in reality, the hot bubble and dense shell should involve gas dynamics between adiabatic and isothermal processes (say, a polytropic description as an approximation).
3 Diffuse X-ray Emissions from PNe
The reverse shock initiated by the collision of an inner fast tenuous wind with ambient dense gas materials previously blown out during the AGB slow wind phase heats up the inner downstream wind region, leading to spectral line emissions from highly ionized metals such as C, O, Ne in X-ray bands (e.g. Volk & Kwok 1985; Akashi et al. 2006; Leahy et al. 2000; Stute & Sahai 2006; Yu et al. 2009). In contrast, temperatures of the shocked dense shell and of the outer AGB wind envelope are only in the order of K (e.g. Guerrero et al., 2004; LZ), and that of the central hot white dwarf is K (e.g. Werner et al. 2008). Consequently, X-ray emissions from PNe would be mainly produced in the inner shocked downstream wind region with a higher temperature. In this scenario, X-ray emissions from PNe projected in the plane of sky should largely lie within the expanding contact discontinuity of radius .
According to LZ, the typical electron number density in the dense shell zone is estimated as yr cm-3, where is the typical age of a PN, and the thickness of a dense shell zone is estimated as yr) cm. Then the mean free path of a photon in the dense shell zone would be yr cm, where cm2 is the electron cross section for Thomson scattering. Therefore the dense gas shell should be optically thin for emissions of X-ray photons during the evolution of a PN. We denote the X-ray emissivity of the shock heated downstream inner wind plasma by such that is the energy emitted per unit time per unit volume, where is the proton number density (e.g. Sarazin 1986). At the temperature range of K when spectral line emissions from highly ionized metals are important, a simple approximation is thus ergs cm-3 sec-1 (e.g. Sarazin 1986). The X-ray luminosity of a PN can then be calculated by integrating the emissivity over the entire shocked downstream inner wind region, viz.
| (21) |
where is the proportion of gas mass density to proton number density. For a H II region, we simply have , while for gas with a helium abundance of HeH by number. Defining the X-ray parameter , we readily obtain the following expression
| (22) |
A normalized X-ray surface brightness profile can be calculated by integrating over the X-ray luminosity along the line of sight. Let be the projected radius from the centre of a grossly spherical PN, we have the X-ray surface brightness radial profile as
| (23) |
By introducing a dimensionless function defined as
| (24) |
we immediately arrive at the following expression
| (25) |
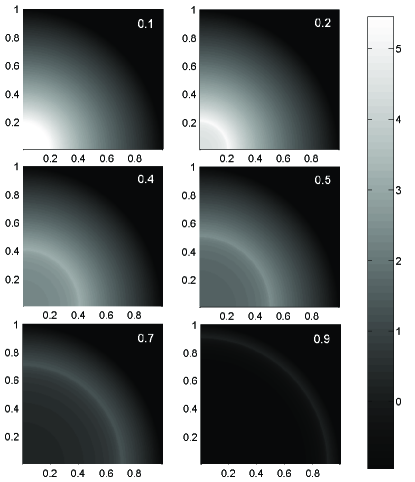
Figures 1 and 2 illustrate several model PN X-ray brightness profiles marked with different values of radius ratio within the range for this normalized reverse shock radius . We emphasize that morphologies of such diffuse X-ray emissions from PNe are determined by this radius ratio . The case of close to unity corresponds to a ring-like brightness profile (e.g. the case of PN NGC 40), while a small gives a more spherical appearance for the X-ray surface brightness radial profile with a more luminous central bulge or sphere (e.g. the case of PN BD +30∘3639).
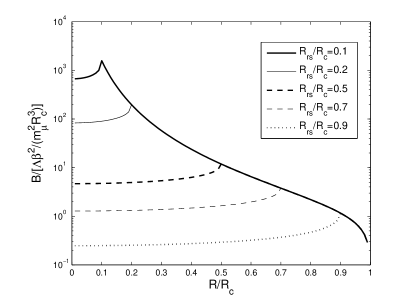
Both X-ray luminosity and surface brightness radial profile depend only on the X-ray parameter and radius ratio for reverse shock and contact discontinuity. The X-ray parameter is a function of (or inner shocked downstream wind plasma temperature ), and while parameter is further determined by the mass loss rate from the central white dwarf, reverse shock speed , inner fast wind velocity and shocked downstream wind velocity according to expression (4). As the inner radius of the dense shell, the contact discontinuity radius can be measured using observations in optical and infrared bands (e.g. Kastner et al 2000; Guerrero et al 2004; Montez et al. 2005). Parameters and can be inferred by fitting an X-ray surface brightness radial profile and the estimate of total X-ray luminosity of a PN. Spectral analysis can measure the innermost fast wind velocity, dense shell gas velocity111Relation (17) indicates that the dense shell gas velocity also gives the inner shocked downstream wind velocity as required by the pressure balance across an expanding contact discontinuity radius . and temperatures (four in all) in the inner and outer zones (e.g. Guerrero et al 2004; Montez et al. 2005). Pressure balance condition (20) across the expanding contact discontinuity radius further connects physical parameters in the inner shocked downstream wind region and the dense shell. We emphasize that combined observations in infrared, optical and X-ray bands may be utilized to infer all relevant parameters that characterize a quasi-spherical PN.
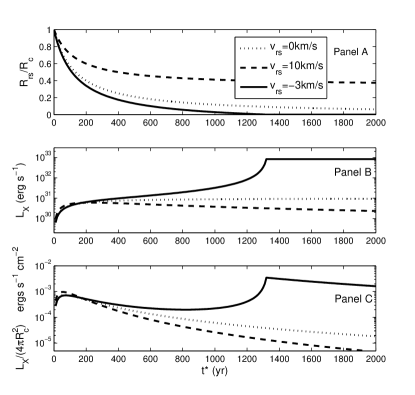
The morphology of diffuse X-ray emission from a PN only depends on the radius ratio (see Figs. 1 and 2). Thus the time evolution of this radius ratio determines how the X-ray morphology evolves with time . In other words, different epochs of PN evolution may be invoked to explain why some PNe are observed to be strong X-ray sources while others are not. Here, we present straightforward calculations to show the relation between the physical evolution state of PNe with their diffuse X-ray emission morphologies. Suppose the contact discontinuity surface has a radius at the time when the central fast wind collides with the slow dense AGB wind envelope. Let be the time lapse from when the time forward and reverse shock pair initiated after a wind-wind collision to the current epoch. We may use and to estimate a kinematic timescale and regard this timescale as the dynamic age of a PN (see self-similar transformation equation 9 above). It follows that roughly represents the temporal duration that the central star has depleted its hydrogen envelope but not yet started to launch a fast hot tenuous wind. Then the radius ratio evolves with time as
| (26) |
At the moment that wind-wind collision occurs and both forward and reverse shocks are initiated, the radius ratio and no diffuse X-ray is emitted (see eqn. 22). If PNe are identified around this stage, then there would be no or very weak X-ray emissions. The time evolution of is mainly determined by according to expression (26). If is nonnegative, then this radius ratio has a limiting value of in the long term evolution for a large (see Fig. 3) during which the initial contact discontinuity radius becomes less important. Otherwise, when the reverse shock travels radially inwards, the region inside the contact discontinuity surface tends to be filled with more shock heated downstream wind plasma. Meanwhile, gravity, magnetic field and radiation of the central star at the shrinking radius of the reverse shock will eventually become sufficiently strong, and neither asymptotic central wind profile nor shock condition (1) is reliable any more. We will show presently that the energy conservation actually forbids .
We now consider this problem from the perspective of energy conservation. The inner fast wind kinetic energy and thermal energy input per unit time
| (27) |
should be larger than the kinetic and internal energy increase of the system when X-ray is emitted. The internal energy change rates of fast wind zone and shocked fast wind zone are
| (28) |
respectively. The kinetic energy change rate caused by the reverse shock in the inner wind is
| (29) |
The power of the shocked downstream wind zone (hot bubble) pushing the dense shell outwards is
| (30) |
Given typically estimated parameter values of a PN km s-1, km s-1, km s-1, km s-1 and km s-1 as inferred by LZ, we find that
| (31) |
The energy conservation then requires that
| (32) |
Energy conservation requirement (32) must be necessarily met. Using expression (22), we find that equation (32) limits the possible range of the hot bubble temperature and the reverse shock radius . As the X-ray luminosity approaches the upper limit , either the cooling becomes dominantly important so that the temperature drops rapidly, or the reverse shock radius can no longer shrink. However, in reality, it is unlikely that X-ray emissions from the hot bubble reach the upper limit because cooling effects would become extremely important before . In the above discussion, we have ignored the gravitational potential energy change rate of the shocked downstream zone occupied by the hot bubble.
Fig. 3 illustrates how the radius ratio , the total X-ray luminosity and the average surface brightness of PNe evolve with negative, zero and positive reverse shock velocities . While all three conditions give decreasing radius ratio in general, the temporal evolution of total X-ray luminosity and average surface brightness differ from each other significantly. In the case of km , the reverse shock radius stops at au as required by energy conservation (32). We will show presently that for both PNe NGC 40 and NGC 7662, X-ray emissions only take up of the inner fast wind energy input. Calculations show au when reaches of , viz. erg s-1. This appears consistent with the earlier estimate of Frankowski & Soker (2009).
4 Observations of sample PNe
4.1 Planetary Nebula NGC 40
NGC 40 (PNG120.0+09.8; Acker et al. 1992) is a very low excitation PN powered by a WC8 star evolving towards a white dwarf. Within a ring of nebulosity revealed by optical and near-infrared images of NGC 40, Montez et al. (2005) detected faint, diffuse X-ray emission distributed as a partial annulus using the data from the Chandra X-Ray Observatory (ObsID 4480). This annulus-like X-ray profile corresponds to a fairly large ratio of and thus a low X-ray luminosity (see equations 22 and 25 and Figs. 1 and 2). The actual inferences are X-ray temperature K and total luminosity kpc ergs s-1 of NGC 40 (Montez et al. 2005). Kastner et al. (2008) reprocessed the X-ray data of NGC 40 and updated the luminosity value to erg s-1 which is adopted in our model calculations. The X-ray temperature and luminosity are one of the lowest measured so far for PNe with diffuse X-ray emissions. Here, the distance to NGC 40 kpc is estimated by Leuenhagen et al. (1996).
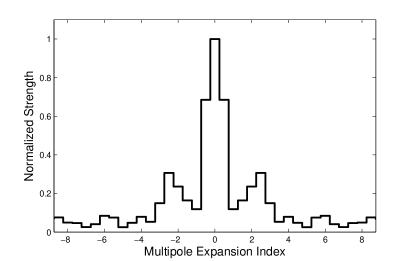
We decompose the X-ray counts distribution in terms of cylindrical harmonics in polar coordinates in the plane of sky and demonstrate the resulting multipole spectrum in Figure 4 above. This spectrum reveals a strong polar uniform component (multipole index ) and a distinct dipole component (multipole index ) which is about one third times as strong as the uniform component. While being somewhat crude, this suggests an exploration for the X-ray brightness radial profile of NGC 40.
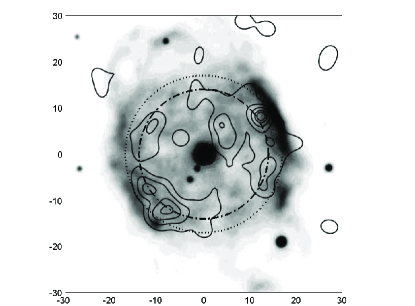
The observed X-ray brightness radial profile of NGC 40 is displayed in Fig. 5 (i.e.the open circles with error bars). We assume a uniform X-ray emission background approximately and fit our PN model results (i.e. the dotted curve in Fig. 5) with the observed data profile. The best-fit model gives a radius ratio of and an X-ray parameter kpc ergs s-1 cm. By equation (22), these results further lead to an X-ray luminosity from NGC 40 as kpc ergs s-1, consistent very well with the observational inference (e.g. Kastner et al. 2008). The model fit also gives a reverse shock radius kpc cm and a contact discontinuity radius kpc cm, corresponding to the peak and boundary of diffuse X-ray emissions from shocked hot bubble. In Figure 6, we circle these model-fitted and on the optical and X-ray composite image of PN NGC 40. By visual inspection, does pass through the X-ray brightest region and roughly marks the boundary of the diffuse X-ray emission. LZ piecewise isothermal model claims that the optically bright PN rim is located just outside the contact discontinuity radius and the density becomes highest near the forward shock radius . Figure 6 indicates that the forward shock is just outside the contact discontinuity surface so that the optical bright dense shell is very thin, i.e. . According to the spectral analysis of Sabbadin et al. (2000), the most optically luminous shell region of NGC 40 still have redshift and blueshift componeonts at radius , implying . Figure 6 shows that our model fits observation very well. The radial separation between the most optically bright radius at and the most X-ray bright radius at is clearly distinguishable, strongly supporting LZ piecewise isothermal model. In contrast, the adiabatic model of Chevalier & Imamura (1983) would claim no significant separation between these two radii (e.g. Akashi et al. 2006).
The best-fit Raymond-Smith thermal plasma emission model (Raymond & Smith 1977) with the X-ray spectrum of NGC 40 indicates a plasma temperature of K (Montez et al. 2005); at such temperature, the spectral line cooling from highly ionized metals is important while the thermal bremsstrahlung emission from free hot electrons is relatively weak, and the total X-ray emissivity is ergs cm3 s-1 (e.g., Sarazin 1986). With , we have M⊙yrkm s by expression (4). We adopt km s-1 as estimated by optical spectrum line analysis near the contact discontinuity surface (e.g., Sabbadin et al. 1999). Ignoring the duration that the central star stopped to blow slow AGB wind and not yet began to launch tenuous fast wind, we estimate a wind-wind dynamic interaction timescale of yrs (a comparable timescale of yrs was estimated by Akashi et al. 2006). For the radius ratio , we have km s-1. Thus the reverse shock moves outwards in the laboratory framework of reference. Meanwhile, equation (2) gives an inner tenuous fast wind speed km s-1. Equation (4) gives a central star mass loss rate as M⊙yr-1, which is very close to an earlier estimate of Myr-1 by UV spectral analysis, and falls within the estimated range of Myr-1 (e.g., Cerruti-Sola & Perinotto 1985). By imposing condition (20), the diffuse X-ray emission from the central zone of PN NGC 40 requires a K for the outer shocked dense shell. We note that the X-ray emission only takes up of for PN NGC 40.
However, our best-fit model in Fig. 5 overestimates the X-ray brightness for smaller radii around the center. In LZ model, the temperature of the dense shell region is not high enough to radiate in X-ray bands. In reality, thermal conduction inevitably occurs across the contact discontinuity so that the dense shell region will be heated up by inner shocked downstream wind and may lead to partial X-ray emissions. The inner shocked downstream wind zone near the contact discontinuity surface would also become denser and cooler due to diffused materials and thermal conduction from the dense shell, especially if magnetic field is absent (e.g., Steffen et al. 2008). This effect would lead to a relatively higher X-ray flux than our model result around the outer boundary of the hot bubble. Nevertheless, this thermal conduction is expected to be sensitively suppressed even for the presence of a weak magnetic field transverse to the radial direction (e.g., Chevalier 1997; Yu et al. 2006; Wang & Lou 2008; Lou & Hu 2009; LZ), so the total X-ray luminosity of PNe is more or less confined to emissions within radius . Within the radius of arcsec or cm or au around the central region, X-ray brightness of our model is greater than the upper limit of confidence interval of observation (see Fig. 5). Since the reverse shock is at within which there is no diffused X-ray emission, the projected X-ray photons within radius are actually emitted in the hot bubble at larger radii closed to but projected around the center along the line of sight. If there is a dense dust cloud surrounding the central star, the X-ray photons emitted behind the cloud might be partially absorbed so that the observed central X-ray brightness becomes lower than expected. Both theoretical calculations (e.g., Frankowski & Soker 2009) and observations show that dense gas/cool dust clouds may exist around the central white dwarf of PNe with diameter au (e.g. Helix nebula, dust density g cm-3 by Su et al. 2007). The cross section of such a dust cloud is about au2, which can only obscure X-ray emission within au radius maximally. If this is the case for PN NGC 40, Figure 5 requires a column electron number density of cm-2 within to absorb X-ray emissions behind central star by Thomson scattering. Such a high column density corresponds to a total cloud mass . We thus conclude that X-ray absorption by either dust or gas cloud cannot explain the unusually low X-ray brightness in the central NGC 40. Alternatively, the non-spherical structure of NGC 40 might be the most important factor.

The dipolar structure of the X-ray brightness is noticeable in PN NGC 40. Also, the eastern X-ray region is brighter and seems to be more confined to within the brighter optical rim. As a first approximation, our spherically symmetric treatment modelling here ignore these asymmetries.
4.2 Planetary Nebula NGC 7662
NGC 7662 appears to be a quasi-spherical PN with a moderately large diameter of or cm and with optical surface brightness but without X-ray data available up to the present. Guerrero et al. (2004) probed the structure and kinematics of NGC 7662 based on long-slit echelle spectroscopic observations and on Hubble Space Telescope (HST) archival narrow-band images. They inferred that PN 7662 consists of a central cavity surrounded by two concentric shells, viz. the shocked dense shell and the outer slow AGB wind envelope, and estimated the temperatures of the two shells as K and K, respectively. By fitting the radial density profiles of the dense shell zone (see figure 13 of LZ) and the slow AGB wind envelope with the self-similar dynamic evolution model of LZ for isothermal voids, LZ estimated relevant physical parameters for PN NGC 7662 which appear consistent with optical observations (e.g., Guerrero et al. 2004). LZ have also inferred properties of the inner fast wind by imposing condition (20) for the pressure balance across the contact discontinuity. Shocked downstream inner wind velocity km s-1 was inferred by the outer dense shell expansion. The innermost fast wind mass loss rate yr-1, the inner fast wind speed km s-1, the hot bubble (i.e. shocked downstream inner wind zone) plasma temperature K and the reverse shock velocity km s-1 represent a plausible set of fitting parameters that can reproduce a PN with more or less the same outer zone of NGC 7662. At the current stage of evolution, we have estimated the two radii cm and cm, i.e. the radius ratio is fairly small. Equation (4) gives the value as Myrkm s. The total X-ray emissivity is ergs cm3 s-1 for a plasma of temperature K (e.g., Sarazin 1986). For , we then have an X-ray parameter ergs s-1 cm. This would give a total X-ray luminosity of NGC 7662 as ergs s-1. In short, we predict that an X-ray surface brightness like the upper-left plot of Fig. 1 with no distinct reverse shock surface and a total X-ray luminosity similar to that of NGC 40 is anticipated for NGC 7662, which should be detectable by the Chandra X-Ray Observatory in space.
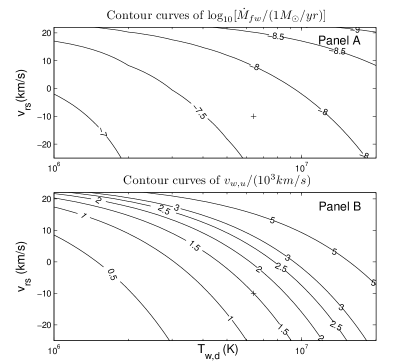
However without available X-ray observations of NGC 7662, physical conditions of its inner wind zone confined within the contact discontinuity radius of the PN NGC 7662 cannot be uniquely determined at this stage of model analysis. In other words, in terms of fitting available observations of NGC 7662 in other bands (e.g. optical, infrared bands and so forth), we can predictively explore X-ray emissions from the inner shocked downstream wind plasma of NGC 7662. In the above procedure, the innermost fast wind mass loss rate is a key yet adjustable parameter and may vary within a sensible range. We now show the corresponding ranges of our model results for NGC 7662 in Figs. 7 and 8. In fact, the LZ ISSV model solution with a parameter set km s-1, K, yr-1, km s is only one of the plausible inner shocked wind solutions that meet pressure balance condition (20) across the contact discontinuity. By systematically varying the inner downstream shocked wind temperature and the reverse shock speed , we readily derive different innermost fast wind velocities by equation (2) and the mass loss rates of the central star by wind pressure balance condition (20) across the contact discontinuity as shown in Fig. 7. To be specific, we pick a solution example marked by the plus symbol in Figure 7.
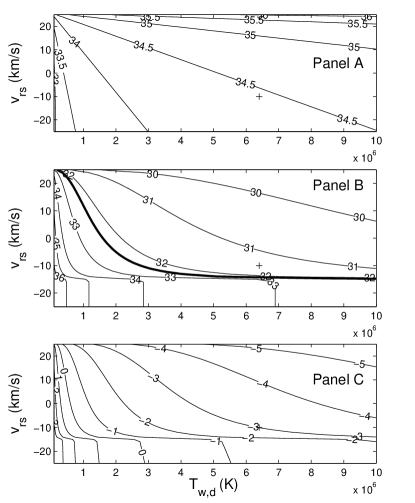
Figure 8 presents the upper limit of X-ray luminosity , the predicted X-ray luminosity by equation (22) and the ratio between these two quantities. The PSPC ROSAT count rate limit is s-1. If NGC 7662 is not detected in the ROSAT All Sky Survey (RASS), then webPIMMS (http://heasarc.gsfc.nasa.gov/Tools/w3pimms.html) puts the upper limit for the X-ray luminosity of erg s-1 (a typical hydrogen column number density cm-2 and a hot bubble temperature K are assumed for NGC 7662 at a distance of kpc; e.g. Guerrero et al. 2004). The heavy solid curve in Panel B of Figure 8 marks this upper limit and suggests a possible regime for both and at the upper right side of the curve. In the regime where K and km s-1, the ratio is less than . This estimate is also valid for PN NGC 40. Comparing Figures 7 and 8, we can also figure out that the mass loss rate M⊙ yr-1 and the fast wind velocity km s-1. These estimated results appear all consistent with previous observations and theoretical calculations.
5 Summary and Discussion
We invoke the recently constructed ISSV hydrodynamic model of LZ to explore the dynamic shock interaction of the inner isothermal fast wind with the outer AGB slow dense wind and to calculate diffuse X-ray emissions from grossly spherical PNe for available observational comparisons. Our piecewise isothermal wind dynamic interaction model involves a forward shock into the outer AGB slow wind envelope, a reverse shock into the inner fast tenuous wind and a contact discontinuity in between these two shocks. Different from previous dynamic model like Chevalier & Imamura (1983), LZ model indicates that the X-ray emission peaks near the reverse shock, instead of the contact discontinuity surface between the hot bubble and the PN dense shell. Based on Chevalier & Imamura model, Akashi et al. (2006) indicates that diffuse X-ray emissions from hot bubbles should be in the form of narrow bright rings. Our piecewise isothermal model calculations show that the morphology of diffuse X-ray emission is determined by the radius ratio such that either ring-like or central bright X-ray morphology can appear. According to our dynamic model analysis, a relatively small ratio is suggested for PN BD +30∘3639, where a centrally bright diffuse X-ray emission morphology persists (e.g. Leahy et al. 2000; Kastner et al. 2000). In contrast, an adiabatic evolution model of PN cannot give a morphology for central bright diffuse X-ray emissions. We would expect various morphological cases for a more systematic survey of PNe.
As current X-ray detectors in space have been powerful enough to observe extended X-ray morphologies of PNe, we offer quantitative line-of-sight X-ray brightness radial profiles for candidate PN sources. In our model framework, the X-ray parameter (defined in the main text), the reverse shock radius and the contact discontinuity radius together completely determine both the X-ray luminosity and the surface brightness profile. In perspective, X-ray observations together with optical and infrared images of grossly spherical PNe are expected to give specific measurements or estimates for these three key parameters.
The PN NGC 40 radiates intensely in UV bands, giving a valuable observational platform to test and calibrate our X-ray model results for diagnostics. The results of our piecewise isothermal dynamic wind interaction shock model are fitted well with observations except that the central X-ray brightness is somewhat higher than that actually observed as shown in Fig. 5. NGC 40 appears to have a radius ratio close to unity with a relatively low temperature of K in the inner shocked downstream wind plasma. These two facts result in a fairly low X-ray luminosity of ergs s-1 from NGC 40 (see Kastner et al. 2008 for this update). UV observations estimate a fast wind speed range of km s-1 (e.g., Cerruti-Sola & Perinotto 1985; Bianchi 1992). This is about twice our estimated fast wind speed km s-1. We also note that the dipolar structure of NGC 40 significantly affects the morphology of diffused X-ray emission. The actual hot bubble of NGC 40 is not very spherical, but in a dumbbell-like shape. Most X-ray photons are emitted from east and west regions, while only a few are from north, south or central regions. Observationally, spectral line analysis to the optical bright rims show that the dense shell gas expands at km s-1 in the north-south direction and at km s-1 in the east-west direction (e.g. Sabbadin et al. 1999). This indicates that the earlier AGB slow wind is denser in the east-west direction so that the collision between the inner fast wind and the slow AGB wind is more violent in the east-west region. This also explains why the dense shell is brighter in the east and west regions. By both quantitative calculation on spherical smoothing and qualitative analysis on dipolar structure, we conclude that wind-wind shock dynamic interaction appears natural for the hot bubble formation and diffused X-ray emissions.
Different from the PN NGC 40, the PN NGC 7662 is here inferred to have an inward reverse shock velocity of km s-1. By expression (22), NGC 7662 is predicted to have an increase of X-ray luminosity with increasing time at an estimated rate of erg s-1 per year. For example, its X-ray luminosity will reach ergs s-1 20 years later and ergs s-1 50 years later. Energy conservation shows a minimum exists so that must be limited by a maximum . In fact, studies on NGC 40 and NGC 7662 both lead to the conclusion that . The sensible explanation is that cooling effect becomes very significant even when is still far lower than this upper limit.
At the present epoch, it appears justifiable to not include cooling effects in our piecewise isothermal dynamic model calculations. Akashi et al. (2006) considered the radiative cooling semi-quantitatively for computing the X-ray luminosity based on the self-similar colliding adiabatic wind model of Chevalier & Imamura (1983) and showed that the radiative cooling was unimportant during most time of a PN dynamic evolution. Nevertheless, as radiative cooling becomes important for the hot bubble evolution, e.g. yrs later for the case of km s-1 in Figure 3, it would be inaccurate to compute X-ray emissions either in our model or in that of Akashi et al. (2006). The X-ray hot bubble will cool down much faster, the contact discontinuity balance condition would be broken and the outer dense shell dynamic behaviour may be also interrupted.
Since X-ray luminosity only takes up of , the energy conservation consideration in Section 3 implies that a significant amount of energy should have been converted to other forms during the entire life of PNe. Otherwise, the temperature of shocked downstream inner wind should be times higher than the observed temperature inferred from diffuse X-ray emissions. However, relatively low temperatures of X-ray emitting gas are generally inferred in PNe at different evolution stages. We note that the energy conservation calculation in Section 3 is fairly general, where we focus on the mass conservation and choose typical observed parameter values without specifically invoking either the isothermal or adiabatic assumptions. Therefore we suspect that there must be certain long lasting mechanisms to explain the low temperature of X-ray emitting gas, and such mechanisms are not quantitatively taken into account in either LZ piecewise isothermal model or the adiabatic model of Chevalier & Imamura (1983). Moreover, such mechanisms influence more than radiative cooling does so that shocked hot bubbles do not evolve adiabatically, as implied by the observation of central bright X-ray emission observation in PN BD +30∘3639. Thermal conduction and material diffusion might be non-negligible if the magnetic field near the expanding contact discontinuity surface becomes sufficiently weak. Another possibility is that the hot bubble largely between the reverse shock and the contact discontinuity becomes turbulent to partially account for the missing energy. The thermal conduction between hot bubble and cool dense shell could be considerable (e.g. Kastner et al. 2000; Steffen et al. 2008). The rapid variance of inner fast wind mass loss rate of central stars might also be essential to account for the imbalance between fast wind kinetic energy input and low temperature inferred by diffuse X-ray emissions (e.g. Soker & Kastner 2003; Akashi et al. 2007). In Sections 2 and 3, we did not consider such mechanisms; instead, we choose the shocked fast wind temperature (or ) as an adjustable parameter for fitting X-ray observations.
In some PNe with detected X-ray emissions, very distinct bipolar morphology appears, such as HENIZE 3-1475 (e.g. Sahai et al. 2003), NGC 7026 (e.g. Gruendl et al. 2006), MENZEL 3 (e.g. Kastner et a. 2003), and so forth. Collimated outflows and jets in magnetized gas media might be expected to account for these types of diffuse X-ray emissions. Akashi et al. (2008) performed two-dimensional numerical simulations of jets expanding into the slow wind of AGB stars. They proposed that this jet-wind or outflow-wind interaction model might explain such bipolar morphology of diffuse X-ray emissions.
6 Acknowledgement
This research was supported in part by the National Natural Science Foundation of China (NSFC) grants 10373009 and 10533020 at Tsinghua University, the SRFDP 20050003088 and 200800030071, the Yangtze Endowment, the National Scholarship and the National Undergraduate Innovation Training Project from the Ministry of Education at Tsinghua University and Tsinghua Centre for Astrophysics (THCA).
References
- Acker et al. (1992) Acker A., Ochsenbein F., Stenholm B., et al., 1992, Strasbourg-ESO Catalogue of Galactic Planetary Nebulae. ESO, Garching
- Akashi et al. (2008) Akashi M., Meiron Y., Soker N., 2008, New Astronomy, 13, 563
- Akashi et al. (2007) Akashi M., Soker N., Behar E., Blondin J., 2007, MNRAS, 375, 137
- Akashi et al. (2006) Akashi M., Soker N., Behar E., 2006, MNRAS, 368, 1706
- Bian & Lou (2005) Bian F.-Y., Lou Y.-Q., 2005, MNRAS, 363, 1315
- Bianchi (1992) Bianchi L., 1992, A&A, 253, 447
- Cerruti-Sola & Perinotto (1985) Cerruti-Sola M., Perinotto M., 1985, ApJ, 291, 237
- Chevalier & Imamura (1983) Chevalier R. A., Imamura J. N., 1983, ApJ, 270, 554
- Chevalier (1997) Chevalier R. A., 1997, ApJ, 488, 263
- Chu et al. (2001) Chu Y.-H., Guerrero M. A., Gruendl R. A., Williams R. M., Kaler J. B., 2001, ApJ, 553, L69
- Courant & Friedrichs (1976) Courant R., Friedrichs K. O., 1976, Supersonic Flow and Shock Waves. Springer Verlag, New York
- Frankowski & Soker (2009) Frankowski A., Soker N., 2009, New Astronomy, 14, 654
- Gruendl et al. (2006) Gruendl R. A., Guerrero M. A., Chu Y.-H., Williams R. M. 2006, ApJ, 653, 339
- Guerrero (2006) Guerrero M. A., 2006, IAUS, 234, 153
- Guerrero et al. (2005) Guerrero M. A., Chu Y.-H., Gruendl R. A., Meixner M., 2005, A&A, 430, L69
- Guerrero et al. (2002) Guerrero M. A., Gruendl R. A., Chu Y.-H., 2002, A&A, 387, L1
- Guerrero et al. (2004) Guerrero M. A., Jaxon E. G., Chu Y.-H., 2004, ApJ, 128, 1705
- Hu & Lou (2008) Hu R. Y., Lou Y.-Q., 2008, MNRAS, 390, 1619
- Hunter (1977) Hunter C., 1977, ApJ, 218, 834
- Kastner (2007) Kastner J. H., 2007, arXiv:0709.4136v1
- Kastner et al. (2003) Kastner J. H., Balick B., Blackman E. G., Frank A., Soker N., Vrtilek S. D., Li J. Q., 2003, ApJ, 591, L37
- Kastner et al. (2008) Kastner J. H., Montez R., Balick Bruce, De Marco O., 2008, ApJ, 672, 957
- Kastner et al. (2000) Kastner J. H., Soker N., Vrtilek S. D., Dgani R., 2000, ApJ, 545, L57
- Kastner et al. (2001) Kastner J. H., Vrtilek S. D., Soker N., 2001, ApJ, 550, L189
- Kwok (2000) Kwok S., 2000, The Origin and Evolution of Planetary Nebulae, Cambridge University Press, Cambridge
- Kwok et al. (1978) Kwok S., Purton C. R., Fitzgerald P. M., 1978, ApJ, 219, L125
- Leuenhagen et al. (1996) Leuenhagen U., Hamann W.-R., Jeffery C. S., 1996, A&A, 312, 167
- Leahy et al. (2000) Leahy D. A., Kwok S., Yin D., 2000, ApJ, 540, 442
- Lou (1996) Lou Y.-Q., 1996, MNRAS, 279, 129
- Lou (1998) Lou Y.-Q., 1998, MNRAS, 294, 443
- Lou & Hu (2008) Lou Y.-Q., Hu R.-Y., 2010, New Astronomy, 15, 198
- Lou & Shen (2004) Lou Y.-Q., Shen Y., 2004, MNRAS, 348, 717
- LZ (2009) Lou Y.-Q., Zhai X., 2009, ApSS, 323, 17
- Montez et al. (2005) Montez R. Jr., Kastner J. H., De Marco O., Soker N., 2005, ApJ, 635, 381
- Parker (1961) Parker E. N., 1961, ApJ, 133, 1014
- Raymond & Smith (1977) Raymond J. C., Smith B. W., 1977, ApJS, 35, 419
- Sabbadin et al. (2000) Sabbadin F., Cappellaro E., Benetti S., Turatto M., Zanin C., 2000, A&A, 355, 688
- Sahai et al. (2003) Sahai R., Kastner J. H., Frank A., Morris M., Blackman E. G. 2003, ApJ, 599, L87
- Sarazin (1986) Sarazin C. L., 1986, Rev. Mod. Phys., 58, 1
- Shen & Lou (2004) Shen Y., Lou Y.-Q., 2004, ApJ, 611, L117
- Shu (1977) Shu F. H., 1977, ApJ, 214, 488
- Shu et al. (2002) Shu F. H.,Lizano S., Galli D., Cant J., Laughlin G., 2002, ApJ, 580, 969
- Soker & Kastner (2003) Soker N., Kastner J. H., 2003, ApJ, 583, 368
- Spitzer (1978) Spitzer L., 1978, Physical Process in the Interstellar Medium. Wiley, New York
- Steffen (2008) Steffen M., Schönberner D., Warmuth A., 2008, A & A, 489, 173
- Stute & Sahai (2006) Stute M., Sahai R., 2006, ApJ, 651, 882
- Su et al. (2007) Su K. Y. L., et al., 2007, ApJ, 657, L41
- Tsai & Hsu (1995) Tsai J. C., Hsu J. J. L., 1995, ApJ, 448, 774
- Volk & Kwok (1985) Volk K., Kwok S., 1985, A&A, 153, 79
- Wang & Lou (2008) Wang W.-G., Lou Y.-Q., 2008, ApSS, 315, 135
- Werner et al. (2008) Werner K., Rauch T., Kruk J. W., 2008, A & A, 492, L43
- Whitworth & Summers (1985) Whitworth A., Summers D., 1985, MNRAS, 214, 1
- Yu et al. (2006) Yu C., Lou Y.-Q., Bian F.-Y., Wu Y., 2006, MNRAS, 370, 121
- Yu et al. (2009) Yu Y. S., Nordon R., Kastner J. H., Houck J., Behar E., Soker N., 2009, ApJ, 690, 440