Comptonization of the cosmic microwave background by high energy particles residing in AGN cocoons
Abstract
Context. X-ray cavities and extended radio sources (‘cocoons’) surrounding active galactic nuclei (AGN) have been detected by the Chandra X-ray mission and radio interferometers. A joint analysis of X-ray and radio maps suggests that pressure values of non-thermal radio-emitting particles derived from the radio maps are not sufficient to inflate the X-ray cavities. We propose using the Sunyaev-Zel’dovich (SZ) effect, whose intensity strongly depends on the pressure, to find the hitherto undetected, dynamically-dominant component in the radio cocoons.
Aims. Numerical simulations show that plasma with a high temperature ( K) is a good candidate for inflating the AGN cocoons. To constrain the population of high energy electrons inside AGN cocoons that is predicted by numerical simulations, we study different methods for maximizing the contribution of such energetic electrons to the SZ effect.
Methods. Our calculations of intensity maps of the SZ effect include relativistic corrections and utilize both analytic models and numerical 2-D simulations.
Results. We demonstrate that the spectral function at a frequency of 217 GHz has an absolute maximum at a temperature higher than K, therefore the measurement of the SZ effect at this frequency is a powerful tool for potentially revealing the dynamically-dominant component inside AGN jet-driven radio cocoons. A new method is proposed for excluding the contribution from the low energy, non-relativistic electrons to the SZ effect by means of observations at two frequencies. We show how one may correct for a possible contribution from the kinematic SZ effect. The intensity maps of the SZ effect are calculated for the self-similar Sedov solution, and application of a predicted ring-like structure on the SZ map at a frequency of 217 GHz is proposed to determine the energy released during the active jet stage. The SZ intensity map for an AGN cocoon in a distant elliptical is calculated using a 2-D numerical simulation and including relativistic corrections to the SZ effect. We show the intensity spectrum of the SZ effect is flat at high frequencies if gas temperature is as high as keV.
Key Words.:
Radiative transfer - relativistic processes - cosmology: cosmic microwave background - galaxies: cluster: intracluster medium - galaxies: ISM1 Introduction
Inverse Compton scattering of the cosmic microwave background radiation (CMB) by free electrons in intervening ionized gas allows us to study the physical state of the ionized gas (for a review, see Sunyaev & Zel’dovich 1980). The Comptonization process of a soft photon spectrum by a Maxwellian distribution of non-relativistic electrons is described by the Kompaneets equation (Kompaneets 1957). An analytical solution of the Kompaneets equation was derived by Zel’dovich & Sunyaev (1969) and applied to the distortion of the cosmic microwave background radiation by Thompson scattering in clusters of galaxies (the Sunyaev-Zel’dovich effect, hereinafter the SZ effect). The SZ effect has proven to be an important tool for cosmology and the study of clusters of galaxies (for a review, see Birkinshaw 1999). It measures the pressure of an electron population integrated along the line of sight and does not depend on spectral features of the underlying electron distributions, as long as they are non-relativistic.
A relativistically correct formalism based on the probability distribution of the photon frequency shift after scattering was given by Wright (1979) to describe the Comptonization process of soft photons by mildly relativistic electrons. The Wright formalism (as is the Kompaneets approximation) is based on two assumptions: (1) The Thomson cross-section is applicable; and (2) the photons are sufficiently soft that the energy of the scattered photons is less than that of the electrons. The validity regime of the Wright formalism was studied by Loeb et al. (1991) who have shown that this formalism is valid for many astrophysical environments. The relativistically correct Wright formalism was used to calculate the SZ effect in galaxy clusters by many authors (for a review, see Rephaeli 1995 and Birkinshaw 1999).
Although the SZ effect is observed in clusters of galaxies, there are other environments in which this effect should be observable by the next generation of telescopes with high sensitivity and good angular resolution (such as the ALMA telescope 111http://www.eso.org/sci/facilities/alma/science/cosmo.html). Since a significant fraction of the energy released by active galactic nuclei (AGN) goes into heating of the neighbouring plasma by shocks, distortion of the CMB due to the SZ effect by shock-heated plasma may be produced.
According to the standard evolutionary scenario for strong double radio sources (Scheuer 1974; Blandford & Rees 1974), jets boring through the intergalactic medium (IGM) are not in direct contact with the undisturbed IGM, but rather are enveloped in a cocoon consisting of shocked jet material and shocked IGM. Scheuer (1974) showed that the cocoon around a pair of supersonic, low-density (when compared to the ambient IGM) jets acts as a “wastebasket” for most of the energy deposited by the jets. Begelman & Cioffi (1989) argued that the cocoons in many observed sources have not yet had time to reach pressure balance with the ambient medium.
The Comptonization of the CMB by the hot plasma around strong radio sources was considered in the framework of the non-relativistic Kompaneets approximation by Yamada et al. (1999), Platania et al. (2002) and Cavaliere & Lapi (2006). However, numerical simulations by Antonuccio-Delogu & Silk (2008) and Tortora et al. (2009) show that the temperatures can become very high within the cocoons (T K), and therefore consideration of the relativistically correct SZ formalism is necessary. Kino et al. (2007) found that thermal electron temperatures of the AGN cocoons are predicted to be of the order of an MeV and determined only by the bulk Lorentz factor of the jet. Therefore, the relativistic Wright formalism must be applied to correctly derive the distortion of the CMB by AGN cocoons. The temperatures in AGN cocoons are orders of magnitude higher than those of clusters of galaxies ( K).
Recently, numerous X-ray cavities in the intra-cluster medium have been detected by the Chandra X-ray observatory (e.g. McNamara et al. 2000; McNamara et al. 2005). They often coincide with the radio lobes of the central radio galaxy. The non-thermal pressure derived from the equipartition condition for the energy of synchrotron-radiating non-thermal electrons and magnetic fields is a factor of ten smaller than the pressures required to inflate the bubbles (e.g. Ito et al. 2008). This implies that most of the energy in the cocoon is carried by an invisible component such as high energy thermal electrons (e.g. Ito et al. 2008). Observations of the SZ effect were proposed by Pfrommer et al. (2005) to probe the inferred dynamically-dominant component of plasma bubbles associated with X-ray cavities. Pfrommer et al. (2005) studied examples of several different physical scenarios concerning the composition of the plasma bubble which is as a whole in pressure equilibrium with the ambient ICM, and derived the SZ effect due to electrons in the plasma bubbles using the Wright formalism. However, cocoons are expected to be over-pressured with respect to the ambient IGM (Begelman & Cioffi 1989), and therefore the SZ effect derived under the assumption of pressure balance gives only a lower limit on the true SZ effect produced in the cocoons.
To constrain a population of high energy electrons inside AGN cocoons predicted by numerical simulations, we study in this paper the induced CMB distortion as a function of gas temperature. Taking into account the derived temperature dependences, we consider different methods for maximizing the contribution of such energetic electrons. By using the self-similar Sedov solution and the results of our numerical simulations, we calculate the relativistically correct SZ intensity maps.
The plan of the paper is as follows. We consider the SZ effect by mildly relativistic electrons in the framework of the Wright formalism in Sect. 2 to find a convenient method for observing an electron component with high temperatures ( K) derived from numerical simulations of AGN cocoons. The Sedov stage of the AGN cocoon evolution is considered in Sect. 3, where intensity maps of the SZ effect are calculated. The SZ effect produced by high energy electrons residing in a simulated AGN cocoon is studied in Sect. 4. We show in Sect. 5 that the CMB spectral distortion is flat in the broad high frequency range if gas temperatures are high. We calculate an intensity map of the SZ effect by means of the dynamical scaling of cocoon in Appendix A.
2 Generalized spectral functions.
In this section, the spectral properties of the SZ effect are studied within the framework of the Kompaneets and Wright formalisms to determine the contribution of the high temperature electron component.
2.1 A generalized spectral function
The CMB spectral distortion produced by the SZ effect in the Kompaneets approximation is (Zel’dovich & Sunyaev 1969):
| (1) |
where , , and the spectral function is given by:
| (2) |
The subscript denotes the fact that Eq. (1) was obtained in the non-relativistic limit. The Comptonization parameter is given by
| (3) |
where the line-of-sight integral extends from the last scattering surface of the CMB radiation to the observer at redshift z=0, is the electron temperature, is the number density of the gas, and is the Thomson cross-section, the electron mass, the speed of light, the Boltzmann constant and the Planck constant.
The CMB spectral distortion in the relativistically corrected formalism can be written in an analogous form to that given by (Enlin & Kaiser 2000; Pfrommer et al. 2005), and is
| (4) |
Note that in our notation, the spectral function is changed to the generalized spectral function which depends explicitly on the electron temperature.
The relativistic spectral function derived in the framework of the Wright formalism is given by
| (5) |
where , is the distribution of frequency shifts for single scattering (Wright 1979; Birkinshaw 1999).
The following limiting cases hold:
-
1.
if K, the values of relativistic and non-relativistic spectral functions are equal;
-
2.
if K, the value of the relativistic spectral function is written as
(6) where is the Planck spectrum.
Note that in the papers by Enlin & Kaiser (2000) and Pfrommer et al. (2005), a different form for the relativistically correct Wright formalism is proposed. These authors have chosen to average over the gas temperature along the line of sight. The two forms coincide if the astrophysical medium is homogeneous. However, if the astrophysical medium is inhomogeneous, use of the form given by Eq. (4) is more convenient since this uses local temperature values.
In order to study the properties of the generalized spectral function , we calculate this function at frequencies 90 GHz and 217 GHz at which the SZ effect will be observed by the ALMA telescope. These frequencies are also observable by other telescopes (like the South Pole Telescope and the Atacama Cosmology Telescope) and are motivated by the following reasons: 90 GHz is close to the frequency of the SiO (silicon monoxide) line, and 217 GHz corresponds to the crossover frequency of the non-relativistic SZ effect.
Pfrommer et al. (2005) simulated a Green Bank Telescope (GBT) observation of the central regions of the Perseus and Abell 2052 clusters where X-ray cavities have been detected by the Chandra observatory, and computed the frequency band-averaged SZ flux decrement in the frequency interval [86 GHz, 94 GHz]. The ALMA telescope will observe at a frequency 90 GHz with higher sensitivity and resolution than that of the GBT; comparison the sensitivity of the GBT with the ALMA telescope has already been studied222http://safe.nrao.edu/wiki/bin/view/GBT/GBTSensitivityComparison.
In Fig. 1 we show the dependence of the generalized spectral function at a frequency 90 GHz (x=1.59), derived from Eq. (5) on temperature. We find that the absolute value of the generalized spectral function at a frequency 90 GHz significantly (and monotonically) decreases with electron temperature. The Kompaneets approximation is valid when the change of a photon frequency due to Compton scattering is much smaller than an initial photon frequency . Since the average photon frequency change per inverse Compton scattering equals (for non-relativistic electrons, see, e. g., Rybicki & Lightman 1979), the Kompaneets approximation is invalid when , i.e. when . Thus, strong deviations from the intensity value (and from the spectral function value of ) derived in the Kompaneets approximation arise at high temperatures. The given estimate of the regime of breakdown of the Kompaneets approximation is an approximation and significant deviations (although not of order unity) take place at much lower temperatures, even at 30 keV (e.g. Fabbri 1981).


An interesting feature of the SZ effect is that at frequency 217 GHz (x=3.83) where the SZ effect in the framework of the Kompaneets approximation is zero, the SZ effect from an AGN cocoon is dominated by the high temperature electron component ( K). Therefore, the SZ effect at frequency 217 GHz is an interesting tool for analyzing the hot electron component in AGN cocoons. Note that Colafrancesco (2005) has considered a measurement of the SZ effect at a frequency 217 GHz to analyze a non-thermal electron component in radio lobes. Since the value of is small when the temperature is either much lower than K or higher than K, we conclude that this function should have an absolute maximum at an intermediate temperature.
Dependence of the generalized spectral function at a frequency 217 GHz (x=3.83) on temperature derived from Eq. (5) is shown in Fig. 2. The extremum of a curve is at a temperature keV ( K) which is in the temperature range found from numerical simulations of cocoons. Therefore analysis of the SZ effect at this frequency should be a promising way of demonstrating the existence of an electron component at high temperature. Note that combined generalized functions defined in Sect. 2.2 are also shown in Fig. 2.
Measurements at the frequency of 217 GHz are sensitive to the spectral response of the detectors. In Appendix B we show how the broad detector spectral response impacts on the possibility of an analysis of high temperature plasmas.
In Sect. 2.2, we investigate the possibility of constraining the properties of high energy particle populations by means of SZ intensity measurements at two frequencies.
2.2 Combined generalized spectral functions
Measurements of the SZ effect at a frequency 217 GHz is a unique way of revealing a population of mildly relativistic electrons in AGN cocoons if the intensity distortion is observed at a single frequency. We propose below a new method for excluding the contribution from the low energy, non-relativistic electrons to the SZ effect by means of observations at two frequencies.
By , we denote a combined generalized spectral function which corresponds to a relativistic contribution to the generalized function at a frequency taking into account a measurement at a frequency and is defined as
| (7) |
At low temperatures K, the limiting case (1) holds (see Sect. 2.1) and, therefore the combined generalized spectral function equals 0. It means that this function is insensitive to low-temperature electron components. (Note that a SZ intensity cavity at a frequency of 90 GHz produced by mildly relativistic electrons in an AGN cocoon due to relativistic SZ effect corrections (Pfrommer et al. 2005) can vanish if the assumption of pressure equilibrium doesn’t hold. This is because the SZ signal at a frequency of 90 GHz produced by a gas with a low temperature can be reproduced by a mildly relativistic gas with a high temperature and higher pressure, see Fig. 1). Equation (7) defines a family of spectral functions: each choice of values for frequencies , produces a different spectral function. The common property of spectral functions of this family is that they are more sensitive to mildly relativistic electron populations than to non-relativistic electron populations. Therefore, this choice for the combined generalized spectral function is motivated by studying of high energy electron populations. Let us consider different choices of frequencies of and .
There are three basic spectral features that characterize the thermal, non-relativistic SZ effect signal: a minimum of its intensity located at a dimensionless frequency 2.26 (=128 GHz), a crossover frequency (=217 GHz), and a maximum of its intensity whose frequency location at a dimensionless frequency 6.51 ( GHz). If the then the values of generalized and are coincident. If , the combined generalized function is undetermined because the value of equals 0. We noticed that values of the spectral function of at high temperatures at frequencies of and cannot be simultaneously fitted by the spectral function of , where is the arbitrary constant. Therefore, the choice of frequencies = 2.26 and = 6.51 corresponding to minimum and maximum values of the SZ intensity in the Kompaneets approximation is suitable to analyze high energy electron populations. The dependence of the combined generalized function with and on the plasma temperature is shown in Fig. 2. The combined function of where the lower frequency corresponds to 90 GHz is shown in Fig. 2 by dotted line. Figure 2 shows that the curves which correspond to the generalized spectral function at frequency 217 GHz and the combined generalized function are very similar and have peaks at temperatures higher than 100 keV. Therefore, using the combined generalized function provides us with an alternative and equivalent method for studying a population of electrons with energies higher than 100 keV. Such peaks at temperatures higher than 100 keV as that in the Fig. 2 permit us to maximize the SZ effect from very hot gas which is expected inside AGN cocoons from numerical simulations.
To calculate the intensity map of the SZ effect using combined generalized spectral functions, we use Eq. (4) where the generalized spectral function should be changed to the combined generalized spectral function . The kinematic Sunyaev-Zel’dovich effect which is a possible source of bias in the observations of the SZ effect by energetic electrons will be considered in Sect. 4.1.
In the next section, an analysis of the SZ effect by means of the generalized spectral functions is considered for a specific astrophysical important case - the Sedov self-similar solution.
3 A specific test case: the Sedov solution.
Self-similar solutions for a strong point explosion in an ambient medium are used for modelling adiabatic supernova remnants, solar flares and processes in active galactic nuclei (Ostriker & McKee 1988). Sedov (1959) gives the analytical self-similar solution for description of the motion of a shock front and the distribution of fluid parameters inside the shocked region for a strong point explosion in a uniform ambient medium. The gas flow pattern is determined by only two parameters: the ambient gas density , and the amount of energy released in the explosion. The distance of the shock from the origin is given by
| (8) |
where is a numerical constant.
The density as a function of the dimensionless radial coordinate decreases rapidly into the sphere and almost all the gas is in a relatively thin layer behind the shock wave (Sedov 1959). As , the pressure tends to a constant limit and the temperature accordingly becomes very high. Since the SZ effect depends on the thermal energy density of the electron population along a line of sight, a significant SZ effect is expected from the central region although the density is very small there.
Yamada et al. (1999) investigated the SZ effect produced by cocoons of radio galaxies and constructed a model for the evolution of a cocoon after the jet is turned off. They examined the evolution of a cocoon after the jet turns off by analogy with the evolution of a supernova remnant and showed that the cocoon remains hot enough to be the source of the SZ effect only during the free expansion and Sedov (adiabatic) phases. The Sedov stage of the evolution of the cocoon surrounding an AGN was also considered by Platania et al. (2002) and Chatterjee & Kosowsky (2007). In these papers, for simplicity the density of the gas inside the cocoon was assumed to be uniform and only the time evolution of the Comptonization parameter was taken into account. We will consider a more realistic case where the gas density depends on the position inside a cocoon.
The values of pressure and temperature at any radius inside a cocoon are determined by the ambient gas density , the amount of energy released in the explosion, and time . However, the parameters directly observed by X-ray telescopes are the ambient number density , the shock radius and the Mach number of the shock. The Mach number of a shock is usually derived from the Rankine-Hugoniot jump conditions (for a review, see Markevitch & Vikhlinin 2007). Another way to derive the Mach number of a shock is based on measurements of the flux ratio of the FeXXV and FeXXVI iron lines (Prokhorov 2010). Since the amount of energy released and time can be expressed in terms of the shock radius and the Mach number of the shock, we choose , , and as three parameters for describing the Sedov solution. Typical values of cm-3, kpc, and correspond to that of observed from AGN cocoons in galaxy clusters (Forman et al. 2005; Nulsen et al. 2005a). The Mach number of the shock can be calculated in terms of the shock velocity relative to the undisturbed gas given by (Sedov 1959)
| (9) |
The self-similar Sedov solution assumes that the pressure behind the shock is much larger than the pressure of the ambient gas (see Landau & Lifshitz 1959). The evolution of a supernova remnant in the high-pressure ambient gas was examined by Tang & Wang (2005) by means of high-resolution hydrodynamic simulations. They found that the supernova remnant evolution deviates from the Sedov solution when the shock radius is higher than the characteristic radius (see Eq. 5 in their paper). Using the typical values of the number density cm-3, the ambient gas temperature keV, and the release energy erg, we found that the characteristic radius for an AGN cocoon equals 80 kpc and higher than the shock radius kpc adopted above. Therefore, the self-similar Sedov solution is a reasonable approximation in our case.
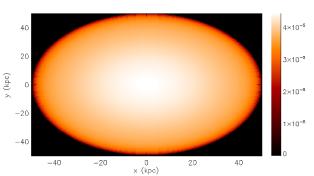
Assuming that a short-lived AGN source can be modeled as an instantaneous central explosion, Cavaliere & Lapi (2006) calculated the SZ effect in the framework of the Kompaneets approximation for the radial pressure profile taken form the Sedov solution. The intensity map of the SZ effect derived under the assumptions of the Sedov solution and the Kompaneets approximation is plotted in Fig. 3. We note that in this case, the intensity map of the SZ effect is almost plane with a slight intensity increase in the central region.
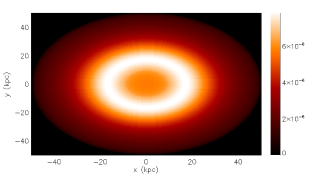
To calculate the SZ intensity maps at frequencies 90 and 217 GHz, we use the generalized spectral functions derived in the previous section for different values of temperature (see Eq. 5, Figs. 1 and 2). Using the Wright formalism and values of the three parameters introduced above, we calculate the SZ intensity map taking into account the presence of high temperature gas inside the cocoon. The intensity maps of the SZ effect at frequencies 90 GHz and 217 GHz are plotted in Figs. 4 and 5, respectively.
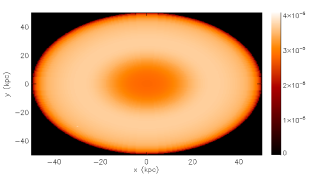
Figure 4 shows the SZ intensity decrement at a frequency 90 GHz at the center of this map in contrast to the SZ intensity map derived in the framework of the Kompaneets approximation (see Fig. 3). This central SZ decrement is provided by electrons with very high temperatures presented in the central region of the cocoon and the existence of such a decrement is consistent with the decrease the generalized spectral function at a frequency 90 GHz with temperature (see Fig. 1).
The SZ intensity map at a frequency 217 GHz shows a ring-like structure that is clearly seen in Fig. 5. This ring-like structure is associated with a SZ signal from a gas layer with temperature close to keV that corresponds to the maximum of the absolute value of the general spectral function (see Fig. 2). Since the value of the generalized function at a frequency 217 GHz and temperature keV is much higher than that is at much lower and higher temperatures (see Fig. 2 and Eq. 6), the SZ signal is therefore a promising tool for observing and analyzing plasma regions with a temperature close to K.
3.1 Astrophysical application of the ring at 217 GHz
In this section, we consider a way of constraining the amount of energy released during the active phase of a jet by using the location of a ring on the SZ intensity map at a frequency 217 GHz (or on the SZ intensity map derived from measurements at the 128 and 369 GHz frequencies, see Sect. 2.2).
The gas temperature at the back of the shock can be expressed in terms of the shock velocity as (Sedov 1959)
| (10) |
where is the proton mass and is the adiabatic index. The time-dependence of the gas temperature behind the shock is then
| (11) |
The temperature profile inside the sphere (Landau & Lifshitz 1959) is written as
| (12) |
where is the distance from the center. Although Eq. (12) was derived under the assumption that , we verify that this equation can also be applied if . Since the maximal contribution to the SZ effect at a frequency 217 GHz comes from the plasma with temperature close to keV, we fix this temperature and derive the dependence of the location of a ring on time
| (13) |
where
| (14) |
If the adiabatic index equals then the radius of a ring is given by
| (15) |
Note that the ring radius depends weakly on time and represents a parameter which changes negligibly with time (in contrast to the shock radius, see Eq. 8). The radius of a ring can be used as one of the parameters for describing the Sedov solution. If the ring radius is used instead of the Mach number then the value of the released energy is derived from Eqs. (8), (15), depends strongly on the ring radius, and is given by
| (16) |
Since the ring radius is and the distance of the shock from the origin is , the ratio of to is constant in time and the value of the energy is essentially determined by the ring radius of the SZ signal at a frequency 217 GHz.
The analytical solution of hydrodynamic problems such as the Sedov solution is useful, but many problems have no such solution and numerical simulations are needed. Furthermore, the moderate values observed for Mach numbers of shocks require inclusion of the effects of gravity and finite initial gas pressure in the pre-shock regions. We consider the SZ effect by relativistic electrons residing in AGN cocoons during the active jet phase by using the results of numerical simulations in Sect. 4.
3.2 Synthetic observations of the SZ effect on AGN cocoons in galaxy clusters
High-resolution observations of the SZ effect are a promising tool for observing AGN cocoons in galaxy clusters. Powerful AGN outbursts were revealed in the Hydra A cluster (Nulsen et al. 2005b), in the Hercules A cluster (Nulsen et al. 2005a), and in the MS0735.6+7421 cluster (McNamara et al. 2005). These clusters are located at the redshifts of z=0.05, 0.15 and 0.22, respectively. A flat CDM cosmology, with km s-1 Mpc-1 and , gives a scale of 2.67 kpc arcsec-1 for the redshift of z=0.15. Therefore, with the spatial resolution of ALMA (2.8′′ at 110 GHz), we will be able to resolve the structures down to 10 kpc at z=0.15. In this section we simulate observations of the ring-like structure on the SZ intensity map studied in the previous section.
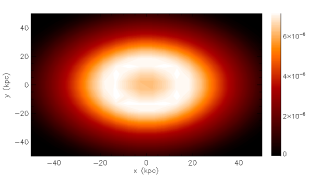
An ALMA observation of the central region of the Perseus cluster is simulated by Pfrommer et al. (2005) to reveal a presence of cavities on the SZ intensity map. We convolve the SZ intensity map with a Gaussian to obtain the resolution of the ALMA compact configuration as it was done by Pfrommer et al. (2005). Since the angular extent of a 100 kpc box (considered in Sect. 3) at the redshift z=0.15 is close to the ALMA field of view (), for the sake of simplicity we put a synthetic AGN cocoon in a galaxy cluster at the redshift z=0.15. The resulting synthetic SZ intensity map of an AGN cocoon at a frequency of 217 GHz in a galaxy cluster at z=0.15 is shown in Fig. 6. Figure 6 shows that the ring-like structure is still present on the SZ intensity map after a convolution with Gaussian of FWHM and, therefore, the ring radius measurement will be an interesting method provided by the next generation telescopes (e.g. ALMA) to determine the energy released during an outburst. The spatial resolution of is sufficient to resolve the ring-like structure on the SZ intensity map at frequency of 217 GHz and, therefore, ALMA with the spatial resolution of at a frequency of 217 GHz in the most compact configuration should reveal the ring-like structures on SZ intensity maps. If we choose the same AGN cocoon in a cluster at z=0.05, the spatial resolution of 10′′ is sufficient to reveal the ring-like structure on the SZ intensity map.
We simulated SZ maps for ALMA with the spatial resolutions of and at frequencies of 90 GHz and 217 GHz, respectively. Our simulated SZ intensity maps for ALMA are similar to those in Figs. 4 and 5, and available for download at the webpage http://www.oact.inaf.it/cosmoct/web_group/research4/cocoon_sz.html
Pfrommer et al. (2005) examined whether the plasma bubbles are detectable by ALMA and predicted 5 detection of the bubble of the Perseus cluster in an exposure time of 5 hours. Note that a signal at a frequency of 217 GHz derived from the Sedov solution is four times smaller than that analyzed by Pfrommer et al. (2005) at a frequency of 144 GHz (see Figs. 5 of this paper and 1 of Pfrommer et al. 2005). The signal-to-noise ratio for a detection of an AGN cocoon is proportional the square root of the exposure time (e.g. Pfrommer et al. 2005; for a review, see a document 333http://www.cv.nrao.edu/naasc/ALMAsensitivity.ps) and, therefore, to detect the signal at a frequency of 217 GHz the ALMA exposure time of 80 (i.e. ) hours is required. The ALMA Design Reference Science Plan (Version 2.2) contains two projects444http://www.eso.org/sci/facilities/alma/science/drsp/ in SZ studies (1.4.1 and 1.4.2) with integration time for each program of 400 hours and new projects concern the SZ effect on AGN cocoons should be promising. The Chandra X-ray satellite with a high spatial resolution of 0.5′′ has studied a non-relativistic electron component in the ICM, while ALMA high-resolution observations of AGN cocoons in galaxy clusters should permit us to reveal a new (mildly relativistic) electron component.
4 The SZ effect from a simulated cocoon
Recent hydrodynamic simulations do not take into account relativistic corrections to the SZ effect to derive SZ intensity maps (e.g. Sijacki et al. 2008). Such relativistic corrections are necessary for calculating the SZ effect on AGN cocoons produced by electrons with high temperatures. So far, studies of the SZ effect in the relativistic formalism were done only for an analytic toy cocoon model (see Pfrommer et al. 2005). In this section, we derive the SZ intensity map by using hydrodynamical simulations and the Wright relativistic formalism.
In previous papers (Antonuccio-Delogu & Silk 2008; Tortora et al. 2009), we used an Adaptive Mesh Refinement (AMR) code to follow the evolution of the cocoon produced by the jet propagating in the interstellar (ISM)/intergalactic medium (IGM). To perform the simulation, we used FLASH v.2.5 (Fryxell et al. 2000), a parallel, AMR code, which implements a second order, shock-capturing, Piecewise-Parabolic-Method (PPM) solver. The jet is modelled as a one-component fluid, characterized by a density which is a small fraction of the initial density of the ISM. In this simulation, the power injected by the jet is erg/s. We model the environment, where the jet propagates, as a two-phase ISM, comprising a hot, diffuse, low-density component having a temperature and a central density at K and cm3, respectively, and a cold, clumped system of high-density clouds in pressure equilibrium with the diffuse component. Such values of temperature and pressure are typical of the ISM in the central parts of an elliptical at high redshift. We assume that the diffuse gas is embedded within a dark matter (DM) halo, the latter being described by a Navarro-Frenk-White (NFW) density profile.
We choose a simulation box having a size kpc, where is defined such that the Hubble constant is 100 km s-1 Mpc-1. The spatial resolution attained is a function of the maximum refinement level and of the structure of the code. For a block-structured AMR code like FLASH, where each block is composed by cells, the maximum resolution along each direction is given by , where is the maximum refinement level. In this simulation, = = 8 and = 6, thus the minimum resolved scale is 78.125 pc. Note that we are performing a 2D simulation, but we do not impose any special symmetry.
Numerical simulations by Antonuccio-Delogu & Silk (2008) and Tortora et al. (2009) show that the temperatures can reach very high values within the cocoons (T K), if the ISM is dominated by a population of cold, star forming clouds embedded into and in approximate pressure equilibrium with a hot, diffuse phase. The pressure within the cocoon can reach high values because the temperatures are on average very high. The SZ effect should be significant since it determined by the pressure of the electron population integrated along a line of sight. Our simulation temperature and pressure maps are shown in Fig. 7 and 8.
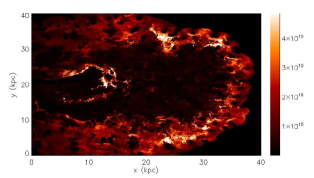
Figure 7 reveals a hot shell with a temperature of MeV around the internal region of the simulation AGN cocoon. The temperatures of the internal region are smaller than that of the hot shell and, therefore, absolute values of the generalized spectral functions at frequencies of 90 and 217 GHz should be higher for the internal region in the corresponding temperature range (see Figs. 1, 2, and 7).
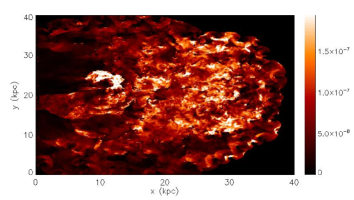
We find that the pressure values are higher inside the internal region in comparison with the thermal hot shell pressure. Therefore, the SZ effect in the cocoon internal region should be more significant than that produced by electrons located inside the hot shell. The pressure inside the simulation cocoon is two orders of magnitude higher than that found in the diffuse ISM. Such a pressure-jump corresponds to the Mach number of a shock equaled (Landau & Lifshitz 1959). The plasma inside the AGN cocoon is largely over-pressured relative to the ambient ISM. The radio lobes of the nearby radio galaxy Centaurus A is expanding into the ISM at the Mach number of 8.5 (Kraft et al. 2003) is representative of such over-pressured plasmas.
To produce the 3D pressure and temperature maps which are necessary to derive the intensity map of the SZ effect we rotate the 2D pressure and temperature maps along the jet axis. We calculated the SZ effect using the values of the generalized spectral functions found in Sect. 2. Since the gas temperatures in a cocoon are high, such a cocoon should be a source of the SZ effect at a frequency 217 GHz. The intensity map of the SZ effect at a frequency 217 GHz derived from the simulation maps of the gas pressure and temperature is plotted in Fig. 9.
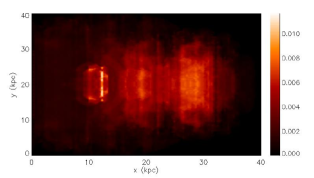
A comparison of Figs. 7 and 8 with Fig. 9 strongly suggests that the dominant contribution to the SZ effect at a frequency 217 GHz originates from the cocoon internal region. Therefore, measurements of the SZ effect at a frequency 217 GHz are a powerful tool for potentially revealing the dynamically dominant component inside AGN cocoons (see Fig. 8). The proposed method based on the generalized spectral function is a way of maximizing the contribution from the gas with a temperature in the range K K (see Fig. 2). The study of the SZ effect in a plasma at such temperatures is important since numerical simulations predict that such a plasma represents the still invisible dynamically dominant component inside AGN cocoons.
Our simulations are characterized by ISM density and temperature at 1 cm-3 and K (ISM pressure at erg/cm3), respectively, typical of the ISM in the central parts of an elliptical at high redshift (). We found that the plasma inside the AGN cocoon is largely over-pressured relative to the ambient ISM. The derived intensity of the SZ effect in this case is three orders of magnitude higher than that of cocoons in galaxy clusters. Though the linear scales of cocoons are close in both cases, the angular diameter of the cocoon within the distant elliptical galaxy equaled to is much smaller than that of the cocoon with the same linear size inside the Perseus cluster , the angular distance is denoted by . Then the SZ fluxes from such cocoons which are proportional to should be of the same order (see Figs. 5 and 9).
The main difference in the intensity of the signal is then a result of the higher internal pressure in the simulated cocoon. The pressure of high temperature gas in the cavity center, in the framework of the analytical model in Sect. 3, can not be much higher than the ambient pressure of a galaxy cluster erg/cm3 because of the moderate Mach number of the shock of and a decrease of the pressure from the shock front to the cavity center (e.g., Sedov 1959).
4.1 An analysis of the hot gas by means of the combined generalized function
As was shown in Sect. 2.2 using the combined generalized spectral functions provides us with an alternative to a measurement of the SZ effect at a frequency 217 GHz for studying a population of electrons with energies higher than 100 keV. In this section we derive the intensity map of the SZ effect by means of the combined function and consider how the contribution from the kinematic Sunyaev-Zel’dovich (SZ) effect can be eliminated (for review of the kinematical SZ effect, see Birkinshaw 1999).
The generalized spectral function at a frequency 217 GHz belongs to the family of spectral functions defined by Eq. (7). Both and functions have absolute maximal values at temperatures above 100 keV and, therefore, these functions are interesting for analyzing the presence of high energy electrons which are expected to be inside AGN cocoons. The intensity map of the SZ effect derived from our numerical simulation by using the combined generalized spectral function is plotted in Fig. 10.
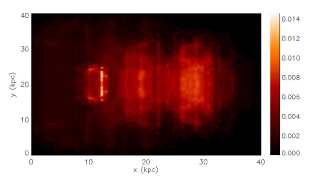
The similarity in shape between the SZ intensity maps in Figs. 9 and 10 shows that a population of high energy electrons can be constrained by means of different and equivalent methods based on measurements of the SZ effect.
A source of bias in the observations of the SZ effect by energetic electrons could be provided by a possibly relevant kinematic SZ effect. The kinematic SZ effect arises from the bulk motion of the medium relative to the CMB rest frame. The change of the CMB intensity due to the kinematic SZ effect is given by
| (17) |
where is the line-of-sight velocity of bulk motion in units of the speed of light. The spectral function is given by
| (18) |
The absolute maximum of the kinematic SZ effect lies at a frequency 217 GHz which coincides with the crossover frequency of the non-relativistic thermal SZ effect. Pfrommer et al. (2005) concluded that it is impossible to remove the degeneracy of the cocoon optical depth and the kinematic SZ effect using only a single frequency SZ observation. Colafrancesco et al. (2009) found that the value of the slope of the SZ effect does not depend on the kinematic SZ effect spectrum in the frequency range around the crossover frequency of the thermal SZ effect, i.e. in the frequency range . We now show that there is another way to eliminate the kinematic SZ effect based on the combined generalized spectral functions.
Let us define the intensity function as
| (19) | |||
where is the total intensity of the thermal and kinematic SZ effects, ( = 128 GHz), (=217 GHz), and ( GHz) correspond to the frequencies of the minimum, the crossover and the maximum of the non-relativistic thermal SZ effect, respectively.
Since does not depend on the non-relativistic thermal SZ effect (see Sect. 2.2) and equals zero, there is no contribution of the non-relativistic thermal SZ effect to the intensity function . Note that and have no dependence on the kinematic SZ effect, and therefore the study of the intensity function is a way of constraining a population of high energy electrons without biases provided by a possible relevant kinematic SZ effect. The value of the last bracket on the right-hand side of Eq. (19) is very close to 1 (it equals 1.029) and, therefore, the spectral function which corresponds to the intensity function (see Eq. 4) is approximately equal to
| (20) |
where the spectral functions and correspond to the SZ intensities of and , respectively. The spectral function is shown in Fig. 11.

The intensity map of the SZ effect derived from our numerical simulation by using the function corresponds to a residual between the intensity maps of Figs. 10 and 9. The function has the minimum at temperatures higher than 300 keV and is not affected by the kinematic SZ effect, and therefore differencing these SZ intensity maps (see Fig. 9 and 10) is an important tool for analyzing a high energy electron population.
In the next section, we consider the scattered CMB photon spectrum at higher frequencies. This study is important since photon energy gains due to the inverse Compton effect on high energy electrons are substantial.
5 Flatness of the high-frequency tail of the scattered photon spectrum
Electrons with high energies produce a substantial energy gain of photons, which scattered to the high-frequency tail. For an optical depth and a sufficiently large Comptonization parameter , a sequence of declining peaks in the high-frequency tail () of the scattered photon energy flux spectrum is present (e.g., see Loeb et al. 1991). These peaks correspond successively to singly, doubly (etc) scattered photons (see Figs. 4a-4d in Loeb et al. 1991). Next, we study the high-frequency tail of the scattered CMB spectrum by high energy electrons at frequencies below the first peak frequency.
At high frequencies (i.e. ) the term of Eq. (5) decreases strongly and, therefore, the Eq. (5) can be written as
| (21) |
The treatment is considerably simplified if and in the case the generalized spectral function is given by
| (22) |
The sub-exponential function has a maximum at the frequency shift . Since the approximate expression for the generalized spectral function is valid and we calculate the integral in Eq. (22) by the Laplace’s method. The approximate value of the sub-exponential function in a neighborhood of the point is then
| (23) |
and the spectral function approximately equals
| (24) |
As was shown by Kino et al. (2007) and Antonuccio-Delogu & Silk (2008), high gas temperatures ( MeV) are expected in AGN cocoons. For example, we choose the temperature equaled to 500 keV to study the high-frequency tail of the generalized spectral function. For high temperatures the function is wide and it is centered at high values of the frequency shift . The distribution of frequency shifts for single scattering at the temperature of keV is shown in Fig. 12.

Figure 12 shows that the values of the distribution of frequency shift lie in the narrow range (0.25, 0.28) if the frequency shift is in the range (1.5, 3.0). The frequency shift lies in this range when the dimensionless frequency is of and, therefore, the approximate value of the generalized spectral function in this frequency range is
| (25) |
The quantitative dependence of the spectral function keV) on the dimensionless frequency is illustrated in Fig. 13.

We conclude that the generalized spectral function should be flat in the broad frequency range when the temperature values are sufficiently high. Since the non-relativistic spectral function is a rapidly decreasing function at high frequencies in contrast with the spectral function at high electron temperatures, a measurement of the SZ effect at high frequencies provides an interesting test of the presence of high energy electrons.
6 Discussion and conclusions
The direct detection of the SZ effect can in principle provide a
unique diagnostic tool to study the physical conditions of the ICM
at high redshift. To reach this end, an accurate treatment of the
spectral properties of the SZ signal is very important, and this was
our main aim in this work. Previous models were based on simplifying
assumptions, like the assumption of pressure equilibrium and density
homogeneity (Colafrancesco, 2005; Pfrommer et al., 2005). Here we
have instead considered the SZ signal arising from a inhomogeneous
exactly solvable configuration, i.e. a spherically symmetric
Sedov-expanding region, and even more realistic models obtained from
2D fluid-dynamical simulations of jet/cocoon system propagating into
the ISMIGM.
In the standard model of a typical strong double radio
sources, a couple of twin jets advances into the IGM and engenders a
hot, low-density “cocoon” which is filled only of matter
originating from the jet and of part of the shocked IGM (Scheuer
1974; Blandford & Rees 1974). Numerical simulations by
Antonuccio-Delogu & Silk (2008), Tortora et al. (2009) and
theoretical works by Kino et al. (2007) suggest that the plasma
temperatures within the cocoons are very high
( K) and, therefore, these plasmas are
invisible in the soft X-ray band and generate cavities on the X-ray
maps (e.g. McNamara et al. 2005).
The energy density of the cocoon is higher than that of the IGM: it is a local hot region that induces a significant thermal SZ effect (Yamada et al. 1999). Since the temperature within the cocoons is expected to be very high, we have adopted a relativistically corrected formalism to calculate the SZ effect. Using the relativistically corrected Wright formalism, Colafrancesco (2005) and Pfrommer et al. (2005) have shown that the hot plasma within the X-ray cavities should be observable by detecting the SZ signal at a frequency 217 GHz, since the contribution of the non-relativistic IGM to the SZ effect at this frequency is negligible.
However, as stated above, the analytical models for the cocoons considered by Colafrancesco (2005) and Pfrommer et al. (2005) are based on the assumptions of pressure equilibrium and cocoon homogeneity. On the other hand, recent numerical simulations of the SZ effect do not include the relativistically corrected SZ treatment (e.g. Sijacki et al. 2008). To produce more realistic SZ maps we have considered the analytical Sedov model and numerical 2-D simulations and calculate the SZ effect by using the Wright formalism.
We have studied the CMB distortion due to the SZ effect as a function of
the gas temperature. We have shown that the CMB spectral distortion can be expressed in
terms of the generalized spectral functions
which are functions of the gas temperature. This spectral function at the frequency 217 GHz has a peak at
a temperature keV and,
therefore, analysis of the SZ effect at this frequency should be a
powerful way of checking for the existence of electron populations at high
energies.
We have also proposed a new method for excluding the contribution from the low
energy, non-relativistic electrons to the SZ effect by means of
observations at two frequencies. The derived
similarity of the generalized spectral function and of the combined generalized function provides us with an alternative and
equivalent method for studying a population of electrons with
energies higher than 100 keV. We have shown how one may correct
for a possible contribution from the kinematic SZ effect using the
difference between the generalized spectral function and the combined generalized function .
In Sect. 3 we have studied in detail the SZ effect for a specific astrophysical important case - the Sedov self-similar solution. The Sedov solution was used by McNamara et al. (2005) to described the observed X-ray cavities. We have then considered the AGN cocoon in a galaxy cluster, and calculated the SZ effect at a frequency 217 GHz produced by the hot gas inside an X-ray cavity. We have used the radius of the ring structure on the SZ intensity map for deriving the value of the released energy. In Sect. 3.2 we have also showed that the ALMA telescope is needed to reveal mildly relativistic electron populations in AGN cocoons.
We have then proceeded by considering the SZ effect from a simulated cocoon in Sect. 4. The simulated cocoon is largely over-pressured relative to the ambient ISM. We have derived the SZ intensity map by using hydrodynamical simulations and the Wright relativistic formalism. We showed that the SZ fluxes from cocoons in the central part of a distant elliptical and a nearby galaxy cluster are of the same order.
We have showed that the CMB spectral distortion is flat in a broad range of high frequencies if gas temperatures are high, and we have estimated the approximate value of the generalized spectral function at temperature 500 keV in the frequency range .
Our study demonstrates that the SZ effect, originating from populations of high energy electrons residing in AGN cocoons, calculated using the SZ intensity maps in the framework of relativistically corrected formalism, can give a detectable signal. We have proposed methods for maximizing the contribution of high energy electrons, which provides promising tests for finding the hitherto invisible hot component of AGN cocoons. The detections and measurements of these populations are within the reach of ALMA, and could provide a fundamental tool to characterize the evolution of AGN activity at high redshifts.
Appendix A Fluid dynamical scaling of cocoon
In the Appendix A we show how one can produce intensity maps of the SZ effect by means of a dynamical scaling of cocoon. We will use a slightly modified version of the scaling fluid dynamical equations by Tang & Wang (2009), which applies to the case of an expanding cocoon continuously powered by a jet. The set of equations we solve is very similar to Eqs. (1)-(4) of Tang & Wang (2009), with the only difference that the energy equation now contains a source term describing the injection of energy density:
| (26) |
where: is the power injected by the jet into the cocoon, denotes a 3-dimensional Dirac’s delta function with denoting the (bounded) jet’s injection region, and is the cooling term. Tang and Wang (2009) assume a scaling of the form: , where: is either a fundamental or derived physical quantity: length , mass , time , temperature , velocity , specific energy , density , pressure , total energy , and jet’s power ) and is a positive constant. Under the hypothesis that the cooling function , which holds for in a fully ionized plasma, the scaling quantities are found to be connected by the following relations:
| (27) |
| (28) |
| (29) |
| (30) |
| (31) |
| (32) |
| (33) |
| (34) |
Eq. 33 was derived from the scaling of the cooling term,
and the final equation (eq. 34) derives assuming the
following scaling of jet’s power:
.
Note that Eq. 33 is different from Eq. (15) of Tang &
Wang (2009). The latter reads: . Our derivation is obtained starting from the scaling of
the right-hand side terms: , where the symbol “” denotes
the power law scaling index. The number density scales as
and, therefore, the cooling term scales as . Thus, by equating the two terms, we have:
, which gives
Eq. 33.
As described by Tang & Wang (2009), this linear system is
completely specified after the choice of 2 of the coefficients. We
choose to fix the scaling coefficients for length and time,
and , and find
| (35) | |||
Thus, a given solution (also numerical) can be rescaled by means of Eqs. (35) to a different jet’s power using scalings coefficients.
To produce an intensity map of the SZ effect by a cocoon surrounding a less powerful jet using the dynamical scaling of cocoon we choose scaling parameters equaled: , , and . The scaled power injected by the jet is erg/s and the scaled size of the simulation box is 25 kpc. The intensity map of the SZ effect at a frequency 217 GHz derived from the scaling of the simulation maps of the gas pressure and temperature is plotted in Fig. 14.
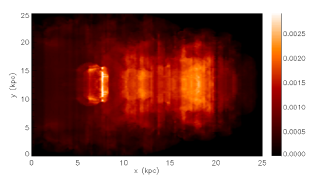
Thus a new intensity map of the SZ effect can be found for cocoons evolving in different ISM by means of one particular simulation and of the dynamical scaling. Therefore, the dynamical scaling is a promising method to produce the intensity maps of the SZ effect by hot gas residing in AGN cocoons in different ISM.
Appendix B Measurements at 217 GHz
In Appendix B we show how the broad detector spectral response impacts on the possibility of an analysis of high temperature plasmas.
We convolve the spectral function over a Gaussian detector response centered at 217 GHz as it was done by Shimon & Rephaeli (2003). The signal at a frequency of 217 GHz from a low-temperature plasma which arises due to the convolution over a spectral response is shown in Fig. B.1 as a function of the FWHM of the Gaussian detector response.

The contribution of the SZ signal at a frequency of 217 GHz due to the convolution over a spectral response with the FWHM GHz is far smaller than the SZ signal due to the presence of high temperature plasmas (see Fig. 2) and, therefore, the SZ effect at frequency of 217 GHz is a promising tool for analyzing the hot electron component in an AGN cocoon if the FWHM of a spectral response is smaller than 30 GHz.
Acknowledgements.
We are grateful to Kwang-il Seon for valuable discussions and thank the referee for very useful comments.References
- (1) Antonuccio-Delogu, V., Silk, J. 2008, MNRAS, 389, 1750
- (2) Begelman, M. C., Cioffi, D. F. 1989, APJ, 345, L21
- (3) Birkinshaw, M. 1999, Phys. Rep., 310, 97
- (4) Blandford, R. D., Rees, M. J. 1974, MNRAS, 169, 395
- (5) Cavaliere, A., Lapi, A. 2006, ApJ, 647L, 5
- (6) Chatterjee, S., Kosowsky, A. 2007, ApJ, 661, L113
- (7) Colafrancesco, S. 2005, A&A, 435, L9
- (8) Colafrancesco, S., Prokhorov, D. A., Dogiel, V. A. 2009, A&A, 494, 1
- (9) Enlin, T. A., Kaiser, C. R. 2000, A&A, 360, 417
- (10) Fabbri, R. 1981, Ap&SS, 77, 529
- (11) Forman, W., Nulsen, P., Heinz, S. et al. 2005, ApJ, 635, 894
- (12) Fryxell B. et al., 2000, ApJS, 131, 273
- (13) Ito, H., Kino, M., Kawakatu, N. et al. 2008, ApJ, 685, 828
- (14) Kino, M., Kawakatu, N., Itoh, H. 2007, MNRAS, 376, 1630
- (15) Kompaneets, A. C. 1957, Soviet Phys. - JETP, 4, 730
- (16) Kraft, R. P., Vázquez, S. E., Forman, W. R. et al. 2003, ApJ, 592, 129
- (17) Landau, L.D., Lifshitz, E.M. 1959, Fluid Mechanics (Addison- Wesley Reading)
- (18) Loeb, A., McKee, C. F. and Lahav, O. 1991, ApJ, 374, 44
- (19) Markevitch, M., Viklinin, A. 2007, Phys. Rep., 443, 1
- (20) McNamara, B. R., Wise, M., Nulsen, P. E. J., et al. 2000, ApJ, 534, L135
- (21) McNamara, B. R., Nulsen, P. E. J., Wise, M. W. et al. 2005, Nature, 433, 45
- (22) Nulsen, P. E. J., Hambrick, D. C., McNamara, B. R. et al. 2005, ApJ, 625, L9
- (23) Nulsen, P. E. J., McNamara, B. R., Wise, M. W. and David, L. P. 2005, ApJ, 628, 629
- (24) Ostriker, J. P., McKee, C. F. 1988, Rev. Mod. Phys., 60, 1
- (25) Platania, P., Burigana, G., De Zotti, G. et al. MNRAS, 337, 242
- (26) Pfrommer, C., Enlin, T. A., Sarazin, C. L. 2005, A&A, 430, 799
- (27) Prokhorov, D. A. 2010, A&A, 509, 29
- (28) Rephaeli, Y. 1995, ApJ, 445, 33
- (29) Rybicki, G. B., Lightman, A. P. 1979, Radiative Processes in Astrophysics, New-York
- (30) Sedov, L. 1959, Similarity and Dimensional Methods in Mechanics. Academic, New York
- (31) Scheuer, P. A. G. 1974, MNRAS, 166, 513
- (32) Shimon, M., Rephaeli, Y. 2003, New Astronomy, 9, 69
- (33) Sijacki, D., Pfrommer, C., Springel, V., Enlin, T. 2008, MNRAS, 387, 1403
- (34) Sunyaev, R. A., Zel’dovich, Ya. B. 1980, ARA&A, 18, 537
- (35) Tang, S., Wang, Q. D. 2005, ApJ, 628, 205
- (36) Tang, S., Wang, Q. D. 2009, MNRAS, 397, 2106
- (37) Tortora, C., Antonuccio-Delogu, V., Kaviraj, S. et al. 2009, MNRAS, 396, 61
- (38) Wright, E. L. 1979, ApJ, 232, 348
- (39) Yamada, M., Sugiyama, N., Silk, J. 1999, ApJ, 522, 66
- (40) Zel’dovich, Ya. B., Sunyaev, R. A. 1969, Astrophys. Space Sci., 4, 301