The -ray properties of radio-selected extragalactic jets
Abstract
Most extragalactic jets in radio-loud Active Galactic Nuclei are bright and variable -ray sources, which are continuously monitored with Fermi/LAT. We present the -ray properties of the MOJAVE and TANAMI AGN samples of radio-loud AGN. Both programs provide properties of the parsec-scale radio jets using Very Long Baseline Interferometry (VLBI) techniques. This information is important to understand the broad-band emission mechanism of these sources. In this work we compare the radio and -ray properties of the two samples and present upper limits on the -ray flux of the radio-brightest jet sources not yet detected by Fermi/LAT.
1 Introduction
Most extragalactic jets in radio-loud Active Galactic Nuclei (AGN) are bright and variable -ray sources. The high luminosity and variability of blazars is explained by a jet orientated close to the line of sight, in which charged particles are moving with relativistic speed, thus the emission is Doppler boosted (Blandford & Rees, 1978; Maraschi et al., 1992). This model is supported by the apparent superluminal motion which is typically found in the inner radio-jets of blazars (Lister et al., 2009b, , and therein).
Since 2008 August 11, the sky is monitored at -ray energies in the range from 20 MeV to 300 GeV with the Large Area Telescope (LAT), which is a pair conversion detector on board the Fermi Gamma-Ray Space Telescope (Atwood et al., 2009). Fermi/LAT scans the whole sky every three hours and its sky-survey mode is optimized to obtain a uniform exposure on longer time scales ( weeks). A large number of AGN were detected and monitored with Fermi/LAT (709 AGN during the first year of operation, Abdo et al., 2010b).
In this work, we present the -ray properties of two samples from the two largest ongoing Very Long Baseline Interferometry (VLBI) AGN monitoring survey programs: Tracking Active Galactic Nuclei with Austral Milliarcsecond Interferometry (TANAMI; Ojha et al., 2010) and Monitoring Of Jets in Active galactic nuclei with VLBA Experiments (MOJAVE; Lister et al., 2009a). The two samples are described in Sec. 2. For our analysis we use data obtained during the first year of Fermi operations.
The combined analysis of radio and -ray properties is still in progress. The detailed presentation of the upper limit analysis, a discussion of tentative new detections and individual sources is in work and will be published in an upcoming paper (Abdo et al., 2010, in prep.).
2 Sample
In our study, we investigate the -ray properties of two samples of extragalactic jets: the MOJAVE 1 and the TANAMI samples. MOJAVE 1 is a purely radio-selected sample of all AGN at declinations , whose 15 GHz radio flux density has exceeded 1.5 Jy (2 Jy for sources with ) at any epoch between 1994 and 2004 (Lister et al., 2009a). In total, the MOJAVE 1 sample is comprised of 135 AGN: 101 quasars, 22 BL Lac objects, 8 galaxies, and 4 unclassified objects. About two thirds of the sources in the MOJAVE 1 sample have been monitored since 1994 as part of the VLBA 2 cm Survey (Kellermann et al., 1998) with the Very Long Baseline Array (VLBA; Napier et al., 1994). Since 2002, the MOJAVE 1 sample has been observed with the VLBA as part of the MOJAVE program111http://www.physics.purdue.edu/astro/MOJAVE/ (see also Lister et al.,these proc.).
TANAMI is a radio VLBI monitoring program of currently 75 extragalactic jets south of declination. The observations are performed approximately every two months with the telescopes of the Australian Long Baseline Array (LBA; Norris, 1988) in combination with telescopes in South Africa, Antarctica and Chile. A detailed discussion of the TANAMI program including a description of the initial source sample, explanations of the observation and data reduction procedures, and brief notes on the individual sources are given by Ojha et al. (2010). TANAMI contains a radio-selected and a -ray selected sub-sample (see Ojha et al., 2010, for details). The radio selected sub-sample supplements the MOJAVE 1 sample south of declination. TANAMI observations are made at 8.4 GHz and 22 GHz yielding spectral indices of parsec-scale jet features (Müller er al., these proc.).
3 Analysis
To find associations of the AGN in the MOJAVE 1 and TANAMI sample with Fermi/LAT-detected -ray sources we performed a positional-association analysis. For each radio position of the sources in the sample we selected the closest sources in the “Fermi Large Area Telescope First Source Catalog” (Abdo et al., 2010a) inside the position uncertainty region of the -ray source. This approach yielded unique results for the majority of sources. A comparison with the results of the automatic source association pipeline of the LAT team (Abdo et al., 2009), in which the class and physical expectations of the association is taken into account, confirmed these results.
We used a maximum likelihood analysis (Cash, 1979; Mattox et al., 1996) to analyze those AGN which could not be associated with -ray catalog sources. For the calculation of upper limits on the -ray flux and the test statistic (TS) measuring the significance we used data in the range 100 MeV to 100 GeV obtained in the first year of Fermi/LAT.
We used the standard Fermi/LAT ScienceTools and the methods described by Böck et al. (2009) to obtain the flux, photon index, and test statistic of each unassociated source. For sources with we calculated upper limits on the flux. Sources with were considered as tentative new detections and in this case we modeled the flux and the spectral index. For the sources with the upper limits can be underestimated, thus we do not consider these sources in this work. Results for a Bayesian approach following Abdo et al. (2010a) will be presented in a following paper.
4 Results
| MOJAVE 1 | TANAMI | |||
|---|---|---|---|---|
| Class | detected | detected | ||
| Quasar | 101 | 61 | 32 | 24 |
| BL Lac | 22 | 19 | 10 | 10 |
| Galaxy | 8 | 3 | 11 | 2 |
| Unclassified | 4 | 2 | 22 | 17 |
Table 1 shows the number of quasars, BL Lacs, and galaxies in the MOJAVE 1 and TANAMI sample which are associated with -ray sources in the Fermi/LAT 1-year source list (Abdo et al., 2010a). 85 out of the 135 AGN in the MOJAVE 1 sample are detected with Fermi/LAT during its first year of operation. With a detection rate of most BL Lac objects in the sample are detected. quasars are detected and unclassified objects. At , the detection rate of the galaxies is the lowest. In the TANAMI sample 24 out of 32 quasars are detected with Fermi/LAT. The detection rates of unclassified sources is substantially higher in the TANAMI sample than in the MOJAVE 1 sample. This is most likely due to the inclusion of a -ray selected sub-sample and the addition of sources detected by Fermi/LAT after three months (Abdo et al., 2009). The detection rates for the radio-selected TANAMI sub-sample consisting of 21 AGN are: Quasars, BL Lac objects and Galaxies, which is comparable to the MOJAVE 1 sample.
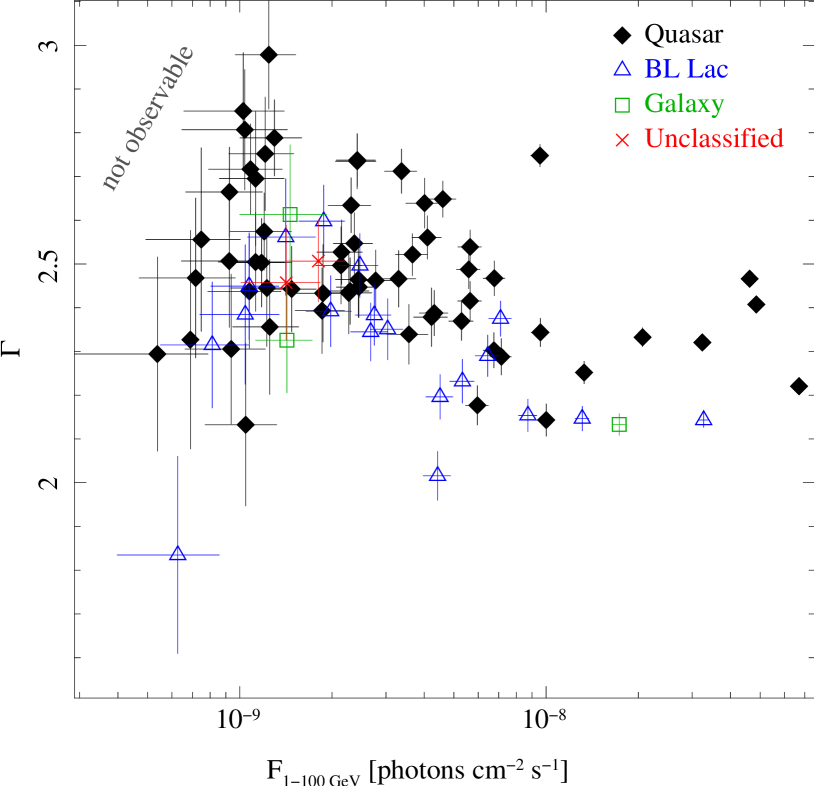
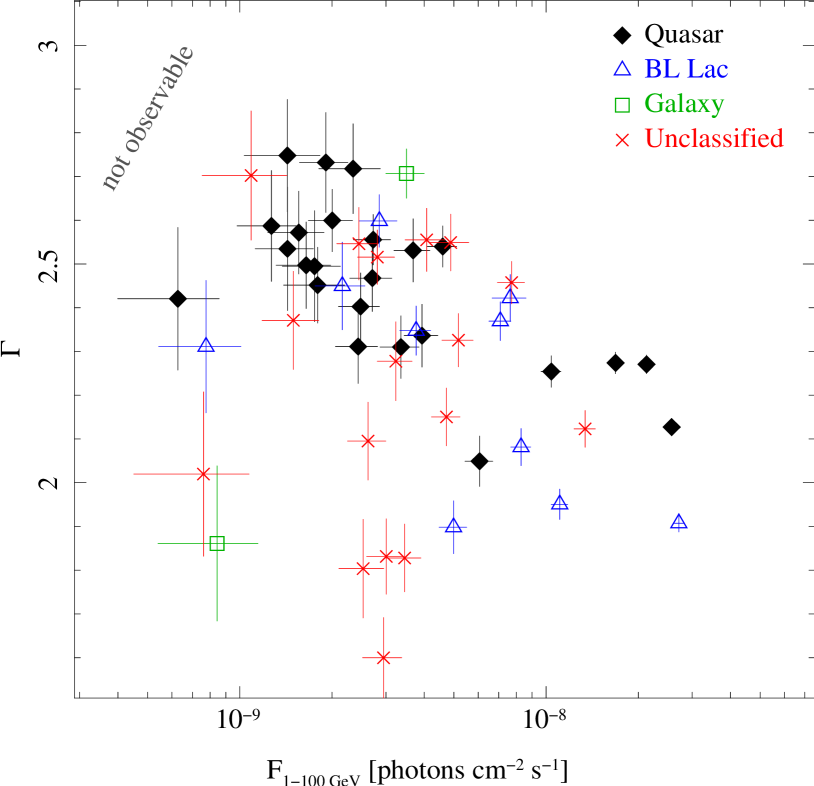
For the analysis of the associated sources we used the photon spectral indices from the Fermi/LAT first source catalog calculated in the range of 0.1–100 GeV, since this value can be obtained even for relatively weak sources (Abdo et al., 2010b). Figure 1 shows the distribution of flux and photon spectral index averaged over 11 months. In addition to the catalog values we present the values we obtained for the tentative new detections.
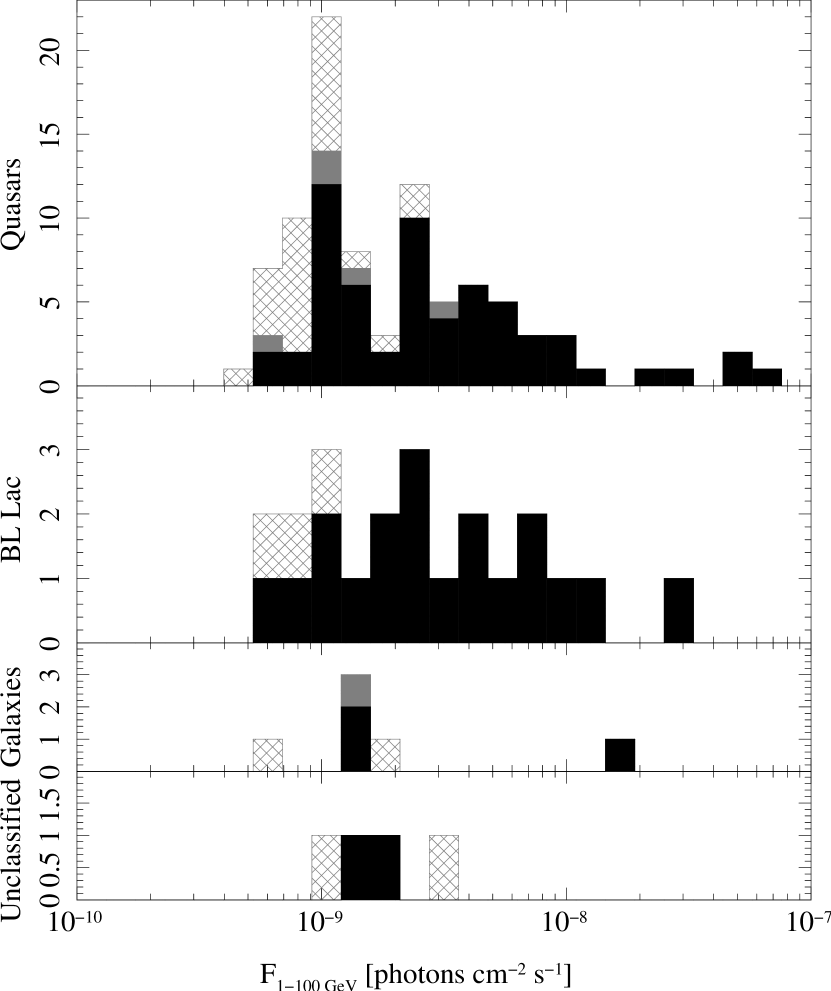
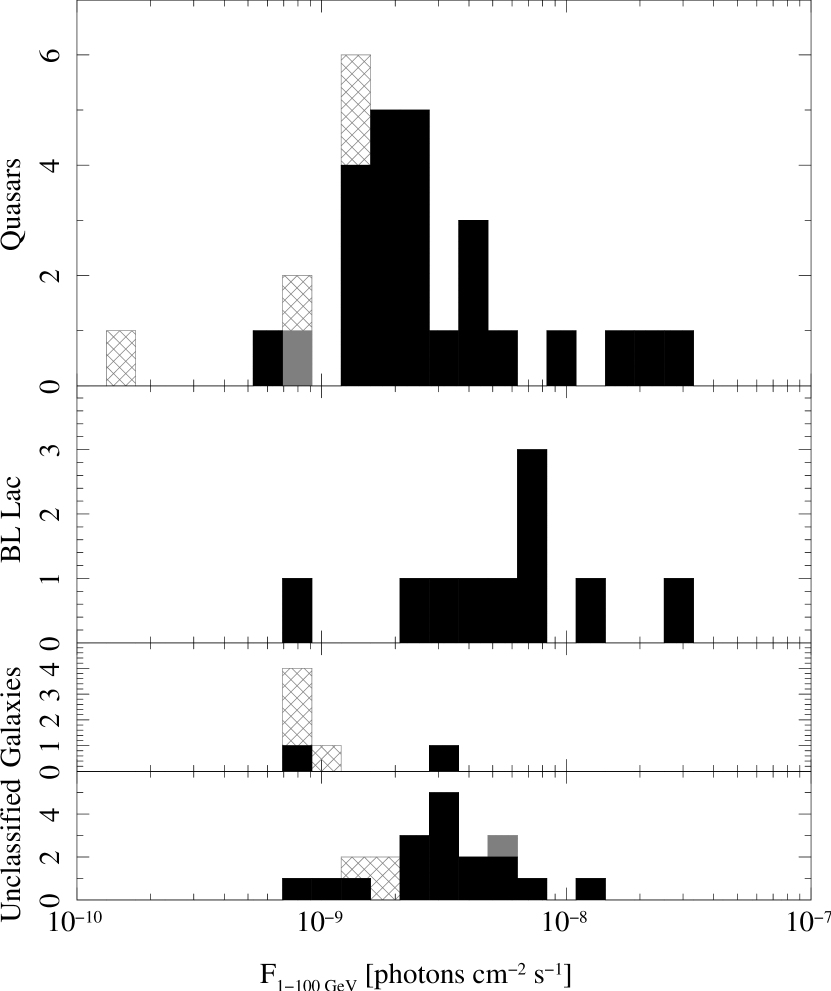
Figure 1 indicates a difference between the MOJAVE 1 and the TANAMI sample which is caused by the different selection criteria. The -ray selected TANAMI sub-sample contains several hard sources, i.e., sources with relatively small -ray photon spectral index, including many BL Lac objects and unassociated sources. BL Lac objects tend to have on average harder -ray spectra than the quasars (Abdo et al., 2009, 2010b).
Hard sources can be better localized with Fermi/LAT. Thus the limiting photon flux for a detection is significantly lower for BL Lac objects than for quasars with softer spectra (Abdo et al., 2010b, Fig. 10). In Fig. 2 this effect is not visible as the hardest sources in the sample do not reach a photon spectral index of as it is the case for the sources discussed by Abdo et al. (2010b). In addition, they consider the photon flux above 100 MeV instead of 0.1–100 GeV, which increases the photon flux for soft sources significantly.
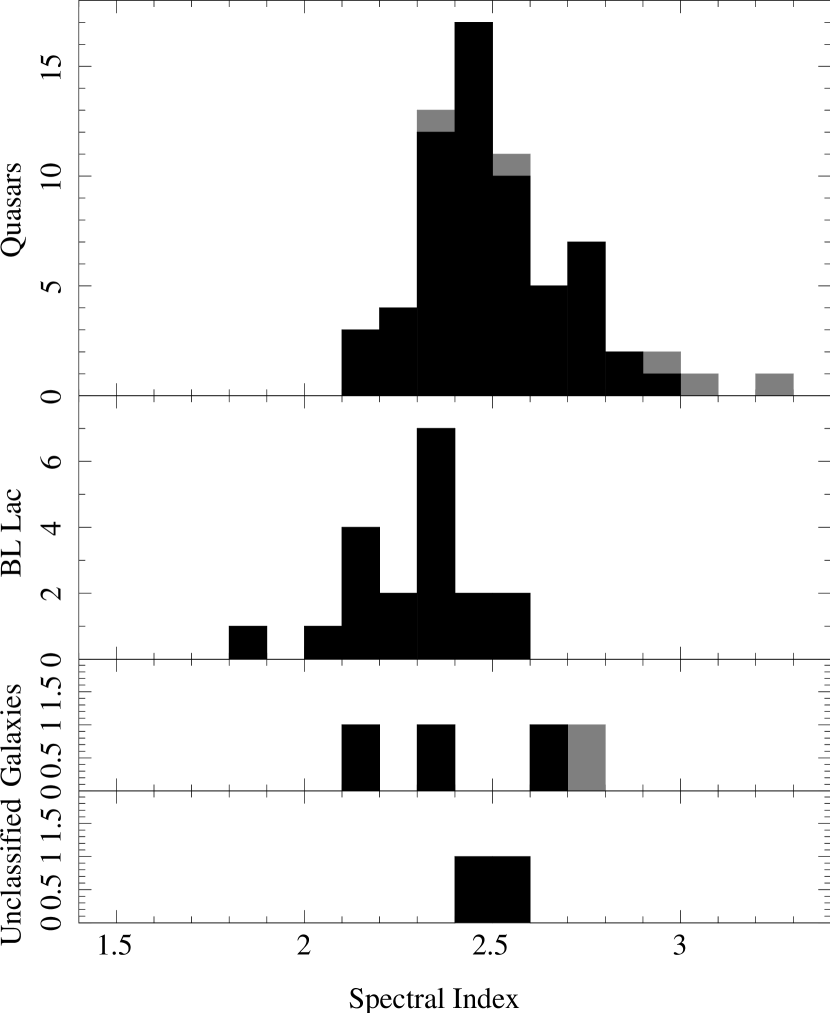
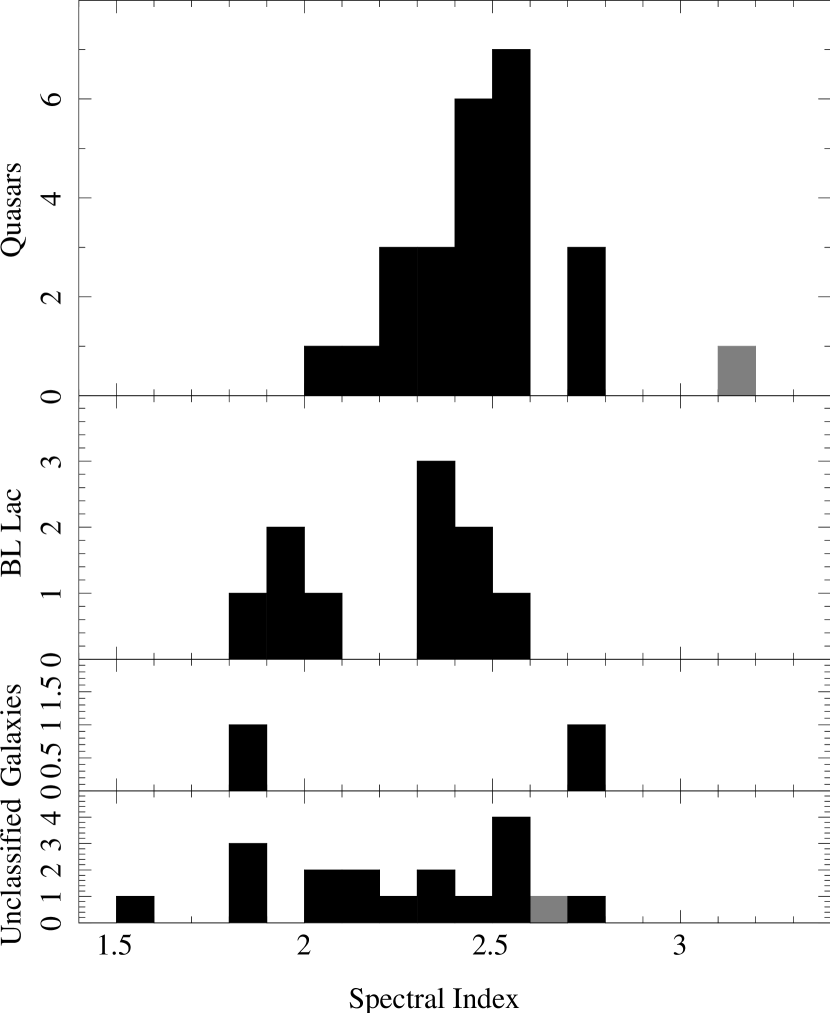
The distribution of spectral indices (Fig. 3) confirms that BL Lac objects exhibit harder -ray spectra than quasars and shows that the majority of the spectral indices of the tentatively new detected sources is softer than that of the associated sources, which is consistent with the difficulty to detect soft weak sources with Fermi/LAT.
It is worth noting that all three BL Lac objects in the radio-selected TANAMI sub-sample and the majority of BL Lac objects in the MOJAVE 1 sample have -ray spectral indices . Abdo et al. (2010c) found that BL Lacs with are mostly low synchrotron peaked (LSP) BL LACs (see also Abdo et al., 2010b, Fig. 14). It might be expected that a radio-selected sample contains more LSP BL Lacs than high synchrotron peaked ones, as the LSP type is brighter at the radio frequencies used for the selection.
5 Summary
The -ray properties of the MOJAVE 1 and TANAMI AGN samples were analyzed. The detection rates with Fermi/LAT depend on the source class. For the radio-selected MOJAVE 1 sample and the radio-selected TANAMI sub-sample BL Lac objects have the highest detection rates, followed by the quasars, whereas only a small fraction of the radio galaxies in the samples are seen by Fermi/LAT. With a maximum likelihood analysis on sources which were not associated with -ray sources in the Fermi/LAT First Source Catalog, we obtained upper limits on the -ray flux of these sources and found tentative new detections.
The analysis of the upper limits and the tentative new detections will be discussed in an upcoming paper.
Acknowledgements.
The Fermi/LAT Collaboration acknowledges support from a number of agencies and institutes for both development and the operation of the LAT as well as scientific data analysis. These include NASA and DOE in the United States, CEA/Irfu and IN2P3/CNRS in France, ASI and INFN in Italy, MEXT, KEK, and JAXA in Japan, and the K. A. Wallenberg Foundation, the Swedish Research Council and the National Space Board in Sweden. Additional support from INAF in Italy and CNES in France for science analysis during the operations phase is also gratefully acknowledged. This research has been partially funded by the Bundesministerium für Wirtschaft und Technologie under Deutsches Zentrum für Luft- und Raumfahrt grant number 50OR0808. The Long Baseline Array is part of the Australia Telescope which is funded by the Commonwealth of Australia for operation as a National Facility managed by CSIRO.References
- Abdo et al. (2010a) Abdo A.A., Ackermann M., Ajello M., et al., 2010a, ApJS 188, 405
- Abdo et al. (2010b) Abdo A.A., Ackermann M., Ajello M., et al., 2010b, ApJ 715, 429
- Abdo et al. (2009) Abdo A.A., Ackermann M., Ajello M., et al., 2009, ApJS 183, 46
- Abdo et al. (2010c) Abdo A.A., Ackermann M., Ajello M., et al., 2010c, ApJ 710, 1271
- Atwood et al. (2009) Atwood W.B., Abdo A.A., Ackermann M., et al., 2009, ApJ 697, 1071
- Blandford & Rees (1978) Blandford R.D., Rees M.J., 1978, In: A. M. Wolfe (ed.) BL Lac Objects., p.328
- Böck et al. (2009) Böck M., Kadler M., Tosti G., et al., 2009, ArXiv e-prints (arXiv:0912.4192)
- Cash (1979) Cash W., 1979, ApJ 228, 939
- Kellermann et al. (1998) Kellermann K.I., Vermeulen R.C., Zensus J.A., Cohen M.H., 1998, AJ 115, 1295
- Lister et al. (2009a) Lister M.L., Aller H.D., Aller M.F., et al., 2009a, AJ 137, 3718
- Lister et al. (2009b) Lister M.L., Cohen M.H., Homan D.C., et al., 2009b, AJ 138, 1874
- Maraschi et al. (1992) Maraschi L., Ghisellini G., Celotti A., 1992, ApJL 397, L5
- Mattox et al. (1996) Mattox J.R., Bertsch D.L., Chiang J., et al., 1996, ApJ 461, 396
- Napier et al. (1994) Napier P.J., Bagri D.S., Clark B.G., et al., 1994, IEEE Proceedings 82, 658
- Norris (1988) Norris R.P., 1988, In: M. J. Reid & J. M. Moran (ed.) The Impact of VLBI on Astrophysics and Geophysics, Vol. 129. IAU Symposium, p.485
- Ojha et al. (2010) Ojha R., Kadler M., Böck M., et al., 2010, ArXiv e-prints (arXiv:1005.4432)