Particle acceleration in the expanding blast wave of Carina’s Great Eruption of 1843
Abstract
Non-thermal hard X-ray and high-energy (HE; ) -ray emission in the direction of Carina has been recently detected using the INTEGRAL, AGILE and Fermi satellites. So far this emission has been interpreted in the framework of particle acceleration in the colliding wind region between the two massive stars. However, the existence of a very fast moving blast wave which originates in the historical 1843 “Great Eruption” provides an alternative particle acceleration site in this system. Here we explore an alternate scenario and find that inverse Compton emission from electrons accelerated in the blast wave can naturally explain both the flux and spectral shape of the measured hard X-ray and HE -ray emission. This scenario is further supported by the lack of significant variability in the INTEGRAL and Fermi measured fluxes.
1 Introduction
For a long time Carina – one of the most peculiar objects in the Milky Way – was believed to be a hypergiant luminous blue variable (LBV) star. Recent observations, however, suggest that it is a binary system composed of a massive primary () and a less massive secondary () (see e.g. Hillier et al., 2001; Pittard & Corcoran, 2002; Nielsen et al., 2007). Carina experienced a historical outburst in the 19th century and ejected 111Gomez et al. (2010) conclude from submillimetre observations that more than could have been ejected in the giant outburst. We restrict ourselves to the more conservative estimate of the kinetic energy in the expanding material. of gas which moves outwards at an average speed of km s-1 (Smith et al., 2003). This material formed the Homunculus Nebula which is expanding with a kinetic energy of erg – roughly 10% of the energy released by a supernova explosion.
The optical (Damineli, 1996; Damineli et al., 2000) and IR (Whitelock et al., 1994, 2004) lightcurves suggest a binary period of 5.5 years, moreover, the analysis of the X-ray lightcurves points to an highly eccentric orbit of (Corcoran et al., 2001; Okazaki et al., 2008). Carina is a colliding wind binary (CWB) with powerful winds produced by both members of the system. The primary has a very high mass-loss rate of (Hillier et al., 2001; Parkin et al., 2009) and a terminal wind velocity of , whereas the secondary has a fast low-density wind with and (Pittard & Corcoran, 2002). When supersonic expanding winds collide, they form a wind-wind interaction zone where charged particles can in principle be accelerated to high energies via the diffusive shock acceleration (DSA) process (see e.g. Eichler & Usov, 1993; Reimer et al., 2006). Observationally, particle acceleration in the wind-collision region of massive binary systems such as Carina is suggested by the detection of non-thermal radio emission in several objects (see De Becker, 2007, for a review). This indicates the existence of high-energy (HE; ) electrons in these systems.
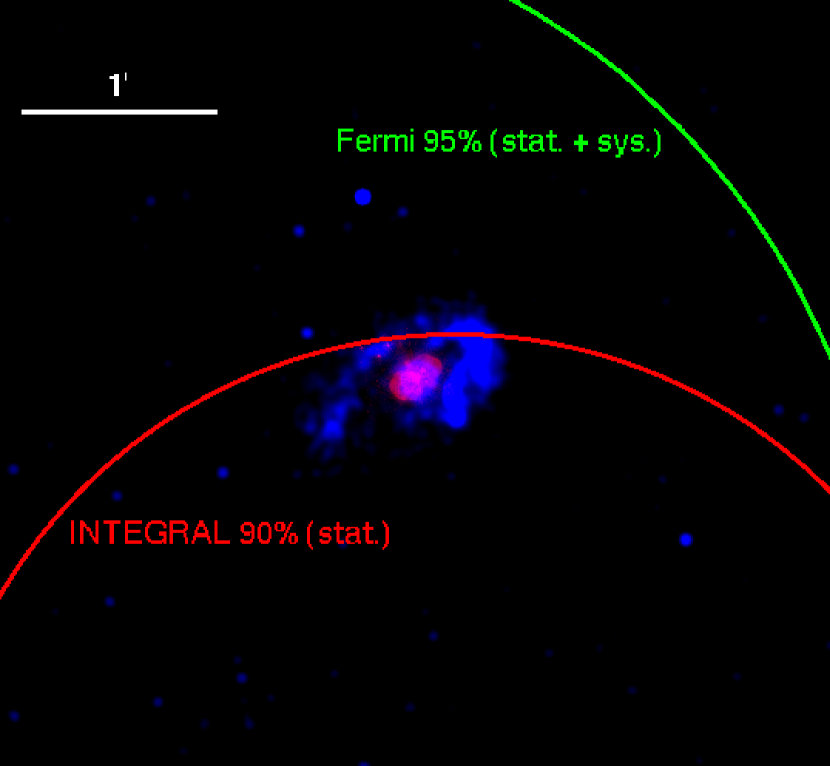
There is also evidence for the presence of relativistic particles in Carina with non-thermal X-ray emission recently reported by the INTEGRAL collaboration. The authors obtain an average luminosity of in the hard X-ray band keV (Leyder et al., 2008). In the HE domain, a source spatially coincident with the Carina position, and possibly variable, was reported by the AGILE collaboration (Tavani et al., 2009). A steady source in the same direction (including systematical and statistical errors, see Fig. 1 and Tab. 1) was confirmed using the LAT instrument aboard the Fermi satellite (Abdo et al., 2009, 2010a). The luminosity in the HE domain between 100 MeV and 100 GeV as obtained from the energy flux given in Abdo et al. (2010a) for a source distance of 2.3 kpc is , a factor of 20 higher than the INTEGRAL luminosity.
| Instrument | Energy range | Position (J2000) | Error [′] |
|---|---|---|---|
| INTEGRAL | 22 keV – 100 keV | , | 2.8 |
| Fermi | 30 MeV – 30 GeV | , | 3.6 |
| AGILE | 100 MeV – 100 GeV | , | 24 |
Given the large population of HE -ray sources detected by Fermi, with a significant fraction associated with pulsars, the chance probability of source confusion with a pulsar or another HE -ray source must be examined. Within a circle of radius, 19 ATNF pulsars with a spin-down luminosity erg/s (Manchester et al., 2005) – the sensitivity limit of the Fermi -ray pulsar catalog (Abdo et al., 2010b) – and 12 Fermi sources (Abdo et al., 2010a) have been detected. Thus, the probability to find any of the HE -ray sources or ATNF pulsars within the Fermi error circle at the Carina position is estimated to less than 0.2%. Moreover, whereas pulsars typically have a cut-off in the energy spectrum GeV, the spectrum of the Fermi source positionally coincident with Carina shows significant flux above 20 GeV, making an association with a pulsar unlikely.
The lightcurves from all mentioned instruments, together with lower-energy X-ray data from RXTE, which probes the colliding wind region (CWR), are shown in Fig. 2. Note, that the flare reported by AGILE around phase was not confirmed using the more sensitive Fermi-LAT.
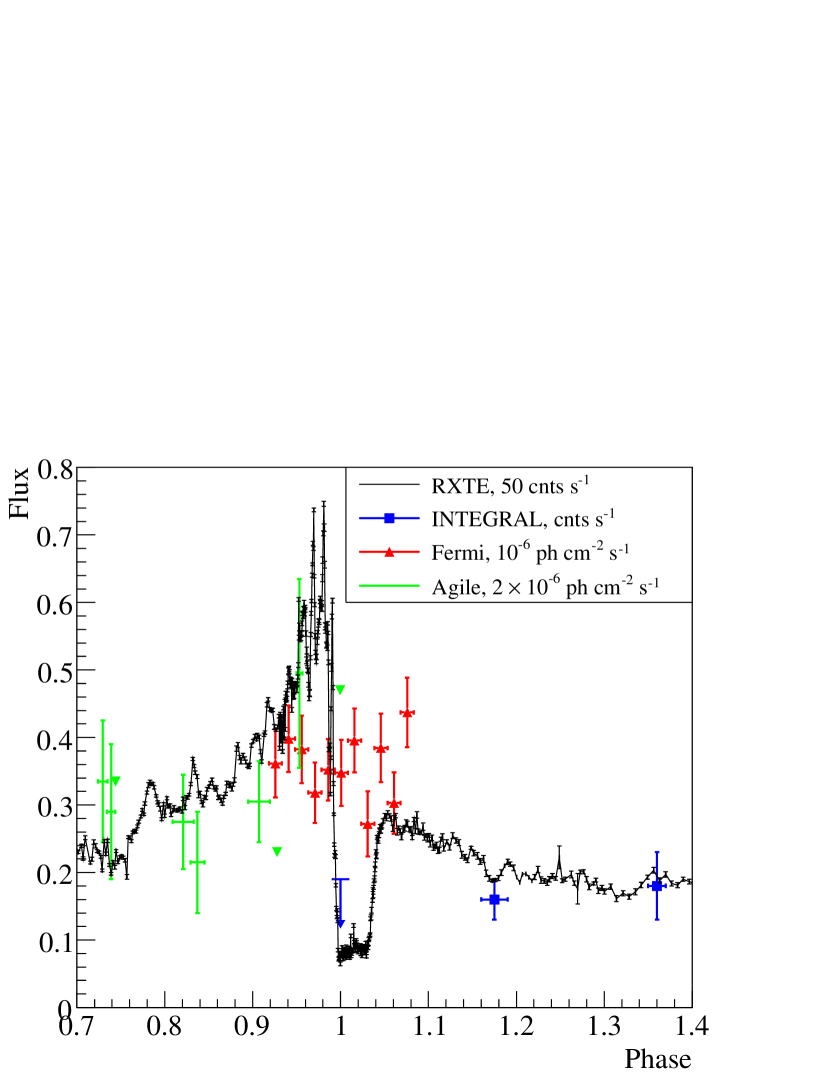
Although INTEGRAL detected no significant hard X-ray emission during periastron passage, the upper limit is consistent with steady emission. The absence of significant variability in the 50 keV and GeV regime as shown in Fig. 2 is surprising in a CWB picture, especially during periastron passage where a collapse of the CWR is expected and hence no particle acceleration should occur.
The detections of hard X-ray and HE -ray emission in Carina have so far been interpreted in the framework of particle acceleration in the colliding winds of the two massive stars. However, the CWR of Carina is not the only place within the Fermi, AGILE and INTEGRAL error circles, where particles can be accelerated via DSA to high energies. Recent observations show that Carina is surrounded at a distance of 0.25 pc by a very fast moving blast wave. The giant outburst of 1843 (also known as the “Great Eruption”) produced material which is now moving ahead of the Homunculus Nebula at speeds of km s-1 (Smith, 2008). This blast wave currently overruns the “Outer Ejecta” a ring-like structure of material which originates from an ejection of mass from Carina years ago (Walborn et al., 1978).
The existence of the fast-moving material doubles the estimate of the total kinetic energy of the giant outburst and mimics a low-energy supernova remnant (SNR) shell (Smith, 2008) with a blast wave moving into the ISM with velocities comparable to the historical supernovae RCW 86 (Vink et al., 2006) and SN 1006 (Vink, 2005). Fig. 1 shows the X-ray emission as measured with Chandra and optical emission measured with the Hubble Space Telescope (HST). The 95% (stat. + sys.) and 90% (stat.) error circles of Fermi-LAT and INTEGRAL, respectively, are overlaid. They enclose the Carina position. In this work the possibility of particle acceleration in the expanding blast wave of 1843’s Great Eruption is examined and leptonic and hadronic origins of the observed -ray emission are investigated in detail.
2 Particle acceleration in the blast wave
SNRs start their evolution by a free-expansion phase of the ejecta and enter the pressure-driven Sedov phase, once the mass of displaced material roughly equals the ejecta mass. The transition between the two phases in the remnant surrounding Carina is expected to occur after depending on the ambient density , for a blast wave speed of 6000 (3500) km/s, respectively. The density of the medium surrounding the blast wave can be estimated by adopting two steady stellar winds which filled the volume around Carina prior to the Great Eruption. For typical wind speeds of 500 km/s and a typical mass-loss rate of M⊙ yr-1 (Hillier et al., 2001; Parkin et al., 2009) the density of the circumstellar medium would be of the order of 50 cm-3 at a distance of 0.25 pc. Hence, the blast wave is currently in the transition between free-expansion and Sedov phase, implying that efficient particle acceleration is possible.
The distance of 0.25 pc of the blast wave from Carina used here is motivated by the conclusion of Smith (2008) that parts of the Outer Ejecta are currently being overrun by the blast wave and by X-ray observations, where Seward et al. (2001) used a ring with the same radius to describe the soft X-ray shell coincident with the Outer Ejecta. On the other hand, for a steady shock speed of 3500 km/s and an age of 167 years, the expected distance of the blast wave to Carina is 0.6 pc. A wind solution of the fast moving material, which would result in an increasing velocity with time, could explain such a difference. To account for the different distance estimates, the spectral energy distributions (SEDs) for both values are shown in Section 4.
Relativistic electrons and protons will gain energy when crossing the shock front of Carina’s blast wave. In the limit of a strong shock, the particle crossing time is determined by the diffusion coefficient , expressed in terms of the Bohm diffusion coefficient:
| (1) |
the shock speed , the particle energy and the magnetic field in the shock region as:
| (2) |
The energy gain per shock crossing is given by and, hence, the acceleration timescale :
| (3) |
No magnetic field measurements are available in the region of the blast wave. However, for the Homunculus Nebula different estimates exist and are used in the following as a rough guide for the magnetic field strength in the region of interest. Aitken et al. (1995) derived from polarization measurements, which were based on dust grain alignment, magnetic field strengths of (G–G) in the Homunculus Nebula, depending on the underlying process. However, the dust shell of the Homunculus appears to be neutral and is likely composed of silicates and Fe rather than typical ISM dust grains (Gail et al., 2005). Hence, for the purpose of this work, a lower magnetic field strength of G is assumed. In the Bohm limit and without energy losses, it would take about a year to accelerate an electron or proton to an energy of 100 GeV in a field given a shock speed of 3500 km s-1. This acceleration timescale is short compared to the time since the giant outburst (167 years) and implies that charged particles can potentially be accelerated to TeV energies.
3 Origin of the -ray emission
Protons and heavier nuclei accelerated in the expanding blast wave will interact with the ambient medium, producing -decay rays above 300 MeV. The timescale for inelastic proton-proton interactions is somewhat energy-dependent but can be approximated as (Aharonian, 2004):
| (4) |
where is the density of hydrogen atoms per cm-3. From a veil of [O III] emitting material surrounding Carina and its ejecta Smith et al. (2005) estimate a mean density of 400 particles per cm-3 and Smith (2008) finds 500 cm-3 in this region, implying years. This timescale is much longer than the age of the remnant and hence the p-p channel is radiatively inefficient. To explain the observed level of -ray emission with this density of target material an energy of about erg in hadronic cosmic rays ( is the fraction of the proton energy released in rays in a typical interaction) would be required. This is roughly 5% of the kinetic energy of the blast wave, quite plausible within the framework of DSA. However, it is hard to explain the Fermi emission below 300 MeV, and especially the INTEGRAL emission, in this scenario. Furthermore the required maximum energy of protons as indicated by the curvature in the Fermi spectrum is well below the expected maximum acceleration energy associated with either the age or size of the system.
Contrary to hadronic cosmic rays, accelerated electrons will encounter significant energy losses during the acceleration process. They will predominantly lose energy via inverse Compton (IC) scattering on radiation fields present in the acceleration region, via synchrotron radiation in magnetic fields, and by Bremsstrahlung in interactions with ambient material. The IC cooling time in the presence of a black-body target radiation field with energy density for an electron of energy is (Moderski et al., 2005; Hinton & Hofmann, 2009):
| (5) |
Assuming that the radiation field of the whole Homunculus Nebula is concentrated in a point at 0.25 pc distance to the blast wave and follows a black-body spectrum of 260 K temperature (Gehrz & Smith, 1999), the energy density in IR photons which serve as target radiation field is , several orders of magnitude higher than the density of the cosmic microwave background () or typical ISM photon fields. For infrared target photons the Klein-Nishina (KN) suppression of the IC cross-section for electron energies GeV is a less than 20% effect and is not considered in the following. The relevant IC cooling time for electrons in the blast wave region is therefore . In a field, the synchrotron-loss timescale for 100 GeV electrons is of () years: IC losses will dominate unless . In dense media, Bremsstrahlung may also contribute significantly to the energy-loss rate of electrons. The estimated mean density of particles per cm-3 implies a typical Bremsstrahlung loss time of years. Therefore, at GeV energies, IC emission is very likely to be the dominant emission process for electrons in this system.
The maximum electron energy is determined (for cooling-limited acceleration) by the balance between radiative energy losses and the rate of energy gain via DSA, when :
| (6) |
This maximum energy for the measured blast wave speed is consistent with the HE -ray emission found by Fermi for moderate magnetic fields of and diffusion close to the Bohm limit. Moreover, the energy-loss timescale is much shorter than the age of the remnant, implying that acceleration of electrons is indeed cooling limited in this system. In this scenario most of the energy injected into the acceleration process emerges as IC radiation in the GeV domain. For such an efficient process the required energy input in electrons is modest: within an order of magnitude of erg. IC emission is expected to dominate over p-p emission in this system as long as .
Vannoni et al. (2009) performed numerical calculations where they studied acceleration and radiation of electrons in an radiation-dominated environment such as the one investigated in this work. Compared to the magnetic field of used here, the authors obtain for magnetic fields of maximum particle energies in the TeV regime, where KN effects become very significant.
4 Spectral Energy Distribution
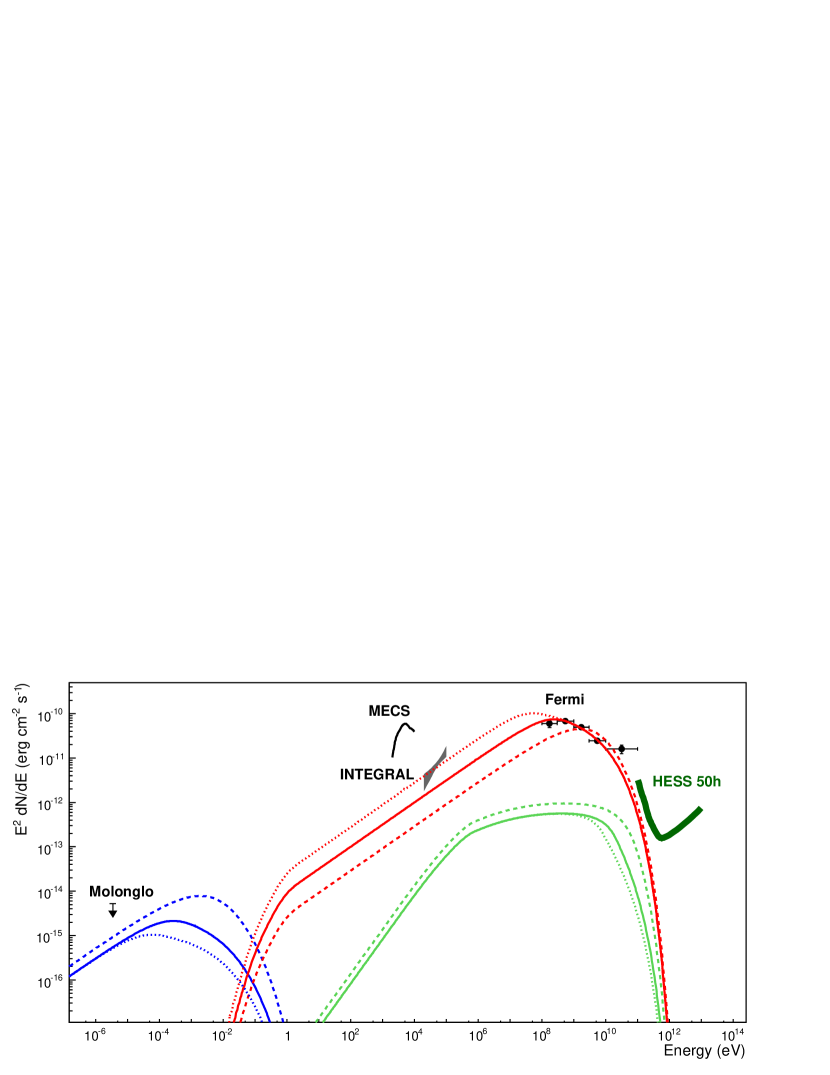
Figure 3 shows the measured SED of the region around Carina together with calculated synchtrotron and IC emission for the leptonic scenario outlined above (solid lines). The calculation is a single-zone time-dependent numerical model as described in Hinton & Aharonian (2007).
Electrons accelerated via the DSA process are expected to follow a power-law in energy with index and produce an IC (and synchrotron) -ray spectrum with spectral index . For continous injection IC cooling in the Thomson regime results in a spectral break with . In the case of the Great Eruption 167 years ago, the IC break energy is expected to lie at GeV for a blast wave distance of 0.25 pc. As Figure 3 shows, for this distance the observed break between the INTEGRAL and Fermi spectra occurs somewhat below this energy, close to the expectation for the higher radiation field corresponding to a smaller distance of 0.15 pc. This value is broadedly consistent with expectations since the relevant radiation field is the average value encountered over the history of the object. Furthermore, the system is far from radially symmetric and parts of the shell lie at significantly smaller than average distances to the Homunculus. The Fermi data indicate a high energy cut-off at an electron energy of GeV, very close to the expected cut-off for IC-cooling-limited acceleration.
The dashed and dotted-lines in Figure 3 demonstrate the effect of adjusting the main parameter of the model. For the dashed curves the radiation field is decreased to that expected at 0.6 pc (rather than 0.25 pc) from Carina. In this case an increase in energy in electrons by a factor of 2.3 would be required to match the Fermi flux. For the dotted curves the radiation field is increased to that expected at 0.15 pc from Carina. All curves were produced assuming a magnetic field of G. Magnetic fields higher than G are excluded in this scenario by the limit on non-thermal radio emission from Molonglo. For a blast wave distance of 0.6 pc, the shape of the resulting model spectrum reproduces the data in the HE domain less well. A model with a realistic time and space dependent radiation field would be expected to fall in the region defined by the three curves shown.
5 Summary
It appears that the properties of the high-energy non-thermal emission of Carina are consistent with an origin at the high-velocity blast wave of the Great Eruption of 1843. As Figure 3 demonstrates, the position of the spectral break between the Fermi and INTEGRAL domains, and the cut-off energy measured using Fermi, can be explained as a cooling break and an acceleration limit, respectively.
A prediction of this model is an extended emission region and hence non-variability of the signal. The non-variability of the source in the -ray regime is supported by the Fermi observations. While Fermi and INTEGRAL do not provide sufficient angular resolution to resolve the blast wave (see Fig. 1), high resolution radio observations will be able to resolve non-thermal radio emission from this acceleration site. Detection of a radio shell at the location of the shock would support the proposed scenario.
The time elapsed since the ejection of the very fast material by Carina is comparable to the age of the youngest Galactic SNR G 1.9+0.3 and between the ages of the remnants of SN 1987A and Cas A. It may provide important insights into particle acceleration and production of non-thermal radiation during the early stages of remnant evolution where only very few objects can be studied.
References
- Abdo et al. (2009) Abdo, A. A., et al., 2009, ApJS, 183, 46
-
Abdo et al. (2010a)
Abdo, A. A., et al., 2010,
http://fermi.gsfc.nasa.gov/ssc/data/access/
lat/1yr_catalog/1FGL_catalog_v2.pdf - Abdo et al. (2010b) Abdo, A. A., et al., 2010, ApJS, 187, 460A
- Aharonian (2004) Aharonian, F. A., 2004, Very high energy cosmic gamma radiation: a crucial window on the extreme Universe, World Scientific Publishing, 2004
- Aitken et al. (1995) Aitken, D. K., et al., 1995, MNRAS, 273, 359A
- Corcoran et al. (2001) Corcoran, M. F., et al., 2001, ApJ, 547, 1034
- Damineli (1996) Damineli, A., 1996, ApJ, 460, L49
- Damineli et al. (2000) Damineli, A., et al., 2000, ApJ, 528, L101
- De Becker (2007) De Becker, M., 2007, A&A Rev., 14, 171
- Eichler & Usov (1993) Eichler, D. and Usov, V., 1993, ApJ, 402, 271
- Gail et al. (2005) Gail, H.-P., et al., 2005 ASP Conference Series, 332, 317G
- Gehrz & Smith (1999) Gehrz, R. D. & Smith, N., 1999 ASP Conference Series, 179, 251
- Gomez et al. (2010) Gomez, H. L., et al., 2010, MNRAS, 401L, 48G
- Hillier et al. (2001) Hillier, D. J., et al., 2001, ApJ, 553, 837
- Hinton & Aharonian (2007) Hinton, J. A. & Aharonian, F. A., 2007, ApJ, 657, 302H
- Hinton & Hofmann (2009) Hinton, J. A. & Hofmann, W., 2009, ARA&A, 47, 523
- Leyder et al. (2008) Leyder, J.-C., Walter, R. & Rauw, G., 2008, A&A, 477, L29
- Manchester et al. (2005) Manchester, R.-N., et al., 2005, AJ, 129, 1993M
- Moderski et al. (2005) Moderski, R., et al., 2005, MNRAS, 363, 954M
- Murphy et al. (2007) Murphy, T., et al., 2007, MNRAS, 382,
- Nielsen et al. (2007) Nielson, K. E., et al., 2007, ApJ, 660, 669N Aharonian, F. A., 2007, ApJ, 657, 302H
- Okazaki et al. (2008) Okazaki, A. T., et al., 2008, MNRAS, 388L, 39O
- Parkin et al. (2009) Parkin, E. R., et al., 2009, MNRAS, 394, 1758P
- Pittard & Corcoran (2002) Pittard, J. M. & Corcoran, M. F., 2002, A&A, 383, 636 2002, A&A, 388, 335
- Reimer et al. (2006) Reimer, A., Pohl, M. & Reimer, O., 2006, ApJ, 644, 1118
- Seward et al. (2001) Seward, F. D., et al., 2001, ApJ, 553, 832
- Smith et al. (2003) Smith, N., et al., 2003, AJ, 125, 1458
- Smith et al. (2005) Smith, N., Morse, J. A. & Bally, J., AJ, 130, 1778
- Smith (2008) Smith, N., 2008, Nature, 455, 201
- Tavani et al. (2009) Tavani, M., et al., 2009, ApJ, 698, L142
- Vannoni et al. (2009) Vannoni, G., Gabici, S. & Aharonian, F. A. 2009, A&A, 497, 17V Conference Series, 774, 241
- Vink (2005) Vink, J., 2005, American Institute of Physics Conference Series, 774, 241
- Vink et al. (2006) Vink, J., et al., 2006, ApJ, 648, L33
- Viotti et al. (2002) Viotti, R. F., et al., 2002, A&A, 385, 874
- Viotti et al. (2004) Viotti, R. F., et al., 2004, A&A, 420, 527
- Walborn et al. (1978) Walborn, N. R., Blanco, B. M. & Thackeray, A. D., 1978, ApJ, 219, 498W
- Whitelock et al. (1994) Whitelock, P. A., et al., 1994, MNRAS, 270, 364
- Whitelock et al. (2004) Whitelock, P. A., et al., 2004, MNRAS, 352, 447