Microscopic Inhomogeneity and Superconducting Properties of a Two-dimensional Hubbard Model for High- Cuprates
Abstract
Recent scanning tunneling microscopy measurements on cuprate superconductors have revealed remarkable spatial inhomogeneities in the single-particle energy gap. Using cellular dynamical mean-field theory, we study the zero temperature superconducting properties of a single-band Hubbard model with a spatial modulation of the electron density. We find that the inhomogeneity in the electronic structure results in a substantial spatial variation in the superconducting order parameter and single-particle energy gap, reminiscent of the experimental results. In particular, we find that the order parameter and gap amplitudes in the hole-rich regions are significantly enhanced over the corresponding quantities in a uniform system, if the hole-rich regions are embedded in regions with smaller hole density.
pacs:
71.10.Fd, 74.20.-z, 74.81.-gI Introduction
The field of strongly correlated electron systems has been one of the most active areas of materials science for decades.Imada98 In particular, transition-metal oxides including high- cupratesBednorz96 and colossal magnetoresistance manganites are fascinating both from fundamental science and practical application points of view. Recent experimental studies revealed that various transition-metal oxides exhibit spatial inhomogeneity in the electronic structure.Dagotto05 For the cuprates, such inhomogeneity has been reported to have random, checkerboard or stripe-type spatial modulation.Lang02 ; Vershinin04 ; Hanaguri04 ; Kohsaka07
Although its origin and physical properties remain a center of debate, it is clear that spatial inhomogeneity in the cuprates greatly affects the superconducting properties.McEloy05 ; Gomes07 ; Pasupathy08 ; Slezak08 ; Parker10 One of the most intriguing experimental observations is the positive correlation between the superconducting gap and the oxygen dopant atoms McEloy05 and the anticorrelation with the distance between a Cu atom and an apical O atom, , in the scanning tunneling microscopy (STM) experiments.Slezak08 Based on an early mean-field study of an inhomogeneous model, Wang et al.Wang02 conjectured that the inhomogeneity arises from variations in the local oxygen dopant level. Other papers have addressed the inhomogeneity by introducing variations in coupling constants on a phenomenological mean-field level.Andersen07 ; Yang07 More recently, Mori et al.Mori08 proposed a link between the variation in pairing interactions and the position of out-of-plane oxygen atoms, that involves the covalency between the in-plane band and the apical orbitals, and the screening of the in-plane Coulomb repulsion on the Cu orbitals by the apical oxygen polarization. Here we study this problem in a microscopic model with inhomogeneity in the electronic structure using a non-perturbative approach that goes beyond a static mean-field treatment.
In particular, we investigate the effect of spatial inhomogeneity in the electronic structure on the superconducting (SC) properties of a Hubbard model using cellular dynamical mean-field theory (CDMFT).Kotliar01 ; Kotliar06 Motivated by the result in Wang et al. Wang02 and Mori et al. Mori08 where out-of plane dopant atoms affect the in-plane hole density, we consider a two-dimensional Hubbard model with planar density modulations. We find that the -wave gap amplitude is significantly increased in regions with increased hole density, if they are surrounded by regions with smaller hole density. The spatial modulation of the gap is found to become as large as a factor 2 and goes well beyond the variation one would expect from the difference in hole density. The SC order parameter also shows similar variation. The enhanced -wave gap in the overdoped region is consistent with the experimental reports if the main effect of oxygen atoms is to locally increase the hole concentration.McEloy05 ; Slezak08
II Model and method
We consider a two-dimensional (2D) Hubbard model for the Cu electrons:
| (1) |
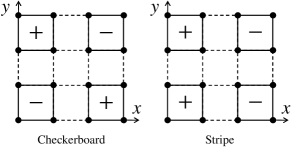
Here, is the annihilation operator of an electron with spin at site , , the nearest-neighbor transfer integral, and the on-site repulsive Coulomb interaction. Here, only the nearest-neighbor hopping is included. is a site-dependent on-site potential, leading to a spatial inhomogeneity in the hole density. We consider two types of potential modulations as illustrated in Fig. 1. A checkerboard-type variation in the local potential where alternates between and on 22 plaquettes and a stripe-like variation in which the modulation is unidirectional.
We study the zero temperature SC properties of the uniform and inhomogeneous systems using the CDMFT. For a uniform system, the CDMFT maps the bulk lattice onto a cluster embedded in a dynamic mean-field that describes the rest of the system and is determined self-consistently. Here, we use a small 22 cluster. This approximation may be justified in the strong-coupling limit, in which the coherence length becomes sufficiently small so that the superconducting behavior is well approximated on a 22 plaquette. In addition, the small cluster size allows us to solve the effective cluster problem using the Lanczos exact diagonalization (ED) technique Caffarel94 ; Kancharla08 to directly access dynamical quantities such as the density of states without additional analytic continuation.
For the inhomogeneous system, we map the lattice onto a number of in-equivalent 22 clusters, indicated by the bold lines in Fig. 1, where is the number of clusters per unit cell. In our case we have . In this approximation, the self-energy depends on the cluster index and the intracluster coordinates . This means that dynamic correlations are retained within a cluster, but neglected between the clusters.Potthoff99 ; Okamoto04b The clusters are then linked by the self-consistency condition. This approach can be regarded as a cluster extension to the DMFT study of stripes in Ref. Fleck00, . The choice of clusters may not be unique. For example, one may take clusters comprised of two sites of the region and two sites of the region. However, in this case, the local symmetry inside the cluster is severely broken. We expect this to give rise to a strong suppression of -wave pairing inside the cluster. Hence this choice would not allow us to explore the physics we set out to explore, such as the modulation of a local pairing gap through the proximity to a region with different doping.
With our choice of clusters, the impurity Hamiltonian is given by
| (2) | |||||
Here, represents the lattice Hamiltonian, Eq. (1), restricted to the th region . We introduced two kinds of bath orbitals , which describe the rest of the system and whose energy level and hybridization strength with a cluster site are given by and , respectively. Thus, our cluster model consists of four interacting orbitals and eight bath orbitals. We also introduced two parameters representing the superconducting correlations for bath , and . For the uniform system and the checkerboard-type potential, the local tetragonal symmetry is retained and therefore for the -wave pairing. On the other hand in the stripe-type potential, the tetragonal symmetry is broken and and are independent parameters. Even in this case, the difference between and was found to be very small.
The self-consistency condition of the ED CDMFT is closed using the conjugate gradient minimization algorithm with a distance function defined on an imaginary frequency axis with the effective inverse temperature , and short cut-off frequency .Kancharla08 We set the Coulomb repulsion to and note that our results are insensitive to this choice as long as is sufficiently large. Potential modulation will be at most on the order of , and Hubbard bands do not overlap with the low-energy quasiparticle part. Therefore, the effect of the short cut-off frequency is expected to be small.
III Results
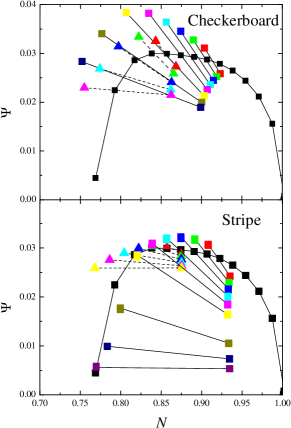
Numerical results for the -wave SC order parameter as a function of carrier concentration for the uniform system are shown as black dots in Fig. 2. These results are in excellent agreement with the previous work by Kancharla et al.Kancharla08 We find an optimal carrier density which maximizes and the superconductivity vanishes for densities smaller than .
We now turn to the results for the inhomogeneous systems for the checkerboard and stripe-like modulations as shown in Fig. 1. We plot the order parameter of cluster , , at the corresponding densities in Fig. 2 as colored (shaded) symbols connected by thin lines. One clearly observes that in the cluster with lower electron filling (larger hole density) is significantly enhanced over that in the uniform system at the same filling. For a range of fillings, it becomes even larger than the maximum value for the uniform system. At the same time, in the cluster with the larger filling is reduced relative to the homogeneous system. Potential modulation, chemical potential, and the resulting carrier densities and SC order parameters are summarized in Table 1. Here, corresponds to the cluster in which the potential is increased (decreased) by , thus . In the actual computations, we fix and vary . One can also see that recovers the uniform system.
| 2.4 | 0 | 0.939 | 0.939 | 0.0265 | 0.0265 |
|---|---|---|---|---|---|
| 2.25 | 0.15 | 0.904 | 0.923 | 0.0311 | 0.0258 |
| 2.2 | 0.2 | 0.890 | 0.919 | 0.0328 | 0.0252 |
| 2.15 | 0.25 | 0.874 | 0.915 | 0.0345 | 0.0245 |
| 2.1 | 0.3 | 0.856 | 0.911 | 0.0364 | 0.0236 |
| 2.05 | 0.35 | 0.835 | 0.907 | 0.0382 | 0.0226 |
| 2.0 | 0.4 | 0.807 | 0.903 | 0.0384 | 0.0213 |
| 1.95 | 0.45 | 0.777 | 0.900 | 0.0340 | 0.0200 |
| 1.9 | 0.5 | 0.752 | 0.899 | 0.0284 | 0.0190 |
| 2.0 | 0 | 0.875 | 0.875 | 0.0296 | 0.0296 |
| 1.9 | 0.1 | 0.843 | 0.868 | 0.0325 | 0.0273 |
| 1.85 | 0.15 | 0.822 | 0.865 | 0.0334 | 0.0259 |
| 1.8 | 0.2 | 0.797 | 0.863 | 0.0314 | 0.0241 |
| 1.75 | 0.25 | 0.774 | 0.862 | 0.0269 | 0.0226 |
| 1.7 | 0.3 | 0.755 | 0.862 | 0.0230 | 0.0215 |
| 2.3 | 0.1 | 0.908 | 0.935 | 0.0307 | 0.0305 | 0.0241 | 0.0243 |
| 2.25 | 0.15 | 0.892 | 0.934 | 0.0318 | 0.0316 | 0.0228 | 0.0230 |
| 2.2 | 0.2 | 0.875 | 0.933 | 0.0323 | 0.0319 | 0.0214 | 0.0216 |
| 2.15 | 0.25 | 0.857 | 0.933 | 0.0320 | 0.0317 | 0.0200 | 0.0201 |
| 2.1 | 0.3 | 0.839 | 0.932 | 0.0310 | 0.0306 | 0.0183 | 0.0185 |
| 2.05 | 0.35 | 0.820 | 0.932 | 0.0286 | 0.0281 | 0.0163 | 0.0165 |
| 2.0 | 0.4 | 0.800 | 0.934 | 0.0177 | 0.0174 | 0.0105 | 0.0106 |
| 1.95 | 0.45 | 0.784 | 0.935 | 0.0099 | 0.0099 | 0.0073 | 0.0074 |
| 1.9 | 0.5 | 0.770 | 0.935 | 0.0056 | 0.0058 | 0.0053 | 0.0053 |
| 1.95 | 0.05 | 0.857 | 0.875 | 0.0303 | 0.0303 | 0.0290 | 0.0290 |
| 1.9 | 0.1 | 0.840 | 0.875 | 0.0304 | 0.0303 | 0.0283 | 0.0283 |
| 1.85 | 0.15 | 0.822 | 0.875 | 0.0299 | 0.0299 | 0.0276 | 0.0277 |
| 1.8 | 0.2 | 0.804 | 0.875 | 0.0290 | 0.0289 | 0.0270 | 0.0270 |
| 1.75 | 0.25 | 0.786 | 0.875 | 0.0276 | 0.0275 | 0.0263 | 0.0264 |
| 1.7 | 0.3 | 0.768 | 0.875 | 0.0259 | 0.0259 | 0.0259 | 0.0259 |
This enhancement of superconductivity is similar to that observed in our previous study of superlattices made up of underdoped and overdoped Hubbard layers.Okamoto08 There we argued that the enhancement in the overdoped layers was due to their proximity to the larger pairing scale in the underdoped layers. The similarity between the two results and the nature of approximation lead us to speculate that the origin of the increased order parameter in the present study has similar origin.
To support this conjecture, we plot the results for the system with the stripe-like modulation in the lower panel of Fig. 2. The corresponding numerical data are listed in Table 2. Here, we plot both and . However, the difference between them is at most and therefore the corresponding points are almost indistinguishable (see also Table 2). As in the checkerboard case, the order parameter is enhanced in the cluster with larger hole doping. However, it is clear that the enhancement is significantly weaker than in the former case with checkerboard-type potential. For the checkerboard modulation, the maximum is about 30 % larger than the maximum value in the uniform system, while in the striped case the enhancement is about 10 %. We believe that this difference comes from the fact that, for the checkerboard modulation, the hole-rich cluster is fully surrounded by hole-poor clusters, which have a larger pairing scale.Maier06 On the other hand, in the striped case, the hole-rich cluster is in proximity to only two hole-poor clusters and also two hole-rich clusters, which reduces the effect. In both cases, in the hole-poor clusters is decreased significantly by the coupling with the hole-rich clusters. The reduction is stronger in the stripe-type potential. This fact may partly be explained by the breaking of the local tetragonal symmetry. These results suggest that the SC order parameter is quite sensitive to the local environment.
It is also interesting to discuss the dependence of the order parameters in the hole-rich, , and hole-poor regions, , with increasing potential , or equivalently, decreasing filling and , respectively. With increasing and decreasing , follows the same trend as the order parameter in the homogeneous system, i.e., it first increases, then decreases with decreasing . It is enhanced over the order parameter in the uniform system through the proximity of the hole-rich region to the larger pairing scale in the hole-poor region. An optimal value of that maximizes results from a delicate balance between the proximity of the larger pairing scale from the hole-poor regions, and the reduction in the pairing scale with increasing doping in its own hole-rich region. The order parameter in the hole-poor region, in contrast, decreases monotonically with decreasing filling . This may be explained by a strong reduction in the pairing interaction in the hole-poor region by its coupling to the smaller pairing scale in the hole-rich regions.
It would be interesting to determine whether the enhancement of pairing we find in the hole-rich regions, translates to an increase in . Our zero temperature and small cluster calculations, however, do not allow us to speculate on this question. Finite temperature calculations on larger clusters similar to those carried out for a striped Hubbard model in Ref. Maier10, will be necessary to gain more insight into this question. Work along these lines is currently underway.
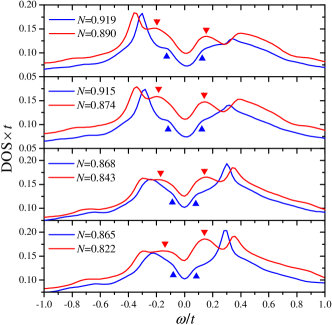
From the variation in the SC order parameter, one may expect that the -wave gap in the density of states (DOS) is also modulated in the inhomogeneous systems. To see this effect, we computed the local DOS for different strengths of the checkerboard-type potential modulations. We calculated the -space average of the momentum-dependent lattice Green’s function to obtain the local Green’s function, and the local DOS is given as its imaginary part. The lattice Green’s function has the same form as that used to close the self-consistency condition for the CDMFT but with the self-energy as a function of real frequency. When computing the self-energy, we introduced a small imaginary number on the order of to the real frequency. We confirmed that different choices of give similar results. Results presented below were obtained using . Because of the finite number of orbitals in the ED CDMFT and finite broadening , we cannot access the very low-energy behavior. Yet, we believe that the main structure of the local DOS is accessible.
Results of the local DOS are shown in Fig. 3. Each panel corresponds to a different strength of potential modulation, and the resulting electron densities in hole-rich and hole-poor clusters are indicated. One can see that the low-energy structure (peak or shoulder) for the smaller region is located at higher energy than for the larger region.
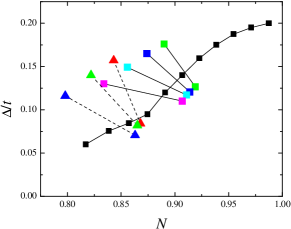
In order to see the dependence of the gap amplitude on the carrier density modulation more clearly, we plot as a function of the average density in Fig. 4 for the checkerboard-type potential modulations. Here, we defined as the half distance between the lowest energy peaks or shoulders above and below . For comparison, we also plot for the uniform system as black dots. The monotonic increase in with approaching is consistent with the previous report.Kancharla08 From this figure, one clearly sees that the gap amplitude in the hole-rich region is significantly enhanced over that in hole-poor region, as well as that of the corresponding uniform system at the same hole density. We stress here that this result is robust against the choice of broadening parameter .
From Figs. 3 and 4, we also notice that the effect of a potential modulation on the gap amplitude in the underdoped region is weaker than that on ; is reduced less than when the potential modulation exists. We argue that this is caused by a near cancellation between the reduced order parameter and the enhanced quasiparticle weight both due to the presence of the hole-rich region nearby as follows. The -wave order parameter is proportional to the anomalous self-energy at , and the real part of the self-energy is given by . The combination between the two effects leads to the gap amplitude . This insensitivity may become important to understand the doping-dependent gap amplitude in the presence of inhomogeneity.
We emphasize that the enhancement of the -wave gap in the hole-rich region relative to that in the hole-poor region is quite striking and opposite to the behavior in the uniform system. It is also contrary to the previous theoretical result based on a static mean-field theory.Wang02
IV Discussion and summary
Finally, let us briefly discuss the possible implication of the present study on the STM results. In Ref. McEloy05, , it was reported that the gap amplitude and the position of dopant oxygen atoms have positive correlation. Furthermore, in Ref. Slezak08, , an anticorrelation was reported between the gap magnitude and the distance between the Cu and apical O, . If the main effect of the dopant oxygen and shorter is to increase the local hole concentration, as reported in the calculation by Mori et al.,Mori08 our observation that the region with larger hole density (smaller filling ) has a larger gap is consistent with the experimental reports.
Estimating potential modulation from experimental data is not easy because it requires precise position of charged (dopant) ions and the electron-density modulation. But, taking the experimental uncertainty of Ref.McEloy05, , density modulation is expected to be less than 10 %. In our calculations, the potential modulation is enough to induce such a small density modulation. This ( eV) is smaller than the one simply estimated by assuming point dopant-charged ions. For example, in La2-xSrxCuO4, potential modulation due to the A-site dopant ions becomes of order of 1–2 eV with the in-plane lattice constant 4 Å and the dielectric constant .Ohta91 In reality, other effects such as the screening due to the other conduction electrons reduce the modulation. Therefore, our potential modulation must be regarded as the self-consistently determined one by including screening effects, and seems to be in the realistic range. We would like to emphasize that our results show that even a very weak density modulation, on the order of 5 % and therefore well within the experimental uncertainty, is enough to result in a significant, i.e., factor 2, variation in the local gap amplitude.
However, the variation in the gap magnitude we observe of about a factor of two is less than the factor 3 that has been reported in Refs. McEloy05, , and Slezak08, . Certainly, a single-band Hubbard model is too simple to fully resolve this issue, and additional degrees of freedom could play an important role, such as the apical oxygen as proposed in Ref. Mori08, . One possible scenario to resolve the present discrepancy is the screening effect by the oxygen ions. This reduces the on-site Coulomb interaction, resulting in a further enhancement of the superconducting order parameter and the -wave gap within the strong-coupling regime.Kancharla08
As reported in the STM measurements in Ref. Gomes07, , both the average gap amplitude and the width and asymmetry of the distribution of gap magnitudes increase as the doping decreases, with long tails on the large gap side of the distribution. Assuming that the observed inhomogeneity is related to a carrier-density modulation, our study can provide a possible explanation. Based on our results, we can speculate that the large gap tail in the underdoped samples originates from hole-rich islands with large gaps residing in the hole-poor environment. The strong asymmetry is naturally expected because the volume fraction of the large-gap hole-rich regions is small because of the small average hole concentration.
Recently, Parker and coworkersParker10 studied the gap-amplitude modulation in the over-doped cuprates Bi2Sr2CaCu2O8+δ as a function of temperature. It was revealed that medium-sized gap regions surrounded by large-gap regions persist to higher temperatures than regions with similar gap sizes in the proximity of small-gap regions. We speculate that both the large-gap and medium-gap regions are over-doped and the former is closer to the optimal doping. Thus, the proximity effect is weaker compared with that between under-doped regions and over-doped regions as we studied in this paper. To confirm this conjecture, it is necessary to make a link between the gap amplitude and the local carrier density. It is also desirable to perform the similar experimental analysis using the under-doped and near-optimally-doped cuprates.
To summarize, we have studied the superconducting properties of an inhomogeneous two-dimensional Hubbard model for the high- cuprates with modulations in the electronic hole density using a cellular dynamical mean-field approximation. We have found that the modulation in hole density results in a considerable spatial variation in the superconducting order parameter which is quite sensitive to the local environment. In particular, the order parameter in the hole-rich regions is significantly enhanced over the order parameter in a corresponding uniform system, if the hole-rich region is embedded in a region with smaller hole-density. Furthermore, we have found that the -wave gap amplitude in the density of states shows similar modulation, with an enhanced gap in the hole-rich regions. These results are reminiscent of the variation in gap amplitudes reported in recent STM measurements of cuprate superconductors.
Acknowledgements.
The authors would like to thank D. J. Scalapino, J. C. Davis, and A. Yazdani for valuable discussions. This work was supported by the Materials Sciences and Engineering Division, Office of Basic Energy Sciences, U.S. Department of Energy. A portion of this research at Oak Ridge National Laboratory’s Center for Nanophase Materials Sciences was sponsored by the Scientific User Facilities Division, Office of Basic Energy Sciences, U.S. Department of Energy.References
- (1) M. Imada, A. Fujimori, and Y. Tokura, Rev. Mod. Phys. 70, 1039 (1998).
- (2) J. G. Bednorz and K. A. Müller, Z. Phys. B 64, 189 (1986).
- (3) E. Dagotto, Science 309, 257 (2005).
- (4) K. M. Lang, V. Madhavan, J. E. Hoffman, E. W. Hudson, H. Eisaki, S. Uchida, and J. C. Davis, Nature (London) 415, 412 (2002).
- (5) M. Vershinin, S. Misra, S. Ono, Y. Abe, Y. Ando, and A. Yazdani, Science 303, 1995 (2004).
- (6) T. Hanaguri, C. Lupien, Y. Kohsaka, D.-H. Lee, M. Azuma, M. Takano, H. Takagi, J. C. Davis, Nature (London) 430, 1001 (2004).
- (7) Y. Kohsaka, C. Taylor, K. Fujita, A. Schmidt, C. Lupien, T. Hanaguri, M. Azuma, M. Takano, H. Eisaki, H. Takagi, S. Uchida, J. C. Davis, Science 315, 1380 (2007).
- (8) K. McElroy, J. Lee, J. A. Slezak, D.-H. Lee, H. Eisaki, S. Uchida, J. C. Davis, Science 309, 1048 (2005).
- (9) K. K. Gomes, A. N. Pasupathy, A. Pushp, S. Ono, Y. Ando, A. Yazdani, Nature (London) 447, 569 (2007).
- (10) A. N. Pasupathy, A. Pushp, K. K. Gomes, C. V. Parker, J. Wen, Z. Xu, G. Gu, S. Ono, Y. Ando, A. Yazdani, Science 320, 196 (2008).
- (11) J. A. Slezak, J. Lee, M. Wang, K. McElroy, K. Fujita, B. M. Andersen, P. J. Hirschfeld, H. Eisaki, S. Uchida, and J. C. Davis, Proc. Natl. Acad. Sci. U.S.A. 105, 3203 (2008).
- (12) C. V. Parker, A. Pushp, A. N. Pasupathy, K. K. Gomes, J. Wen, Z. Xu, S. Ono, G. Gu, and A. Yazdan, Phys. Rev. Lett. 104, 117001 (2010).
- (13) Z. Wang, J. R. Engelbrecht, S. Wang, H. Ding, and S. H. Pan, Phys. Rev. B 65, 064509 (2002).
- (14) B. M. Andersen, P. J. Hirschfeld, J. A. Slezak, Phys. Rev. B 76, 020507(R) (2007).
- (15) K.-Y. Yang, T. M. Rice, and F-C. Zhang, Phys. Rev. B 76, 100501(R) (2007).
- (16) M. Mori, G. Khaliullin, T. Tohyama, and S. Maekawa, Phys. Rev. Lett. 101, 247003 (2008).
- (17) G. Kotliar, S. Y. Savrasov, G. Pálsson, and G. Biroli, Phys. Rev. Lett. 87, 186401 (2001).
- (18) G. Kotliar, S. Y. Savrasov, K. Haule, V. S. Oudovenko, O. Parcollet, C. A. Marianetti, Rev. Mod. Phys. 78, 865 (2006).
- (19) M. Caffarel and W. Krauth, Phys. Rev. Lett. 72, 1545 (1994).
- (20) S. S. Kancharla, B. Kyung, D. Sénéchal, M. Civelli, M. Capone, G. Kotliar, A.-M. S. Tremblay, Phys. Rev. B 77, 184516 (2008).
- (21) M. Potthoff and W. Nolting, Phys. Rev. B 59, 2549 (1999).
- (22) S. Okamoto and A. J. Millis, Phys. Rev. B 70, 241104(R) (2004).
- (23) M. Fleck, A. I. Lichtenstein, E. Pavarini, and A. M. Oleś, Phys. Rev. Lett. 84, 4962 (2000).
- (24) S. Okamoto and T. A. Maier, Phys. Rev. Lett. 101, 156401 (2008).
- (25) T. A. Maier, M. Jarrell, and D. J. Scalapino, Phys. Rev. B 74, 094513 (2006).
- (26) T. A. Maier, G. Alvarez, M. Summers, and T. C. Schulthess, Phys. Rev. Lett. 104, 247001 (2010).
- (27) Y. Ohta, T. Tohyama, and S. Maekawa, Phys. Rev. B 43, 2968 (1991).