Vol.0 (200x) No.0, 000–000
11institutetext: National Astronomical Observatories/Yunnan Observatory,
CAS, Kunming 650011, China
lkj@ynao.ac.cn
22institutetext: Key Laboratory of Solar Activity, National Astronomical
Observatories, Chinese Academy of Sciences
33institutetext: Department of Physics, Yunnan Normal University, Kunming 650093, China
44institutetext: Research Center for Analysis and Measurement, Kunming University of
Science and Technology, Kunming 652094, China
The Phase Shifts of the Paired Wings of Butterfly Diagrams
Abstract
Sunspot groups observed by Royal Greenwich Observatory/US Air Force/NOAA from May 1874 to November 2008 and the Carte Synoptique solar filaments from March 1919 to December 1989 are used to investigate the relative phase shift of the paired wings of butterfly diagrams of sunspot and filament activities. Latitudinal migration of sunspot groups (or filaments) does asynchronously occur in the northern and southern hemispheres, and there is a relative phase shift between the paired wings of their butterfly diagrams in a cycle, making the paired wings spatially asymmetrical on the solar equator. It is inferred that hemispherical solar activity strength should evolve in a similar way within the paired wings of a butterfly diagram in a cycle, making the paired wings just and only keep the phase relationship between the northern and southern hemispherical solar activity strengths, but a relative phase shift between the paired wings of a butterfly diagram should bring about an almost same relative phase shift of hemispheric solar activity strength.
keywords:
Sun:activity–Sun:general–Sun:sunspots1 Introduction
Sunspots are distributed themselves on the Sun with a complex spatial and temporal behavior. As for the spatial (latitudinal) evolutional behavior, they display an evolution in the course of a solar cycle to form a Maunder “butterfly diagram” (Maunder 1904, 1913, 1922; Hathaway 2010). As for the long-term temporal evolutional behavior of sunspots’ occurrence, the widely known feature is their approximately 11-year Schwabe cycle (Schwabe 1843; Carrington 1858). It is found that the paired wings of a Maunder “butterfly diagram” are different from each other, that is the well-known north – south asymmetry of solar activity (Newton Milson 1955; Li et al. 2002b; Carbonell et al. 2007). Solar activity is found slightly asynchronous in period phase between the solar northern and southern hemispheres (Zolotova Ponyavin 2006, 2007; Donner Thiel 2007; Li 2008), and the north – south asymmetry of solar activity is related to the relative phase shifts of solar activity in the northern and southern hemispheres (Waldmeier 1957, 1971; Temmer et al. 2002, 2006). Phase shifts (or phase differences) between the northern and southern hemispherical solar activity strength should have a consequence: the hemisphere preceding in time is more active at the ascending branch of a sunspot cycle, whereas at the descending branch it is the hemisphere following in time (Waldmeier 1971). However, the minima of sunspot activity are usually in phase, which might reveal a kind of “cross-talk” between the northern and southern hemispheres at the end of a solar cycle (Temmer et al. 2006), that is to say, phase shifts should have solar activity strength at the end of one cycle in the preceding hemisphere to overlay that at the beginning of the next cycle in the following hemisphere. Using the monthly number of sunspot groups respectively in the northern and southern hemispheres in cycles 12 to 23, the number of filaments respectively in the two hemispheres in Carrington rotations 876 to 1823 covering cycles 16 to 21, the monthly mean northern and southern hemispheric sunspot numbers in cycles 19 to 23, the monthly mean northern and southern hemispheric sunspot areas in cycles 12 to 23, and the monthly mean northern and southern hemispheric flare indices in cycles 20 to 23, Li (2009) found that solar activity strength does asynchronously occur in the northern and southern hemispheres, and there is a systematic time delay between the two hemispheres in a cycle. It should be emphasized that the above five solar indices reveal some kinds of solar activity “strength” (amplitude) varying with time.
A relative phase shift of hemispherical solar activity strength should have an other consequence: “the distance from the equator of the zone of activity is smaller during the whole cycle for the hemisphere preceding in time than for the hemisphere following in time” (Waldmeier 1971). However, to validate such a consequence it must be assumed that a relative phase shift of hemispheric solar activity strength should be kept in the paired wings of a butterfly diagram, namely, a relative phase shift of the paired time series (hemispherical solar activity strength) should exist in the corresponding spacial distribution of the paired wings.
Solar activity strength is usually embedded into butterfly diagrams of solar activity. A systematic time delay between the northern and southern hemispheric solar activity strengths (e.g. the aforementioned five indices) in a cycle does not indicate the existence of a relative shift in the paired wings of the corresponding butterfly diagram of solar activity in the cycle, a spacial (latitudinal) distribution of solar activity. Even if the paired wings of a butterfly diagram of solar activity in a cycle have no relative shift, a systematic time delay can exist between the hemispheric solar activity strengths in the cycle, and vice versa. That is to say, we can not infer whether a phase lag (or lead) exist in a pair of wings of solar activity from a known phase lag (or lead) of the corresponding hemispherical solar activity strength, and vice versa. Relative phase shifts between the paired time series of hemispheric solar activity strength may be independent to relative phase shifts between the paired wings of the corresponding butterfly diagram of solar activity, and the above assumption should not be spontaneously true. Therefore, it is still needed to investigate phase shifts in the paired wings of butterfly diagrams of solar activity, although phase shifts of hemispherical solar activity strength have been already investigated. Thus, in the present study we will directly investigate relative phase shifts in the paired wings of butterfly diagrams of both sunspot and filament activities, and further compare them with the relative phase shifts in the hemispherical sunspot and filament activity strengths.
2 The relative phase shifts of the paired wings of butterfly diagrams
2.1 Sunspot butterfly diagram
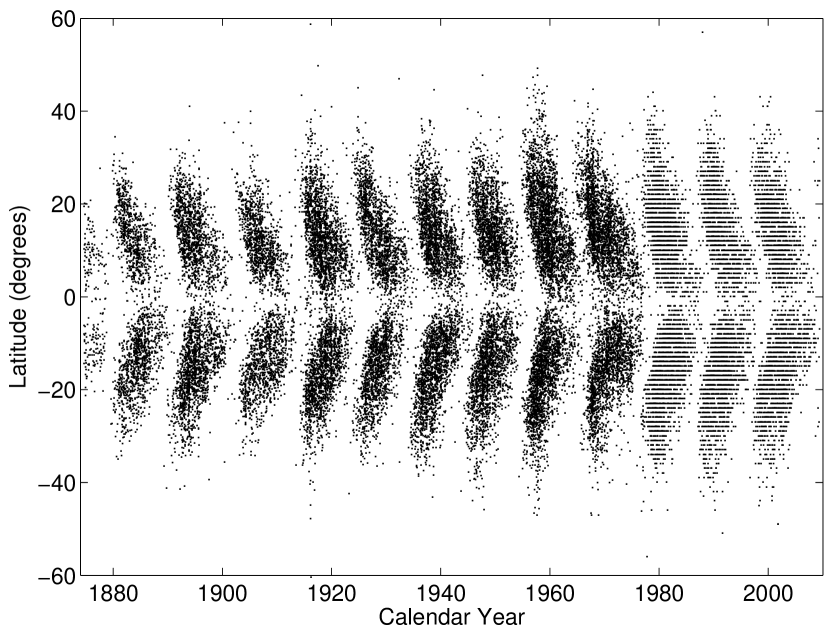
The observational data of sunspot groups used in the present study come from Royal Greenwich Observatory/US Air Force/NOAA sunspot record data set111http://solarscience.msfc.nasa.gov/greenwch.shtml. The used data set comprises sunspot groups during the period of May 1874 to November 2008 and covers solar cycles 12 to 23. Based on the data set, a new data set is generated, in which each of all sunspot groups is counted once (reserved is the first appearance of a sunspot group in the new database), even though it was recorded several times (or more) in the old data set, because it was observed in several days (or more) when it passed through the solar disk. We plotted individual sunspot groups in the new data set in the latitude – time coordinate system. Figure 1 shows the resulting latitudinal drift of sunspot group occurrence, which is called the butterfly diagrams of sunspot groups. The figure obviously shows some features, such as sunspot group occurrence in two zones parallel to the solar equator whose latitudes are hardly greater than . The difference in appearance between the first ten butterfly diagrams and the last three is due to the fact that latitude values of sunspot groups are expressed in one decimal digit before the year 1976, but since then they are given without any decimal digit.
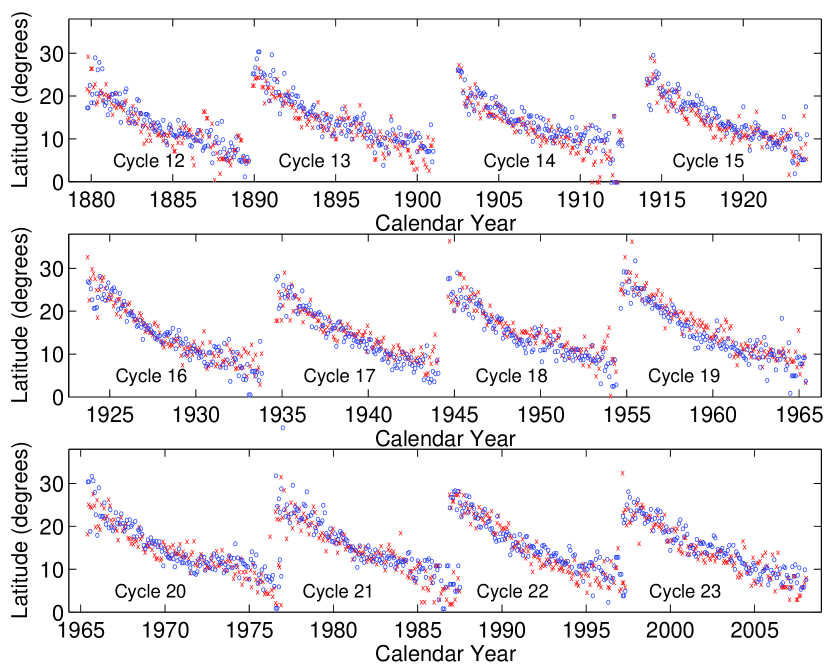
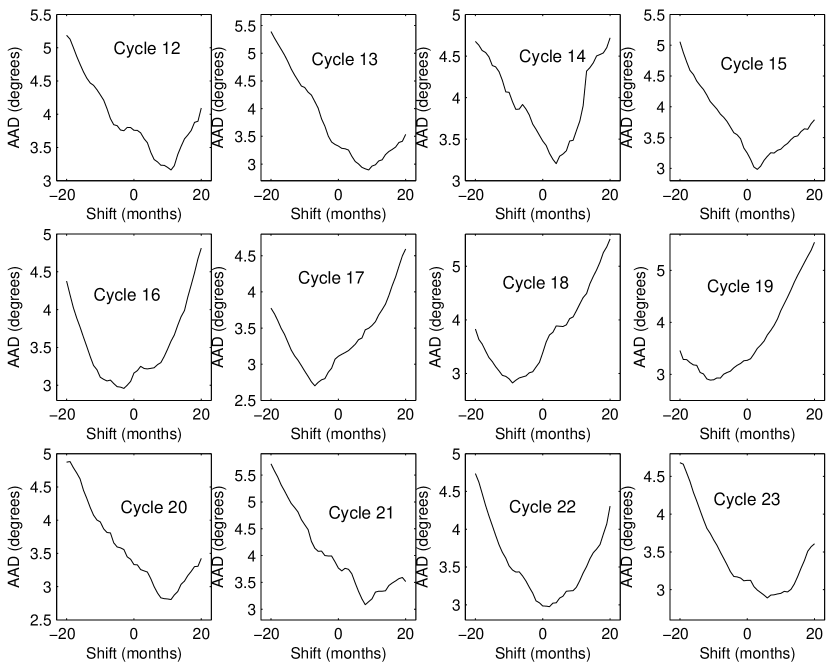
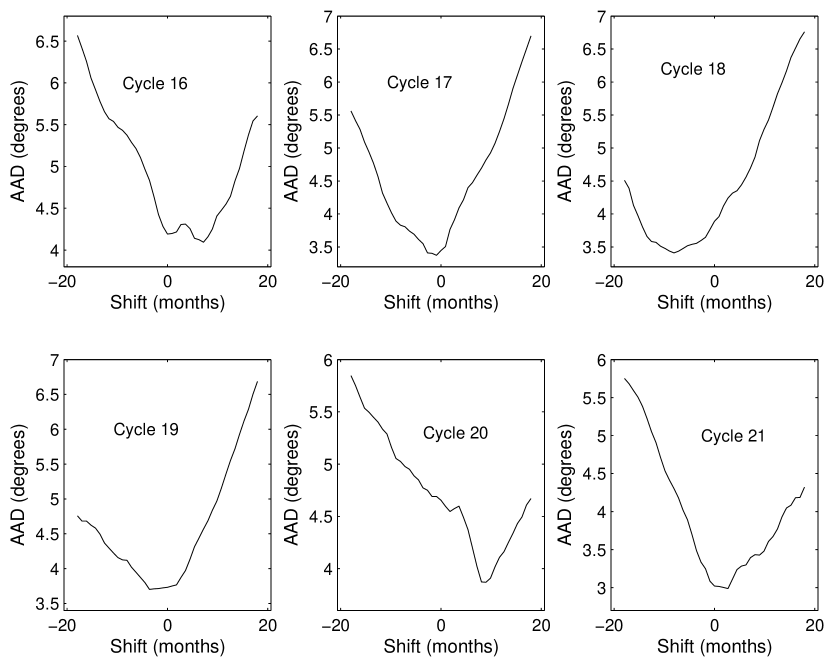
It is difficult to accurately divide sunspot groups into solar cycles to which they really belong (Harvey 1992). According to the criterion for dividing sunspots into associated cycles, proposed by Li et al. (2001) (in which latitudes should be a function of time from sunspot cycle minimum), sunspot groups are roughly divided into individual butterflies. The monthly mean latitudes of sunspot groups respectively in the northern and southern hemispheres, marked respectively by and , are calculated and then plotted in Figure 2. Their corresponding standard errors are also calculated and marked respectively by and . Although we distinguish the hemispheric labeling of the monthly mean latitudes by different marks and colors in the figure, a monthly mean latitude at north or south is plotted and will be used to calculate in the following as the same value of and so forth. The criterion somewhat avoid the so-called “cross-talk” of solar activity between the northern and southern hemispheres at the end of a cycle. Then we calculate the average of the absolute values of the differences () between the monthly mean latitudes of sunspot groups respectively in the northern and southern hemispheres in each of cycles 12 to 23. Next, the wholly northern-hemispheric monthly mean latitudes in each cycle are one-month shifted with respect to the corresponding wholly southern-hemispheric monthly mean latitudes along the calendar time axis, and then we get a new value of . Next again, the former are two-month shifted, and a new value of is obtained again, and so on and so forth. Resultantly, Figure 3 shows the average of the absolute values of the differences () between the monthly mean latitudes of sunspot groups respectively in the northern and southern hemispheres in each of cycles 12 to 23, varying with relative phase shifts. In the figure the abscissa indicates the relative shift of the wholly northern-hemispheric monthly mean latitudes with respect to the wholly southern-hemispheric monthly mean latitudes along the calendar time axis, with negative values representing backward shifts. When we do the above calculation, only those paired data are used, that is to say, if only one hemisphere has one datum at a certain time, then the datum at the time is not used to calculate the average.
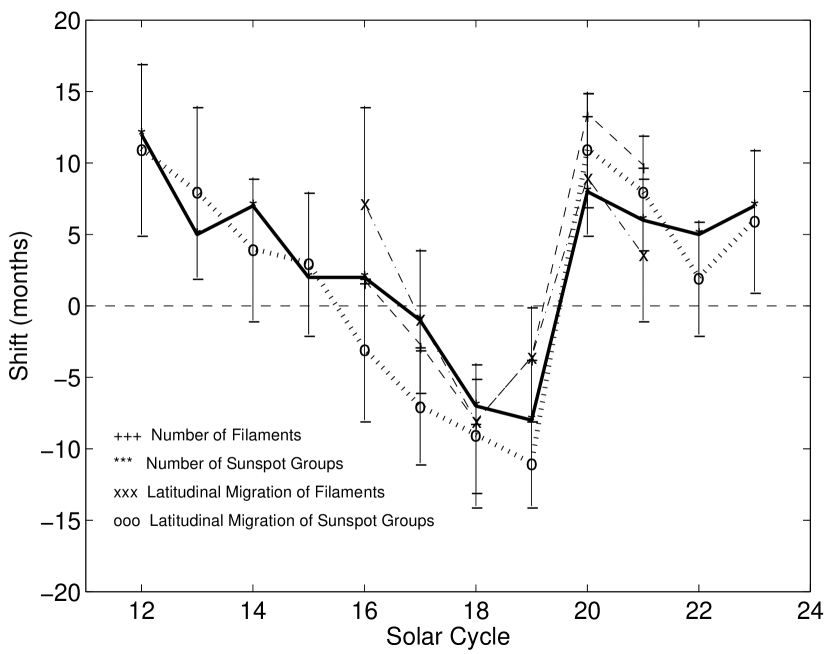
Figure 4 shows the relative shift corresponding to the minimum in each cycle. In order to estimate error in the relative shift, similarly, the time series vs are used to calculate their , and then we get the relative shift corresponding to the minimum in each cycle. vs have 4 different pained combinations, finally giving 4 relative shifts in each cycle. Among the four relative shifts, the maximum (minimum) one corresponds to the upper (lower) limit of an error bar, which is shown in Figure 4. As the figure shows, the latitude migration of sunspot groups does not synchronously occur in the northern and southern hemispheres, and there is a relative shift between the paired wings of a butterfly diagram in a cycle. Further, the relative shifts running from cycles 20 to 23 seem to repeat the shifts in cycles 12 to 15, implying a possible period of about 8 cycles. In such a period, the relative shifts dynamically drift from the obvious northern hemispheric lead to the clear southern hemispheric lead. Also shown in the figure is the systematic time delay between the monthly numbers of sunspot groups respectively in the northern and southern hemispheres in each of cycles 12 to 23 (Li 2009). As Figure 4 shows, the relative shift between the monthly mean latitudes of sunspot groups respectively in the northern and southern hemispheres in a cycle seems to have a value very close to the systematic time delay between the monthly numbers of sunspot groups in the northern and southern hemispheres in the cycle. It is thus inferred that hemispherical solar activity strength should evolve in a similar way within the paired wings of a butterfly diagram in a cycle, making the paired wings just and only embody (keep) the phase relationship between the northern and southern hemispherical solar activity strengths, and a phase difference between the paired wings of a butterfly diagram, which is shown here by a relative shift between the northern and southern hemispheric latitude migrations, should bring about an almost same relative phase shift of hemispheric solar activity strength.
2.2 Filament butterfly diagram
Also utilized here is the Carte Synoptique solar filaments archive222, namely the catalogue of solar filaments from March 1919 to December 1989, corresponding to Carrington solar rotations 876 to 1823 and covering 6 complete cycles from cycles 16 to 21 (Coffey Hanchett 1998). The data of filaments span 948 Carrington rotations, corresponding to 850 months, one Carrington solar rotation is thus about 0.897 months. Using the data archive, we plot the latitude drift of filament occurrence, which is called the butterfly diagrams of filaments, shown in Figure 5. The normal solar activity is usually applied to solar active events whose latitudes are less than (Sakurai 1998; Li et al. 2002a). Similarly, we count the mean latitudes of filaments whose latitudes are less than in each of the considered Carrington rotations, respectively in the northern and southern hemispheres. They are shown in Figure 6.
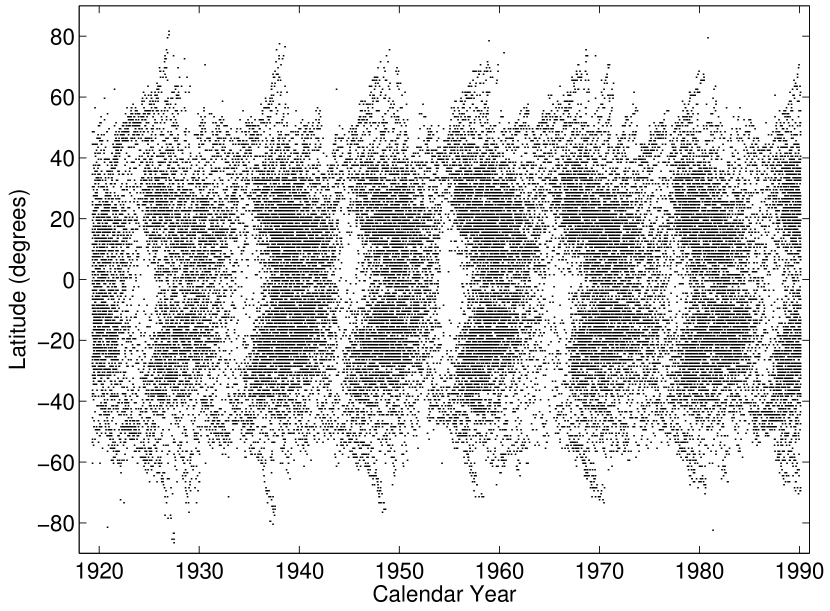
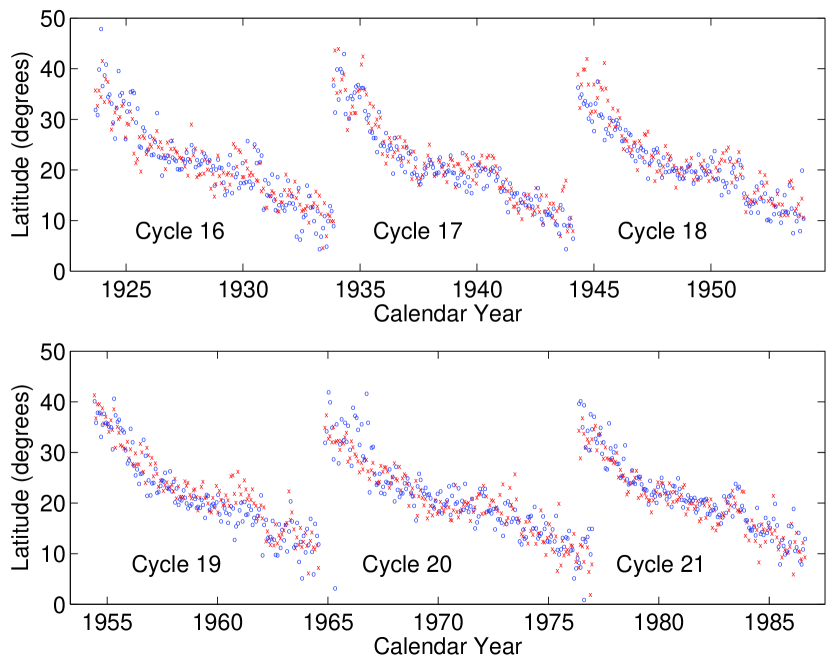
Figure 7 shows the between the mean latitudes of filaments whose latitudes are less than respectively in the northern and southern hemispheres in each of cycles 16 to 21. In the same way, the abscissa in the figure indicates the shift of the northern-hemispheric mean latitudes with respect to the southern-hemispheric mean latitudes, with negative values representing backward shifts. The relative shift corresponding to the minimum in a cycle is shown in Figure 4, and its error bar is also indicated in the figure, which is obtained in the same way as for sunspot groups mentioned above. As the figure shows, the latitude migration of filament activity does not synchronously occur in the northern and southern hemispheres, and there is a relative shift (systematic time lag or lead) between the paired wings of a filaments’ butterfly diagram in a cycle. Also shown in the figure is the systematic time delay between the numbers of filaments per Carrington rotation in the northern and southern hemispheres in each of cycles 16 to 21 (Li 2009). As Figure 4 shows, the relative shift between the mean latitudes of filaments per Carrington rotation in the northern and southern hemispheres in a cycle seems to have the almost same value as the systematic time delay between the numbers of filaments per Carrington rotation respectively in the northern and southern hemispheres in the cycle. Thus, the inference given by the above analysis to sunspot groups is valid for filament activity.
3 Conclusions and Discussions
Using the data of sunspot groups observed by Royal Greenwich Observatory/US Air Force/NOAA from May 1874 to November 2008 and the Carte Synoptique solar filaments from March 1919 to December 1989, we have found that the latitudinal migration of hemispheric solar activity (sunspot groups and filaments) does asynchronously occur in the northern and southern hemispheres, and there is a relative shift between the two hemispheres in a solar cycle, that is to say, the paired wings of a butterfly diagram have a relative shift between the northern and southern hemispheres along time scale, making the paired wings spatially asymmetrical on the solar equator. Further, for the latitudinal migration of both sunspot and filament activities, phase shifts running from cycles 20 to 23 seem to repeat those in cycles 12 to 15, implying the existence of a possible period of about 8 cycles. Waldmeier (1971) once analyzed the difference between the mean distance of the northern sunspots to the solar Equator and that of the southern sunspots to the Equator and also found the existence of a possible period of about 8 cycles. The relative shift between the monthly mean latitudes of sunspot groups (or filaments) in the northern and southern hemispheres in a cycle seems to have an almost same value as the systematic time delay between the monthly mean numbers of sunspot groups (or filaments) in the northern and southern hemispheres in the cycle. It is thus inferred that hemispherical solar activity strength of both sunspot groups and filaments should evolve in a similar way within the paired wings of a butterfly diagram in a cycle, making the paired wings just and only embody the phase relationship between the northern and southern hemispherical solar activity strengths, and a phase difference between the paired wings of a butterfly diagram, shown here by a relative shift between the northern and southern hemispheric latitude migrations of sunspot groups or filaments, should bring about an almost same relative shift of hemispheric solar activity strength. At the present, solar dynamo theory attempts to explain the north – south asymmetry of solar activity strength (Goel Choudhuri 2009), in which exists a characteristic scale of about 12 cycles. In the future, it is an important issue for solar dynamo theory to interpret the relative phase shift of the paired wings of butterfly diagrams the relative phase shift of the paired time series of hemispheric solar activity strength.
Through wavelet scale-resolved phase coherence analysis of hemispheric sunspot activity (the monthly mean numbers of sunspot areas), Donner Thiel (2007) gave in their Figure 4 the phase difference between sunspot areas respectively in the northern and southern hemispheres, which is the continuous phase shifts of sunspot areas at frequency (period) band of 8 to 14 years. For sunspot areas, phase differences are only coherent within a narrow range of frequencies, which corresponds to time scales of about 8 to 14 years, therefore, phase coherence is frequency-dependent. The continuous phase shifts are found essentially similar to the relative shift of the hemispheric latitude migration shown in Figure 4 and to that of the hemispheric sunspot and/or filament activity strength (Li 2009), and the reason why the first is similar to the latter two is inferred to that hemispheric solar activity periodically fluctuates with the quasi 11-year cycle. The phase difference between the paired wings of a butterfly diagram of solar activity should lead to phase asynchrony (shifts) of hemispheric solar activity strength, and it should be an obvious reason which causes the asynchronization of hemispheric solar activity strength.
Long-term observations of solar activity indicate that solar activity strength is asymmetrically distributed in the northern and southern hemispheres, and the north – south difference (asymmetry) of solar activity strength is a real phenomenon and not due to random fluctuations (Li et al. 2009 and references therein), that is to say, the paired wings of a butterfly diagram are different from each other in activity strength. The north-south asymmetry of sunspot latitudes has the same regularity as that of sunspot numbers and areas (Pulkkinen et al. 1999; Li et al., 2002b), so, the hemisphere with more activity would have that activity at higher latitudes. A long-term characteristic time scale of about 12 cycles should exist in the north – south asymmetry of solar activity strength (and latitudes), and the dominant hemispheres of solar activity strength (or hemispheres with higher latitudes) in a cycle regularly vary with solar cycles (Verma 1993; Li et al. 2002b), namely, long-term solar activity strength and hemispheric relative average latitude regularly runs in the solar hemispheres with a possible period of about 12 cycles. However the phase difference of the paired wings (spacial distribution) of a butterfly diagram runs in the hemispheres with a possible period of about 8 cycles. The cyclic variation of dominant hemispheres of solar activity strength seems to have little relation with the cyclic variation of the systematic time delay of solar activity (strength or latitudinal migration), and the systematic time delay of solar activity seems to have little relation with hemispheric relative latitudes, but within a cycle the north-south asymmetry of solar activity strength may be strengthened by the systematic time delay between the northern and southern hemispheric solar activity strengths (Waldmeier 1971; Li 2009) or by the phase difference in the paired wings of the butterfly diagram of solar activity in the cycle.
Acknowledgements.
We thank the two referees for their careful reading of the manuscript and constructive comments which improve the original version of the manuscript. The work is supported by the NSFC under Grants 10873032, 10921303, and 40636031, the National Key Research Science Foundation (2006CB806303), and the Chinese Academy of Sciences.References
- [Carrington(1858)] Carrington R. C., 1858, MNRAS, 19, 1
- [Carbonell(2007)] Carbonell M., Terradas J., Oliver R., Ballester J. L., 2007, , 476, 951
- [Coffey et al.(1998)] Coffey H. E., Hanchett C. D., 1998, In: David F. Webb, Brigitte Schmieder, David M. Rust, eds., New Perspectives on Solar Prominences, proceedings of a meeting held in Aussois, France, IAU Colloquium, 167, Astron. Soc. Pac., San Francisko, 488
- [Donner et al. (2007)] Donner R., Thiel M., 2007, , 475, L33
- [Harvey(1992)] Harvey K. J., 1992, in Harvey K. J., eds, ASP Conf. Ser., 27, Astron. Soc. Pac., San Francisco, 335
- [Hathaway(2010)] Hathaway, D. H., 2010, Living Review in Solar Physics, 7, 1
- [Goel et al.(2009)] Goel A., Choudhuri A. R., 2009, RAA, 9, 115
- [Li(2009)] Li K. J., 2009, Solar Phys., 255, 169
- [Li et al.(2009)] Li K. J., Gao P. X., Zhan L. S., 2009, Solar Phys., 254, 145
- [Li et al.(2002)] Li K. J., Liu X. H., Yun H. S., Xiong S. Y., Liang H. F., Zhao H. Z., Zhan L. S., Gu X. M., 2002a, PASJ, 54, 629
- [Li et al.(2002)] Li K. J., Wang J. X., Xiong S. Y., Liang H. F., Yun H. S., Gu X. M., 2002b, , 383, 648
- [Li et al.(2001)] Li K. J., Yun H. S., Gu X. M., 2001, AJ, 122, 2115
- [Li(2008)] Li Q., 2008, Solar Phys., 249, 135
- [Maunder(1913)] Maunder E. W., 1904, MNRAS, 64, 747
- [Maunder(1913)] Maunder E. W., 1913, MNRAS, 74, 112
- [Maunder(1922)] Maunder E. W., 1922, MNRAS, 82, 534
- [Newton(1955)] Newton H. W., Milson A. S., 1955, MNRAS, 115, 398
- [Pulkkinen et al.(1955)] Pulkkinen P. J., Brooke J., Pelt J., Tuominen I.,1999, , 341, L43
- [Schwabe(1843)] Schwabe H., 1843, Astron. Nachr., 21, 233
- [Sakurai(1998)] Sakurai T., 1998, Synoptic Solar Physics – 18th NSO/Sacramento Peak Summer Workshop held at Sunspot; New Mexico 8-12 September 1997. In Balasubramaniam, K.S., Jack Harvey, Rabin, D. (Ed.) ASP Conference Series, 140, 483
- [Temmer et al.(2002)] Temmer M., Veronig A., Hanslmeier A., 2002, , 390, 707
- [Temmer et al.(2006)] Temmer M., Rybak J., Bendik P., Veronig A., Vogler F., Otruba W., Potzi W., Hanslmeier A., 2006, , 447, 735
- [Waldmeier(1957)] Waldmeier M., 1957, Z. Astrophys., 43, 149
- [Waldmeier(1971)] Waldmeier M., 1971, Solar Phys., 20, 332
- [Verma(1993)] Verma V. K., 1993, ApJ, 403, 797
- [Zolotova et al.(2006)] Zolotova N. V., Ponyavin D. I., 2006, , 449, L1
- [Zolotova et al.(2007)] Zolotova N. V., Ponyavin D. I., 2007, Solar Phys., 243, 193