Host galaxies of luminous quasars: population synthesis of optical off-axis spectra
Abstract
There is increasing evidence of a connection between AGN activity and galaxy evolution. To obtain further insight into this potentially important evolutionary phase, we analyse the properties of quasar host galaxies. In this paper, we present a population synthesis modeling technique for off-axis spectra, the results of which constrain host colour and the stellar ages of luminous quasars (). Our technique is similar to well established quiescent-galaxy models, modified to accommodate scattered nuclear light (a combination of atmospheric, instrumental and host galaxy scattered light) observed off axis. In our model, subtraction of residual scattered quasar light is performed, while simultaneously modeling the constituent stellar populations of the host galaxy. The reliability of this technique is tested via a Monte-Carlo routine in which the correspondence between synthetic spectra with known parameters and the model output is determined. Application of this model to a preliminary sample of 10 objects is presented and compared to previous studies. Spectroscopic data was obtained via long-slit and integral-field unit observations on the Keck and WIYN telescopes. We confirm that elliptical quasar hosts are distinguishable (bluer) from inactive ellipticals in rest frame B-V colour. Additionally, we note a trend for radio luminous () quasars to be located in redder host galaxies in comparison to their less luminous radio counterparts. While the host colour and age of our radio luminous sample is in close proximity to the green valley, our radio faint sample is consistent with quiescent star-forming galaxies. However, further observations are needed to confirm these results. Finally, we discuss future applications for our technique on a larger sample of objects being obtained via SALT and WIYN telescope observing campaigns.
keywords:
galaxies:active – galaxies:evolution – galaxies:formation – quasars:general1 Introduction
It is well established that active galactic nucleus (AGN) activity is due to accretion onto super massive black holes (SMBHs). Additionally, SMBHs are found to be common, existing in most, if not all, massive galaxies. Observationally, the SMBH mass is found to be tightly correlated to the bulge velocity dispersion raised to the fourth power (Gebhardt et al., 2000). However, the bulge extends well outside the gravitational influence of the SMBH. This correlation has led to the hypothesis that the bulge and SMBH co-evolve (Kormendy, 2000). Additionally, models of galaxy evolution must include regulation mechanisms to adjust and quench star formation in massive galaxies after early times to prevent the over production of bright galaxies (Benson et al., 2003).
Evidence pointing toward the co-evolution of SMBHs / bulges and the need for regulation mechanisms has led to models which utilize AGN feedback to quench star formation. An example of a model of relevance to our studies is the hydrodynamic simulations of Hopkins et al. (2006). In this model, gas rich mergers induce gas inflow triggering both star formation and quasar activity. Some small percentage of AGN energy output is converted to thermal energy, assisting in the stoppage of further star formation and accretion. Simulations, which feature self-regulated SMBH growth, have been successful in reproducing various observables, such as the bimodal colour-magnitude distribution (Cattaneo et al., 2006). However these models must operate on a very large range of scales ( - ) and must incorporate many physical processes. Therefore it is desirable to further constrain these models observationally. The goal of this work is to develop an off-axis method to provide stellar age and host colour constraints during the quasar phase.
| Object name | redshift |
|
|
||||||
|---|---|---|---|---|---|---|---|---|---|
| 3C 273 | 0.1583 | -26.7 | -23.2 | 44.1 | E | ||||
| 4C 31.63 | 0.2950 | -25.1 | -25.1 | 43.3 | E | ||||
| PKS 1302-102 | 0.2784 | -25.9 | -22.9 | 43.0 | E | ||||
| PKS 0736+017 | 0.191 | -23.2 | -22.6 | 43.0 | E | ||||
| PKS 2135-147 | 0.2003 | -24.7 | -22.4 | 42.9 | E | ||||
| PKS 2349-014 | 0.1740 | -24.5 | -23.2 | 42.5 | E | ||||
| PG 1309+355 | 0.1840 | -24.4 | -22.8 | 41.3 | S | ||||
| PHL 909 | 0.171 | -24.1 | -22.2 | 40.0 | E | ||||
| PG 0052+251 | 0.1550 | -24.1 | -22.5 | 39.4 | S | ||||
| PG 1444+407 | 0.2673 | -25.3 | -22.7 | 39.2 | S |
Unfortunately, studies of the underlying stellar populations are hampered by the overwhelming emission from the central quasar. Consequentially, progress has been slow and, in some cases controversial, in the struggle to place observational constraints on quasar host galaxies. One group of collaborators (McLure et al., 1999; Hughes et al., 2000; Nolan et al., 2001; Dunlop et al., 2003) believes that local quasar () hosts are predominantly normal massive elliptical galaxies. However, Hubble Space Telescope (HST) morphology (Hooper, Impey & Foltz, 1997; Bennert et al., 2008), multicolour imaging (Jahnke, Kuhlbrodt & Wisotzki, 2004), and spectral studies (Canalizo & Stockton, 2001; Miller & Sheinis, 2003) have found evidence inconsistent with a population of normal relaxed ellipticals. In fact, an on-axis spectroscopic study probing the inner region of nearby quasar hosts found young Sc-like stellar populations in half of their sample (Letawe et al., 2007). The discrepancies in these studies may be due to relatively small sample sizes, systematics, and the different radii probed (Lacy, 2006). Additional study is required to develop a clear understanding of stellar properties of nearby luminous quasar hosts.
In Wolf & Sheinis (2008) we presented velocity dispersion measurements of a sample of nearby luminous quasar host galaxies. Future work will examine the relation between SMBH mass and velocity dispersion (Sheinis et al. 2010 in preparation). In this paper, we develop a method to measure the stellar age and colour of nearby quasar host galaxies at off-axis radii of 9 to 15 kpc. We observe off-axis spectra to minimize the observed quasar emission, thereby maximizing signal-to-noise. However even in off-axis observations, described in §2, scattered light from the central source can still contribute significantly to the observed light. Our technique of removing this scattered light is similar to previous studies (Boroson, Persson & Oke, 1985; Miller & Sheinis, 2003) and described in detail in §3.1. The modelling of the host spectra (§3.1) and the error estimation technique (§3.2) are based on quiescent galaxy models (Tremonti 2003; Cid Fernandes et al. 2005, hereafter CF05). Application of our model to our preliminary sample is found in §4. A comparison to recent spectroscopic and photometric studies is found in §5. Summary and conclusions are presented in §6. Appendix A contains comments on individual objects. Throughout this paper a cosmology of , , and is adopted.
2 Observations
2.1 Sample
Our ongoing spectroscopic observing campaign has resulted in a current sample of 28 nearby luminous quasars. This sample consists of objects previously imaged by Bahcall et al. (1997), with the addition of a few objects from Dunlop et al. (2003) and Guyon, Sanders & Stockton (2006). We demonstrate the capabilities of our spectral synthesis model on a subset of 10 objects. These objects have spectral data that display sufficient signal-to-noise and stellar continuum to constrain the stellar properties via the method discussed below. Additionally, this subset of ten objects has known stellar velocity dispersions (Wolf & Sheinis, 2008), eliminating a potential free parameter of the model. This relatively small sample of quasars is not representative of the local quasar population, which consists of 10% radio loud quasars. Our sample contains six radio loud and four radio quiet objects. We define an object as radio loud by the criteria established by Kellermann et al. (1994), , which is roughly for our adopted cosmology111Kellermann et al. (1994) observationally determined the luminosity threshold assuming a cosmology of , . We solve for the observed flux at and then convert to our adopted cosmology. The specific luminosity is multiplied by the observed frequency to obtain the quoted 5 GHz luminosity. . All quasars are local and luminous . The properties of our test sample are summarized in Table 1.
2.2 Spectra
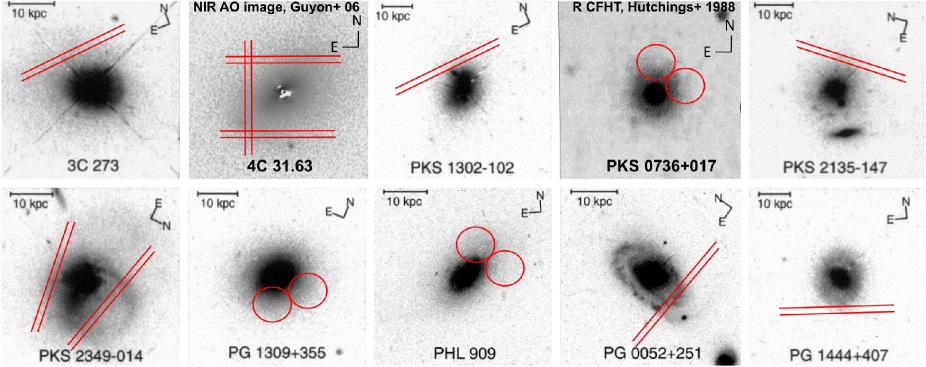
Data acquisition and reduction is described in detail in Sheinis (2002), Miller & Sheinis (2003), and Wolf & Sheinis (2008). In summary, seven of the ten objects were observed via the Low Resolution Imaging Spectrograph (Oke et al., 1994) on the Keck 10-m telescope. The remaining three objects were observed using a 82 fiber integral field unit (IFU), SparsePak (Bershady et al., 2005) which feeds the Bench Spectrograph on the 3.5-m WIYN telescope. Short on-axis observations, typically 1-2 minutes for Keck and 30 minutes for WIYN, and longer off-axis (2′′-4.5′′ from the nucleus) observations, typically 0.5 - 4 hours, were obtained for each object. The approximate off-axis slit and fiber positions with respect to archival imaging is displayed in Fig. 1. The properties of the off-axis pointings are summarized in Table 2. Keck objects have a rest wavelength range of 3500-7000Å at a spectral resolution of Å. WIYN objects have a rest wavelength range of 3500-6000Å at a spectral resolution of Å. All spectra were corrected for Galactic extinction using the law of Cardelli, Clayton & Mathis (1989) and the values from Schlegel, Finkbeiner & Davis (1998) as listed in the NASA/IPAC Extragalactic Database222http://nedwww.ipac.caltech.edu/ (NED).
| Pointing | (kpc) |
|
|
Telescope | ||||
|---|---|---|---|---|---|---|---|---|
| 3C 273 4N | 11.79 | 18.6 | 68.8% | Keck | ||||
| 4C 31.63 2N | 8.74 | 11.5 | 50.5% | Keck | ||||
| 4C 31.63 2.5E | 10.92 | 9.4 | 34.6% | Keck | ||||
| 4C 31.63 3S | 13.11 | 10.1 | 38.7% | Keck | ||||
| PKS 1302-102 2.3N | 12.79 | 9.3 | 68.4% | Keck | ||||
| PKS 0736+017 4.5NW | 14.18 | 8.3 | 49.5% | WIYN | ||||
| PKS 2135-147 3W | 12.47 | 12.3 | 70.8% | Keck | ||||
| PKS 2349-014 4N | 14.12 | 14.8 | 21.8% | Keck | ||||
| PKS 2349-014 3S | 9.47 | 18.8 | 25.2% | Keck | ||||
| PG 1309+355 4.5SW | 13.76 | 13.4 | 41.3% | WIYN | ||||
| PHL 909 4.5N | 12.97 | 11.7 | 77.8% | WIYN | ||||
| PG 0052+251 3S | 9.65 | 23.0 | 64.6% | Keck | ||||
| PG 1444+407 3S | 15.07 | 8.8 | 69.6% | Keck |
3 Spectral Synthesis
3.1 Model

Our spectral synthesis code is a modified version of the model first discussed in Miller & Sheinis (2003), with the underlying stellar spectrum now modeled as a weighted summation of 15 instantaneous starbursts of various post burst ages. We model the off-axis spectrum, which consists of a stellar component and a scattered quasar component. Quasar light is scattered into the off-axis line of sight due to atmospheric seeing effects, as well as a small contribution from the intrinsic optical point-spread function and astrophysically via dust and gas in the intervening line of sight. The stellar and scattered quasar components are modeled simultaneously to achieve the best fit to the observed spectrum. Each model spectrum is masked in the same manner as the data for which it is intended (see §4). A model spectrum is of the form:
| (1) |
with the following definitions:
-
•
is the stellar component of the model which consists of a reduced basis of 15 simple stellar populations (SSPs) from the Bruzual & Charlot (2003), BC03, synthesis model, degraded to the instrument resolution, assuming solar metallicity, Padova-1994 models, and a Chabrier initial mass function (Chabrier, 2003). Extensive simulations by CF05, have found this reduced spectral base (=0.001, 0.00316, 0.00501, 0.01, 0.02512, 0.04, 0.10152, 0.28612, 0.64054, 0.90479, 1.434, 2.5, 5, 11 and 13 Gyr) to reliably produce observed spectral features while limiting redundancies in quiescent galaxies. Due to the increased complexity introduced by the scattered light subtraction, only solar metallicity is considered. Each SSP is normalized such that the area under the unmasked portions of the spectrum is unity. Normalization at a single wavelength (=4020Å, as prescribed by CF05) was also investigated. For our sample, the alteration of normalization convention does not affect the results of our model more than 1. is the population weighting factor.
-
•
is the extinction law used to model the in situ reddening. is defined by the Galactic law of Cardelli et al. (1989) assuming the mean value of in the diffuse ISM. A single extinction is assumed for the entire stellar component.
-
•
is the on-axis observed spectrum of the quasar normalized such that the area under the unmasked portions of the spectrum is unity. is the scattering efficiency curve, which modifies the observed quasar spectrum with the goal of modeling the scattered quasar light observed off axis. We have shown that this model component is necessary to reliably remove scattered quasar light (Sheinis, 2002). The model assumes no host galaxy contamination to the on-axis spectrum. The dominance of the high luminosity quasar () on-axis makes this assumption acceptable.
Finally, the individual pieces are combined as prescribed by equation (1) and the resulting model spectrum, , is normalized, dividing by a single constant, such that the area under the unmasked portions of the spectrum is unity (the normalized model is denoted ).
3.1.1 Parameter range
Our model contains 20 free parameters: (1) an extinction parameter , (15) SSP weighting factors , (4) the scattering efficiency curve coefficients, . The range of values to explore with the model is constrained in the case of to be 0.0 to 1.0, where . The range of values for and were found in an iterative fashion. First the model was applied to the entire dataset with parameter ranges informed from the work of Sheinis (2002) and Miller & Sheinis (2003). The range was then increased as necessary to ensure the best fit was not determined by the searchable parameter space. For example, the highest model output obtained is 0.4; therefore, the model samples from 0.0 to 1.0. We have tested the sensitivity of the model output to these boundary conditions by doubling the range and re-running the model on the observed data. No significant change in results is found.
3.1.2 Parameter search
Having constructed a model, we then devised a reliable means to find the minimum chi-squared fit. The fitting function is defined by:
| (2) |
is the observed off-axis spectrum, normalized in the same manner as , and is the observed spectral noise. The noise spectrum is generated by measuring the standard deviation of at three to four locations devoid of prominent spectral features. These measurements are then extrapolated across the wavelength range of by a low order fitting polynomial.
The starting point in the parameter search is defined in the following manner. The initial stellar component is set to be 100% 5Gyr SSP. The reddening is randomly selected, constrained by its range. The scattering coefficients are also randomly selected but then scaled so that scattered quasar light comprises 60% of the off-axis model spectrum. Parameters are further constrained by rejecting any solutions which drive the resulting off-axis quasar flux, , below zero.
Simulated annealing optimization (Press, 1992) is utilized to search the 20-D parameter space. Simulated annealing evaluates the merit function, in this case, and travels downhill in merit space to find a minimum within predefined tolerances. To help avoid local minima, a user defined parameter, traditionally called ’temperature’, is set to determine the probability of travelling uphill in merit space. The higher the temperature the more probability of traveling uphill in the merit space. A zero value for temperature corresponds to a straight downhill search.
The utilization of this optimization routine, described below, is somewhat of an art. The temperature value must be decreased slowly so that the merit space can be adequately sampled, yet fast enough to arrive at a timely solution. After extensive experimentation the following implementation has been found to produce favorable results. First, twenty iterations of simulated annealing are performed with linearly decreasing temperature. If an iteration fails to find a minimum value within a factor of two of the overall minimum then the next iteration is reset to the overall minimum; otherwise the next iteration starts where the previous iteration left off. At the completion of the simulated annealing runs, the ten best distinct solutions are used as input for straight downhill (temperature = 0) runs. The current global minimum is then used as the input to the next twenty iterations of simulated annealing. This procedure is carried out for a total of three loops; within each loop the temperature parameter is set to more restrictive values. An example of this parameter space search is shown in Fig. 2 for a typical minimization. Overall approximately 150,000 points are sampled in the parameter space. This entire procedure is performed 20 times independently. The best value of these runs, which consists of approximately calculations of , is defined as the model output.
3.1.3 Quantities of interest
Guided by the analysis of CF05, we limit the scope of our project to a coarse, but well recovered, description of the stellar populations. Like CF05, we only attempt recovery of ‘young’ (t 100 Myr), ‘intermediate’ (100 Myr t 1 Gyr), and ‘old’ (t 1 Gyr) stellar contributions (, , and , respectively). Additionally, we report the mean light-weighted stellar age,
| (3) |
and the rest frame B-V colour as derived directly from the listed BC03 SSP values. These quantities have been studied extensively in quiescent galaxy samples and to a lesser extent in AGN host galaxy samples. Thus, we may assess the consistency of our results to previous AGN host studies. Furthermore, we may compare these properties of quasar host galaxies to quiescent galaxy samples. Analysis of other quantities of interest (see CF05) are deferred to future studies.
3.2 Monte-Carlo Simulations
The error in our method is estimated via a Monte-Carlo routine. Synthetic spectra, , are generated with known parameters and then degraded by noise. The same procedure used for the observed data is applied to determine the agreement between the known input and model output. In other words, replaces in the fitting routine. are constructed in the same manner as with the exception of metallicity, SSP base and added noise. Because the observed galaxies will likely include non-solar metallicities, even though the model grid does not, the metallicity is allowed to deviate from solar, and is randomly selected from and . The SSP base is extended to include all 221 BC03 instantaneous bursts assuming a Chabrier initial mass function. A synthetic spectrum is of the form:
| (4) |
Poison noise is added until the synthetic spectra obtain the corresponding observed noise as measured in the 5500-5700Å spectral window. The 5500-5700Å spectral range was selected because there are no prominent emission or absorption features; additionally, all observed spectra include this range. The value of and are randomly selected, constrained by the applicable range. Parameters are further constrained by rejecting any solutions which drive the resulting off-axis quasar flux, , below zero. The scattered quasar flux is then scaled to the contamination percentage of interest. The value of is randomly selected to uniformly sample333To uniformly sample each stellar age bin the following procedure is employed: The first of 65 synthetic spectra, , is randomly assigned a value between 0-100%. and are then randomly assigned the remaining flux. The second (third) is constructed similarly, except () is first assigned a value between 0-100%. This cycle is repeated beginning with the forth . To further illustrate the procedure let us consider the construction of the first . Suppose was assigned a value of 72%. The program populates by randomly selecting a SSP and a metallicity and then randomly assigning a percentage of the total value. This process continues until =72% to within 0.005%. and are then populated in the same manner. Thus, the stellar components of the synthetic spectra are constructed. each stellar age bin (young, intermediate, and old).
Thus, synthetic off-axis spectra are generated with generalized metallicity and SSP base. Sixty-five unique are constructed to test the ability of the model to recover known input parameters. We will use this Monte-Carlo routine first to test the associated uncertainties in a noiseless test case (§3.2.1) and the reliability to recover the scattered nuclear light (§3.2.2), before we will apply it to our actual data to determine the errors and biases in the recovered model parameters (§4).
3.2.1 Model performance given noiseless spectra
A concern regarding the use of our multi-component model is inherent degeneracies. For instance, can a young stellar population mimic scattered quasar light? The legitimacy of the model relies on the subtle differences between the various components. The reddening function, which only operates on the stellar component, should be distinct from the scattering function which operates on the observed on-axis spectrum. The absorption features in the stellar component generally do not match quasar absorption lines. The scattering function, applied to the quasar spectrum, uniquely has broad-line components. However, can quantities of interest be reliably recovered given the many possible interactions between model components?
To test the ideal performance of the model we conducted noiseless Monte-Carlo simulations. For this purpose, the Sloan Digital Sky Survey (SDSS) composite quasar spectrum (Vanden Berk et al., 2001) was utilized as the on-axis quasar spectrum, . The scattered quasar light was scaled to a value of 60%. The results of this test are shown in Fig. 3. Referring to the figure, input versus output values of , , , and B-V are shown for 65 synthetic spectra. Ideally, all points would fall on the diagonal, denoted by a dashed line (where input equals output). The mean offset from the ideal, mean(output-input), plus the standard deviation of the model output, stdev(output-input), are displayed numerically in the upper left corner and graphically by the blue strip. The fitting routine reliably recovers and B-V in the ideal case of noiseless spectra. The values of , and are less well constrained, with systematic offsets of up to 6% and one sigma deviations of up to 13.4%.
3.2.2 Scattered light verification tests
Additional Monte-Carlo tests were conducted to check for consistency in the model. Inputting simulated off-axis spectra consisting of 100% scattered quasar light and a signal-to-noise of 10, the algorithm reliably assigned no flux to the stellar component (65 iterations resulted in a mean result of 99.920.01% scattered quasar light). Inputting 100% stellar component (S/N=10), the algorithm reliably assigned no flux to the scattered light component (65 iterations resulted in a mean result of 2.321.59% scattered quasar light). Finally, we tested the performance of the model when constrained to have a steep blue scattered quasar component, as observed in the off-axis spectrum of PHL 909. The error estimates were not significantly affected by this alteration; for details see Appendix A (PHL 909).
3.2.3 Limitations
| Pointing |
|
|
|
B - V | |||||||
|---|---|---|---|---|---|---|---|---|---|---|---|
| 3C 273 4N | 13.8 (-3.016.9) | 0.0 (+0.319.1) | 86.2 (+2.613.8) | 9.40 (-0.010.24) | 0.77 (-0.000.05) | ||||||
| 4C 31.63 2N | 15.7 (-1.916.2) | 0.0 (-1.816.5) | 84.3 (+3.79.6) | 9.00 (+0.060.28) | 0.69 (+0.010.06) | ||||||
| 4C 31.63 2.5E | 18.3 (-1.116.4) | 0.5 (-2.317.7) | 81.3 (+3.411.8) | 9.18 (+0.000.32) | 0.74 (-0.000.05) | ||||||
| 4C 31.63 3SΔ | 0.0 (-2.117.0) | 25.3 (-1.018.2) | 74.7 (+3.19.9) | 9.73 (+0.030.26) | 0.83 (+0.010.05) | ||||||
| PKS 1302-102 2.3N | 0.0 (-5.627.0) | 12.4 (+4.326.7) | 87.6 (+1.314.8) | 9.34 (+0.090.49) | 0.76 (+0.020.12) | ||||||
| PKS 0736+017 4.5NW | 0.0 (+4.221.3) | 0.0 (-5.723.2) | 100.0 (+1.512.4) | 9.56 (-0.050.32) | 0.83 (-0.010.07) | ||||||
| PKS 2135-147 3W | 0.0 (-2.022.6) | 0.0 (-0.623.7) | 100.0 (+2.612.0) | 9.52 (+0.010.34) | 0.82 (-0.000.07) | ||||||
| PKS 2349-014 4N | 6.3 (-2.511.4) | 0.8 (+0.011.3) | 92.9 (+2.59.6) | 9.52 (+0.010.20) | 0.79 (+0.000.04) | ||||||
| PKS 2349-014 3S | 11.1 (-4.712.7) | 15.3 (+0.813.2) | 73.6 (+3.98.8) | 9.54 (+0.060.21) | 0.78 (+0.000.03) | ||||||
| PG 1309+355 4.5SW | 11.7 (-2.114.4) | 9.5 (+1.916.1) | 78.9 (+0.210.7) | 9.33 (+0.020.26) | 0.76 (+0.000.06) | ||||||
| PHL 909 4.5N | 0.0 (-8.318.4) | 43.8 (+4.920.0) | 56.2 (+3.412.4) | 9.45 (+0.140.45) | 0.73 (+0.020.10) | ||||||
| PG 0052+251 3S | 43.3 (-8.019.2) | 16.5 (+4.520.9) | 40.1 (+3.6 11.5) | 8.09 (+0.090.34) | 0.32 (+0.030.05) | ||||||
| PG 1444+407 3S | 9.5 (-7.823.8) | 58.2 (+2.627.6) | 32.2 (+5.217.7) | 8.86 (+0.150.42) | 0.52 (+0.030.09) |


Errors associated with the: 1) population synthesis model (BC03) (template mis-match), 2) inadequacy of the scattering efficiency curve, 3) non-Poisson noise and 4) the application of a single simplistic extinction law are not represented in our Monte-Carlo simulations . Despite these deficiencies, similarly constructed quiescent models have demonstrated consistency when compared to competing techniques (e.g. see CF05). In §5 we address this issue by comparing our results to recent studies of quasar host galaxies. Finally, it should be noted that the error estimates obtained reflect the one sigma performance of the model. Although currently applied to a relatively small sample, stronger error statements will be possible with the increase of our sample. With this in mind, when possible, we consider our objects as an ensemble.
4 Application of model and simulations to the test sample
In this section we apply our model to the test sample to constrain the stellar age and host colour. We then conduct 10 (one for each pointing) tailored Monte-Carlo simulations to estimate the reliability of our results.
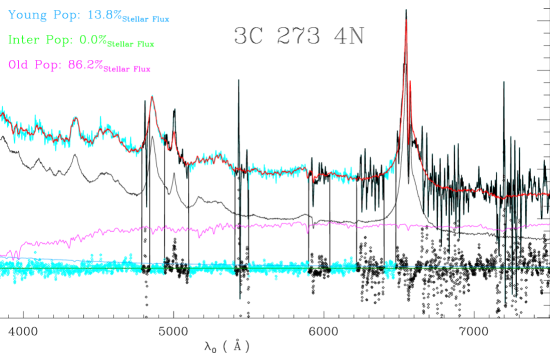
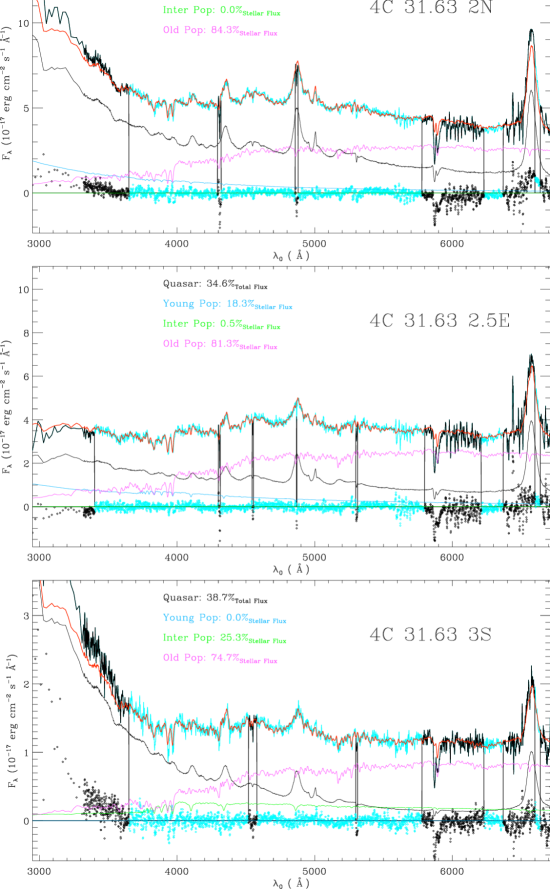
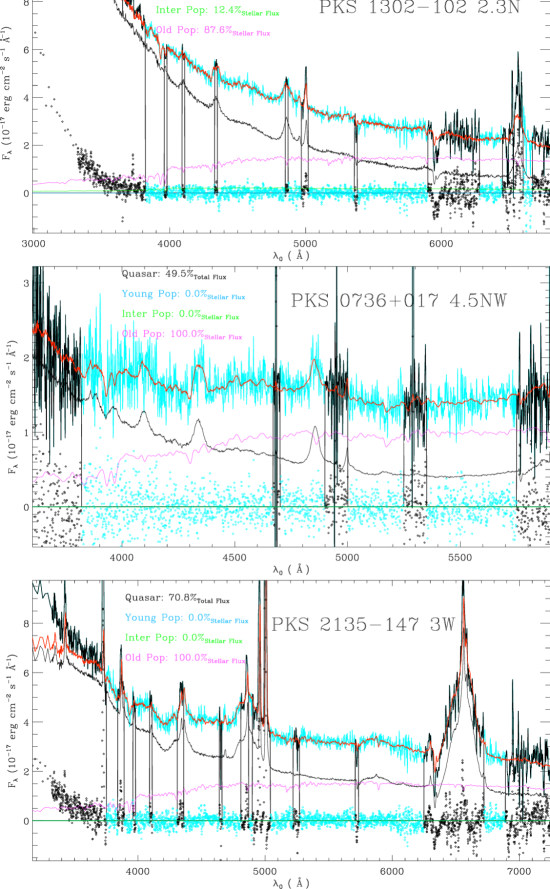
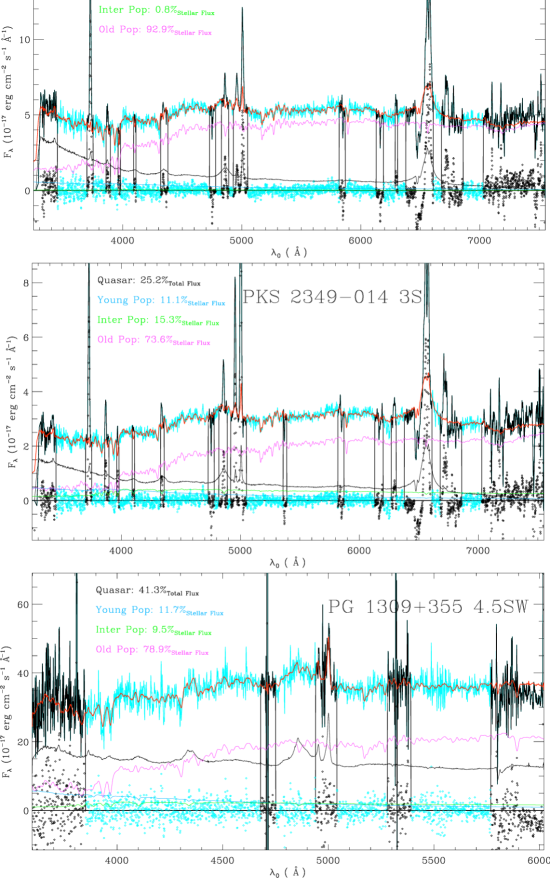
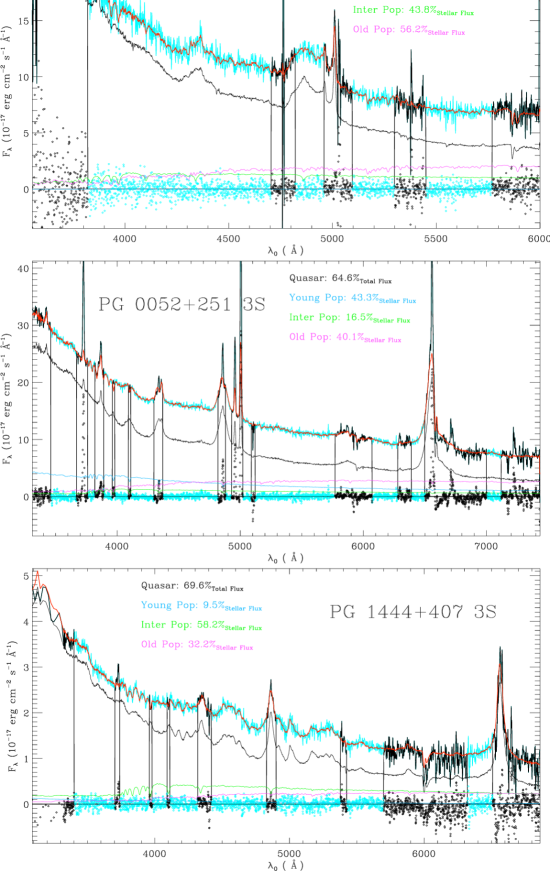
The following caveats should be considered in the application of our model to the test sample. For each object, concurrent on and off-axis observations have been obtained, with the exception of the 3S pointing of 4C31.63 (). The possible variability of this quasar over this time period is not accounted for by the model. Line-of-sight stellar motions are not modeled for Keck objects. Our instrument resolution, km , being greater or of the order of the measured velocity dispersions (Wolf & Sheinis, 2008) should result in minimal errors. For WIYN objects, with km , the measured velocity dispersions are used to smooth the model stellar component, . Narrow emission line regions and sky residuals are uniquely masked for each object, giving these regions no weight in the fitting. The broad components, and in some cases entire broad lines, are left unmasked, though most or all of the H-alpha region is masked out in many objects due to significant sky residuals in the red end of the spectrum. Typically, spectral data points are fit for Keck objects; spectral data points are fit for WIYN objects. Fig. 4 depicts the result of the method applied to 3C 273 4N. The results for all other off-axis pointings are presented in the appendix, Fig. A1. Table 3 summarizes these findings.
The reliability of these results are then determined with tailored simulations. Synthetic spectra are generated with features representative of the observed spectra by (1) degrading to the observed noise level, (2) applying the same mask constructed for the observed spectrum, (3) using the appropriate observed on-axis spectrum as and (4) scaling the scattered quasar light to the observed contamination level as determined by the model output444The contamination percentage is well recovered as tested by the Monte-Carlo routines; for example, the contamination percentage for PKS 0736-017 is recovered within %. This observation has the most limiting signal-to-noise and provides an estimate of the error upper limit. . An example of a simulation with the same on-axis spectrum, noise characteristics, applied mask and percent scattered quasar light as the observed off-axis spectrum of PKS 0736+017 is displayed in Fig. 5 top row. The bottom row of Fig. 5 presents the simulation results for PG 1309+355. The PKS 0736+017 off-axis pointing has the worst signal-to-noise, while the PG 1309+355 off-axis pointing has average signal-to-noise and quasar contamination. The results of all simulations are shown in Table 3. Throughout the rest of the paper, mean offsets are applied to model results and Monte-Carlo one sigma errors are quoted.
5 Comparison to recent studies
We compare our spectroscopically derived rest frame B-V host colours to the available results from imaging studies. These imaging studies spatially subtract the point spread function of the AGN to reveal the host galaxy. Our method, which spectrally subtracts the scattered quasar light, provides a complimentary technique to constrain the host B-V colours.
Our off-axis method probes a population of luminous quasars unattainable by most other spectroscopic techniques. The stellar properties of this population have yet to be determined for a large well defined sample. This deficiency is due to the overwhelming emission from the central quasar. Previous off-axis studies (e.g. Hughes et al., 2000) have dealt with this problem by carefully selecting distant (5′′) off-axis slit positions. This can significantly reduce the typical scattered light observed off axis (20%). Our approach is to more rigorously model the quasar light scattered off axis. This allows for 1) scattered light fractions of up to 80% and 2) more freedom in slit positioning. Furthermore, our method draws from established quiescent population synthesis models to more robustly model the stellar content and to estimate the reliability of our results.
Recent advances in on-axis observational techniques have allowed for the study of luminous quasars (Jahnke et al., 2007; Letawe et al., 2007). For objects with , our method can compliment these studies by observing off-axis () stellar content with favorable signal-to-noise. We note that on-axis studies require nucleus-to-host ratios of to detect stellar absorption features (L07). Objects such as NAB 0205+02, HE 0530-3755 and 3C 273 cannot be observed on-axis due to this criterion. Off-axis studies do not have this limitation. Thus, our method is needed to obtain optical stellar spectra for these objects.
In the following subsections we compare our study to previous imaging and spectroscopic work in more detail. Furthermore, we quantify how our sample compares to applicable SDSS AGN studies.
5.1 Recent photometric studies
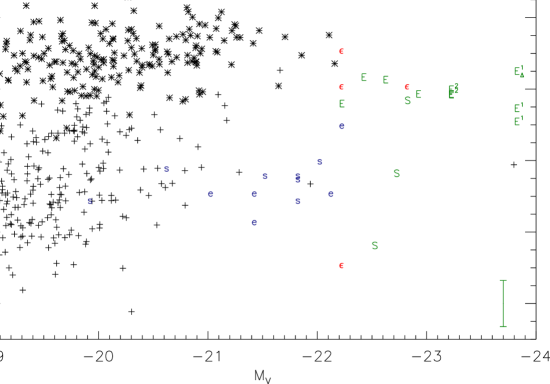
Host B-V colours have been reported for nearby () quasars by Jahnke et al. (2004), hereafter J04, and for nearby () BL Lacs by Hyvönen et al. (2007), hereafter H07. J04, studying multicolour data from a sample of AGN distributed around the classical dividing line in luminosity between Seyfert 1 galaxies and quasars, found bulge dominated hosts to have bluer colours than expected compared to their quiescent counterparts; disc hosts were also on average bluer, but not by a significant amount. H07, also studying multicolour data, found their exclusively elliptical BL Lac hosts to be on average bluer than expected compared to their quiescent equivalent. Table 4 shows the mean B-V colours for the host galaxies in J04 and H07, as well as in our sample and for quiescent galaxies of various morphologies (from Fukugita, Shimasaku & Ichikawa 1995). In agreement with J04 and H07, we find the rest frame B-V colour for the elliptical host galaxies of our sample to be bluer than one would expect given their quiescent morphological counterparts. This provides confirmation that elliptical quasar hosts are distinguishable in B-V colour from inactive elliptical galaxies using a spectroscopic technique. Spirals hosts for our sample are found to be consistent with Sc galaxies which have a B-V colour of 0.54 (Fukugita et al., 1995). A comparison to quiescent galaxies is also presented via a colour-magnitude diagram, Fig. 6. Quiescent COMBO-17 (Wolf et al., 2004) late-type galaxies (black ’’), and quiescent COMBO-17 early-type galaxies (black ’’) are shown in relation to J04 hosts (blue lower-case letters; ’s’ for spiral or disc, ’e’ for elliptical morphology), H07 hosts (red ’’), and this work (green upper-case letters; ’S’ for spiral or disc, ’E’ for elliptical morphology). Quiescent early and late-type galaxy designations are determined by the U-V vs cut as proposed by Bell et al. (2004) for z=0.25. A typical error bar is shown for our sample in the lower right of Fig. 6.
Although we confirm bluer elliptical host galaxy colours, we find that our sample is on average much redder than J04. This offset may be due to the different effective radii probed since our method is only sensitive to the stellar content observed off axis. For example, if nuclear starbursts were a common occurrence in quasar hosts, then one might expect the outer stellar populations to exhibit redder colours. However, results from Kauffmann et al. (2003) suggest that the different radii probed may not be responsible for this observed offset. Studying a large sample of obscured AGN hosts, they find that star formation in the hosts of powerful AGN (approximately one magnitude fainter than a typical object in this study) is not concentrated primarily in the nuclear regions; it is spread out over scales of at least several kilo-parsecs. Furthermore, the host galaxies in the H07 study exhibit a wide range of host colour gradients, with the majority displaying bluer colours off axis. This negative colour gradient is also observed for radio galaxies (Govoni et al., 2000) and quiescent ellipticals (Peletier, Valentijn & Jameson, 1990). Assuming these conclusions hold true for quasar hosts, one would expect our sample to be biased toward bluer colours rather than the observed red offset.
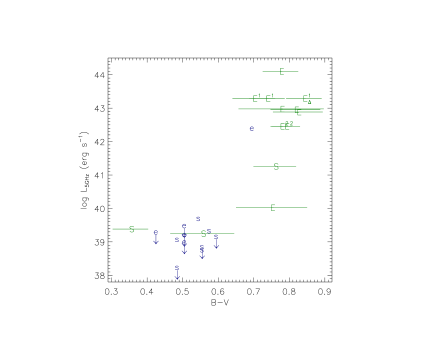
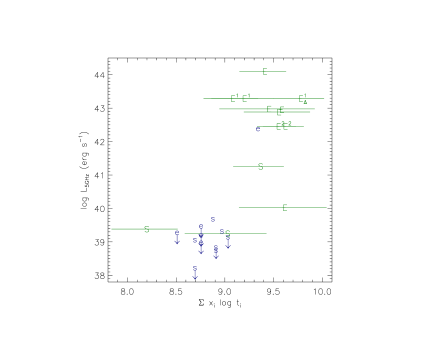
An alternative explanation for our redder host colours compared to the J04 study is that our sample is on average more radio loud555Radio luminosity is estimated utilizing NED and NVSS (Condon et al., 1998). A spectral index of -0.5 is assumed. Upper limits are based on the sensitivity of NVSS 2.3 mJy @ 1.4 GHz.. The only J04 object which overlaps in B-V colour with our main sample is their most radio loud. The two objects from our sample which overlap in colour with the main J04 sample are also our most radio quiet. This relation of colour to radio luminosity is shown in Fig. 7. Above , the host galaxies are systematically redder. Given the correlation between radio luminosity and bulge mass found for our sample (Wolf & Sheinis 2008, ), corresponds to . The rms scatter of the correlation is 1.09 dex. This trend for radio loud objects to be located in redder hosts is not surprising; Best et al. (2005) found that radio-loud AGN are preferentially located in older more massive galaxies. However the distinct transition we see in our sample should be investigated on a larger sample.
| Sample | B - V |
|---|---|
| E Quasars (this work) | 0.780.01 |
| S Quasars (this work) | 0.550.12 |
| E Quasars (J04) | 0.520.05 |
| S Quasars (J04) | 0.560.01 |
| Quasars (this work plus J04) | 0.770.02 |
| Quasars (this work plus J04) | 0.500.02 |
| E BL Lacs (H07) | 0.80.2 |
| E (Fukugita et al., 1995) | 0.96 |
| Sb-Sc (Fukugita et al., 1995) | 0.57 |
| Sc-Sd (Fukugita et al., 1995) | 0.50 |

How can this be understood in terms of stellar ages? The mean light-weighted age is correlated to various colours (e.g., u-r, Mateus et al., 2006). We verify this correlation for our colour of interest, B-V, by constructing 65 test spectra, Fig.8. Using this relation we convert the B-V colours of J04 to mean light-weighted ages, Fig. 9. While the observed colour trend is more pronounced, it is found that all values above are older than values below this threshold. Previous studies (CF05; Mateus et al. 2006) have studied the mean light-weighted age and found this quantity to be frequently associated with the most recent epoch of starbursts. Assuming major merger progenitors for our quasar hosts with a significant past starburst (e.g., see Hopkins et al., 2006), may indicate the approximate timing of the merger event. It should be noted that our definition of differs slightly from the definition adopted by CF05 and Mateus et al. (2006) due to different SSP normalization conventions (see §3.1). For our sample, conversion to this alternative definition modifies our reported results by 1 or less.
To estimate this time-scale we divide the combined sample into two groups; a radio bright sample with displaying an average B-V colour of 0.77 and a radio faint sample with displaying an average B-V colour of 0.50 (average colour for this grouping is also reported in Table 4). is found to correspond to bulge mass and may provide a more significant division than morphology whose classification is hampered by quasar point source subtraction and un-modeled tidal features. We find that, on average, Gyrs666 for the radio bright sample and Myrs for radio faint sample.
5.2 Recent spectroscopic study with imaging
This result for radio loud objects compares remarkably well to recent findings of Canalizo et al. (2006) and Bennert et al. (2008). Canalizo et al. (2006) report preliminary deep Keck LRIS spectral analysis of luminous quasar hosts which finds evidence for major starburst episodes with ages ranging from 0.6 Gyr to 2.2 Gyr. Incidentally at least two of the host galaxies studied by Canalizo & Stockton (in preparation) overlap with our sample, PKS 0736+017 and PHL 909. They find that both of these objects located in our radio bright group have massive 2.2 Gyr starbursts, consistent with our colour and mean light-weighted age estimate. However, see Appendix A for an inconsistency in the derived stellar populations for PHL 909. Bennert et al. (2008), again studying PKS 0736+017 and PHL 909 along with three other hosts in deep HST ACS images, find shells and tidal tails indicative of merger events. Consulting N-body simulations they conclude that in general the observed fine structure can be explained by either a recent minor merger or an older major merger 1Gyr ago.
Implications of a Gyr poststarburst quasar are discussed extensively in Canalizo et al. (2007) and Bennert et al. (2008). In summary the currently estimated (optically luminous) quasar lifetime (yrs (Yu & Tremaine, 2002)) appears to be too short to be triggered at the same time as the starburst. Bennert et al. (2008) conclude that this may imply a scenario in which quasar activity is significantly delayed or a scenario in which intermittent quasar activity encompasses a longer duration. Alternatively, a more recent minor merger could explain the observed quasar. Our results do not rule out this scenario. However, the average mass-to-light ratio for our sample being 10 (Wolf & Sheinis, 2008), constrains any recent (t1Gyr) starburst to be relatively insignificant in mass.
5.3 Off-axis studies
The off-axis (′′) spectroscopic study of Hughes et al. (2000, hereafter H00) consists of three matched subsamples of nine radio quiet quasars (RQQs), ten radio loud777Radio loud in H00 is defined as , which is roughly consistent with our adopted definition. quasars (RLQs), and seven radio galaxies (RGs). Similar to our study, all quasars are luminous () and local ().
H00 determine the 4000 Å break strength, an indicator of the mean stellar age, for each object. The average values for RQQ hosts, RLQ hosts, and RGs all indicate younger mean stellar ages than local inactive elliptical galaxies, in agreement with our study. However, H00 notes wide scatter in their measured values. Additionally, measurements indicative of younger ages were typically associated with either poor signal-to-noise data or with spectra that show significant scattered quasar light. Thus H00 defer further analysis of the stellar populations to the followup spectro-photometric modeling conducted by Nolan et al. (2001, hereafter N01).
N01 develop two population synthesis models. The first model consists of a 0.1 Gyr SSP and a second SSP component whose age and contribution are allowed to vary to obtain the best fit. Like our study, solar metallicity is assumed. However, two SSPs are used to construct the stellar population in contrast to our model which incorporates a base of 15 BC03 SSPs. N01 also develop a three component model which uses the observed nuclear spectrum of the RQQ, 0054+144, to account for scattered quasar light detected off axis. While our approach also uses observed nuclear light to model off-axis scattered light, our model does not assume a universal nuclear spectrum. The observed nuclear spectrum is matched to the off-axis observation (e.g. the model input for the quasar contamination in the 3C 273 off-axis spectrum is the observed 3C 273 nuclear spectrum). Additionally, it should be noted that whenever possible (9 out of 10 pointings) we have observed on and off-axis observations simultaneously to avoid variation in the quasar spectrum which could hamper an accurate scattered-light subtraction. As a final point, we allow for the continuum shape of the nuclear light observed off axis to be altered by the scattering efficiency curve, which we have shown is necessary for reliable scattered light removal (Sheinis, 2002).
Interpretation of the N01 model output indicates that the stellar mass of all three subsamples studied (RQQ, RLQ, and RG) is dominated by old stars of age 8-14 Gyr. This result is used to support the claim that quasar hosts are “to the first order, indistinguishable from ’normal’ quiescent giant elliptical galaxies.” If we take N01’s derived age to be representative of the mean mass-weighted stellar age, then it is not clear that this quantity can be used to differentiate between late and early type galaxies. Mateus et al. (2006), studying 50,000 luminous galaxies from the SDSS, show that the distribution of mean mass-weighted stellar ages is not bimodal, as both star-forming and passive galaxies have formed a large fraction of their stellar mass at early times ( Gyr in the past). We may comment on the result of N01 by referring to the mass-to-light ratio derived from the measured stellar velocity dispersion. Wolf & Sheinis (2008) found that the average mass-to-light ratio for our quasar host sample is , which supports the dominance by mass of old stars. However, as stated in §5.1 our colour / determination indicates that quasar hosts are bluer / younger than quiescent ellipticals.
5.4 On-axis studies
J07 present a method that spatially subtracts the quasar point spread function from the on-axis spectrum to extract the host galaxy light. Unlike our method, which is constrained to collect light off axis, this technique allows for the inner regions of the host galaxy to be probed. Like our study, the J07 test sample consists of nearby () quasars. However, this sample consists of quasars that are typically less luminous in optical and radio bands than our study. J07 model 13 host spectra with a two component BC03 SSP model. Eight of the spectra were deemed trustworthy, yielding a typical light-weighted stellar age of 1-2 Gyr. For a rough comparison, our sample average is approximately 2 Gyr. If we limit our sample to radio quiet objects, to more closely match the sample of J07, we find an average of 1 Gyr. Confidence in this comparison is hampered by the small number of objects probed and the sample mismatch: our targets are typically more luminous.
Despite this mismatch, there is one object that is modeled by both groups, the radio loud quasar PKS 1302-102. While J07 find a stellar age , our results indicate a predominantly old, stellar population. This disagreement may indicate a radial dependence on the stellar populations or model systematics.
L07, utilizing an on-axis method complementary to the J07 technique, examine the host galaxies of 20 luminous quasars whose redshifts and nuclear optical luminosities are well matched to our sample. However, their optically selected sample contains far fewer RLQs. L07 measure diagnostic absorption and emission lines and then compare these to known quiescent galaxy values. Half of their sample was found to have young Sc-like stellar populations. The sample examined by our study indicates a redder and hence older stellar population than a typical Sc galaxy. Our studies are again brought into closer agreement if we consider only our RQQ hosts. However, no secure agreement can be claimed due to our small RQQ sample. Further complicating the comparison, L07 also model PKS 1302-102 and find evidence for a young Sc-like stellar population. Additional interpretation of this disagreement is discussed in Appendix A.
5.5 Sloan Digital Sky Survey studies
| Sample | |
|---|---|
| Quasars (this work plus J04) | 9.40.1 |
| Quasars (this work plus J04) | 8.80.1 |
| Passive (M06) | 9.86 |
| AGN hosts (M06) | 9.66 |
| ’green valley’ (M06) | 9.53 |
| Star-forming (M06) | 8.91 |
The Sloan Digital Sky Survey (SDSS) has been utilized to study AGN hosts by a number of groups. These studies benefit from a large well defined sample. Narrow-line AGN studies (Kauffmann et al. 2003, hereafter K03; Zakamska et al. 2003, hereafter M06; Mateus et al. 2006, hereafter M06) and the broad-line AGN study by Vanden Berk et al. (2006, hereafter V06) are compared to this work below.
K03 study the host galaxies of 22,623 local type 2 AGN. Modulo deficiencies in AGN unification models, quasar hosts can be studied via their narrow-line counter-parts. From 4000 Å break measurements, K03 find that high luminosity AGN have younger mean stellar ages than normal early-type galaxies. Additionally, they find a large fraction of powerful type 2 AGN have experienced significant starbursts in the past 1-2 Gyr. This is similar to our findings: Gyrs for the radio bright sample and Myrs for radio faint sample. However, there is little overlap in luminosity between our samples. The K03 powerful (L[OIII] ) AGN are about one magnitude fainter than our sample’s nuclear luminosities. A smaller more luminous sample of SDSS narrow-line AGN has been examined by Zakamska et al. (2003). In qualitative agreement with K03, they too find evidence for relatively blue / young host galaxies.
M06 divide a sample of 50,000 SDSS galaxies into star-forming, passive, and AGN hosts spectral classes. The AGN probed by this study are comparable in luminosity to the K03 sample. M06 find a clear bimodal distribution for the mean light-weighted stellar age among star-forming and passive galaxies. As summarized in Table 5, median values of for star-forming galaxies and for passive galaxies are found. The green valley is located at and the median for AGN hosts is 9.66. The M06 median for AGN hosts is heavily weighted toward the more numerous low luminosity objects. In agreement with K03, they find that the typical decreases for more luminous AGN. Our radio bright sample with is in close proximity to the green valley (slightly younger and bluer). We find the radio faint sample with to fall very close to the peak of star-forming distribution. Qualitatively we find this to be in overall agreement with our colour-magnitude diagram, Fig. 6.
V06 study the host galaxies of 4,666 local broad-line AGN. Like K03 and M06, they find that higher luminosity AGN hosts are bluer /younger than normal early-type galaxies. This sample contains quasars with luminosities comparable to our study. However, the model employed by V06 fails when the on-axis host flux fraction falls below 10% or when the signal-to-noise is less than 10. These criteria prevent the study of of their luminous objects and would exclude the majority of the objects (7 of 10) in this study.
6 Summary and Conclusions
We have presented an off-axis technique to spectroscopically constrain the colour and the stellar ages of quasar () host galaxies. Our method draws heavily from the quiescent galaxy model of CF05, utilizing a basis of BC03 SSPs and Cardelli et al. (1989) dust extinction in a similar fashion. Complicating our fitting routine is the residual scattered quasar light (a combination of atmospheric, instrumental and host galaxy scattered light) which must be accounted for in the off-axis spectrum. Scattered light is modeled by altering the the observed nuclear spectrum by a low order polynomial, while simultaneously fitting the constituent stellar populations of the host galaxy. Furthermore, Monte-Carlo simulations are tailored to each observed pointing. Thus, the ability of the model to recover known parameters from synthetic spectra is determined. It is found that quasar host B-V colour and are well recovered. These parameters are then compared to previous studies. Overall consensus is found giving further credence to our model (however, see Appendix A for discussion of individual cases that potentially disagree with previous results).
Our method probes a population of luminous quasars unattainable by most other techniques. The stellar properties of this population have yet to be determined for a large well defined sample. For the smaller sample () studies that can access this luminous regime, our method can be used in conjunction to gain further insight. For example, our technique can observe the off-axis () stellar content of objects (nucleus-to-host ratio15) inaccessible to the on-axis studies of J07 and L07.
The full potential of this method has yet to be realized. To date, we have analyzed the properties of 10 quasar host galaxies. With this sample, we confirm that elliptical quasar hosts are distinguishable (bluer) from inactive ellipticals in rest frame B-V colour. Additionally, we note a trend for radio luminous quasars to be located in redder host galaxies in comparison to their less radio luminous counterparts. However, general conclusions await further observations. Currently we have 10 additional WIYN off-axis observations in the process of being reduced. Furthermore, time has been allotted on the WIYN telescope to increase our total analyzed sample size to objects. This sample will consist of roughly an equal number of RLQs and RQQs and allow for 1) more rigorous comparison to other studies due to the increase in sample size, 2) further verification of our technique with the targeting of L07 overlap objects (specifically HE 0914-0031 and HE 0956-0720), 3) investigation of the trends found in our preliminary sample. In the near future, the Robert Stobie Spectrograph (RSS) on the 11-m Southern African Large Telescope (SALT) will be employed in our ongoing observational campaign. This phase of the project will increase the observable sample by its location in the Southern hemisphere and by allowing for higher redshift objects to be targeted ().
Future work will build on the current model to analyze the narrow-line emission. This will provide insight into the star formation rate, the emission mechanism, the metallicity, and the stellar content (e.g. see L07). The accomplishment of this program will provide important observational constraints on luminous quasars.
Acknowledgements
The authors would like to thank Joseph Miller, Roberto Cid Fernandes, and Laura Trouille for insightful conversations on various aspects of this work. We are also in debt to Amy Barger for use of computing resources. Some of the data presented herein were obtained at the W. M. Keck Observatory, which is operated as a scientific partnership among the California Institute of Technology, the University of California, and the National Aeronautics and Space Administration. The Observatory was made possible by the generous financial support of the W. M. Keck foundation. Data were also obtained at the WIYN Observatory, which is a joint facility of the University of Wisconsin-Madison, Indiana University, Yale University, and the National Optical Astronomy Observatories.
Appendix A Comments on individual hosts
In this section, we describe the stellar populations found for individual hosts and compare these to previous studies. Objects are listed in order of greatest 5 GHz luminosity to least, as in Table 1. Unless otherwise mentioned: young (t 100 Myr), intermediate (100 Myr t 1 Gyr), and old (t 1 Gyr), where t is the age of the starburst. Additionally, stellar populations (young, intermediate, and old) are reported by percent flux contribution. Results from the Monte-Carlo simulations, namely the mean offset and the one sigma errors, are utilized in the following comments. By convention, application of offsets may not force the percent flux contribution to be negative or greater than 100%. For output parameters without offsets applied see Table 3. Fig. 4 and Fig. A1 are also shown without offsets applied. As mentioned in §3.2.3, error estimates reflect one sigma performance; thus we expect statistically 4 of our 13 pointings to lie beyond our error limits.
3C 273 (PG 1226+023) – The host galaxy is classified as an elliptical galaxy via HST imaging (Bahcall et al., 1997; Hamilton et al., 2002). The off-axis spectral analysis of Boroson et al. (1985) qualitatively found evidence for a significant contribution from an old stellar population. Our results, 88.813.8 % flux contribution from an old stellar population at an observed radius of 11.8 kpc, are consistent with these studies. Somewhat below the 1 error, a young stellar component is found by the routine. Residual OII and OIII narrow line emission is noted.
4C 31.63 (Q2201+315) – 4C 31.63 is a radio loud quasar whose host galaxy has been classified as an elliptical by HST imaging (Bahcall et al., 1997; Hamilton et al., 2002) and by near-infrared adaptive optics imaging (Guyon et al., 2006) . Our results for the Northern and Eastern pointings are consistent with a predominantly old stellar population. Toward the south we find evidence for an intermediate stellar population not found in the other pointings. Note that the 3S pointing has non-concurrent on and off-axis observations, see §4 for details. No narrow line emission is found for this object.
PKS 1302-102 (HE 1302-1017) – The host galaxy of this radio loud quasar has been classified as a disturbed elliptical by various studies (Hutchings & Neff, 1992; Bahcall et al., 1997; Hamilton et al., 2002; Guyon et al., 2006). Jahnke et al. (2007) and Letawe et al. (2007) have found evidence from on-axis spectroscopy for a young spiral-like stellar population. Jahnke et al. (2007) note that there are almost no stellar absorption lines with the exception of a weak Ca K and Mg line. This is not the case in our observed off-axis spectrum; Ca K and H are prominent with clear Mg b and Na D absorption features. The stellar component is found to be best fit by a 88.914.8% old population with a statistically insignificant intermediate population. Jahnke et al. (2007) and Letawe et al. (2007) analyse the stellar content with on-axis spectra, potentially probing much closer in to the central SMBH. Thus a plausible explanation for this disagreement is the different effective radii probed by our studies; however, other systematics are not ruled out. In our observed off-axis spectrum, scattered light from the central quasar is significant 68.4%, effectively decreasing the signal-to-noise of the stellar component. Additionally, the Balmer decrement has been masked due to nebular emission, potentially removing important spectral information. On the other hand, we estimate the nucleus-to-host ratio to be 13.5, which is relatively close to the stated upper limit of to reliably detect absorption features with the on-axis method (L07). Regardless, the observed prominent Ca H and K absorption lines support the claim that a significant old population is present at the radius probed Kpc. Residual OII and OIII narrow line emission is noted.
PKS 0736+017 – The host galaxy has been classified as elliptical (Wright, McHardy & Abraham 1998 McLure et al. 1999; Falomo & Ulrich 2000; Hamilton et al. 2002). Others describe the host as a disturbed elliptical based on near-infrared imaging (Dunlop et al., 1993) and deep HST imaging (Bennert et al., 2008). Off-axis spectroscopic studies have found a stellar component indicative of a 12 Gyr population (Hughes et al., 2000; Nolan et al., 2001). Canalizo & Stockton (in preparation) find a 2.2 Gyr starburst in this host (Bennert et al., 2008) which falls in our ’old’ age bin. Our results indicate 10012.4% flux contribution due to an old population. No narrow line emission is found for this object.
PKS 2135-147 – The host galaxy of this radio loud quasar has been classified as elliptical by Bahcall et al. (1997) and Hamilton et al. (2002). Our results are consistent with the expected stellar population of an elliptical galaxy. We find 10012.0% old stellar population at a radius of approximately 12.5 Kpc. Multiple residual narrow emission lines are noted for this object.
PKS 2349-014 – The host galaxy of this radio loud quasar has been classified as a highly disturbed elliptical by many imaging studies (Bahcall et al., 1997; Guyon et al., 2006). An off-axis spectroscopic study by Nolan et al. (2001) found a dominant old stellar population of 12 Gyr with a low level young population. Off-axis studies (Miller & Sheinis, 2003; Wolf & Sheinis, 2008), utilizing the same data analysed in this paper, have also found evidence for a predominately old stellar population with a lesser young population. Our results are consistent with a predominantly old population by flux. The northern pointing (14.12 kpc), probing large tidal arms, is consistent with an entirely old stellar population; whereas the closer-in Southern pointing (9.47 kpc) we find evidence for a small intermediate population (16.1). Multiple residual narrow emission lines are noted for this object.
PG 1309+355 – HST imaging studies classify this object as a spiral (Bahcall et al., 1997; Hamilton et al., 2002), while the near-infrared study of Guyon et al. (2006) classifies the host as an elongated elliptical. If this object is truly a spiral, then this is a very rare object displaying a large radio luminosity, just below our radio-loud threshold. Our results indicate a predominantly old population. No significant narrow emission lines are noted.
PHL 909 (0054+144) – The host is an elliptical galaxy as classified by the imaging studies of Bahcall et al. (1997) and Hamilton et al. (2002) . The near-infrared imaging of Dunlop et al. (1993) detects extended emission toward a companion. Recent deep HST imaging (Bennert et al., 2008) detects tidal tails and shells. Barthel (2006), analysing the far-infrared / radio correlation, finds evidence of recent or on going star formation. Off-axis spectroscopic studies have either classified the stellar population as old (Nolan et al., 2001) or have reported ambiguous results (Hughes et al., 2000). Canalizo & Stockton (in prep.), analysing 2 hr exposure Keck LRIS data, find a 12 Gyr population combined with a 2.2 Gyr starburst (as reported in Canalizo et al., 2006). This would correspond to a 100% old population given our adopted age bins; however our results indicate 59.612.4% old and 48.720.0% intermediate by flux. This pointing has the highest scattered quasar component at 77.8% by flux. The scattered light contamination is highest at the blue end of the spectrum where the 4000Å break and various stellar absorption features are located. Thus our Monte-Carlo error simulations, which normally are not constrained to have steep blue scattering efficiency curves, may be under estimating the actual error. To test this scenario, we performed Monte-Carlo simulations with input parameters indicative of PHL 909 and constrained to have a steep scattering efficiency curve, as found by the best fit model output. The error estimates and offsets were not significantly affected by this alteration888As listed in Table 1 and Table 2, the original error simulations found the following offsets and errors: for young, for intermediate, for old, for B-V colour, and for . The steep blue scattering simulations found: for young, for intermediate, for old, for B-V colour, and for .. If our observations are co-spatial with those of Canalizo & Stockton, then the difference in the results may simply be a outlier arising from separate observations and different analysis methods. Regardless, construction of a solar BC03 stellar spectrum consistent with the findings of Canalizo et al. (2006) results in values for the mean light-weighted age and B-V colour that are consistent (within 1) of our findings. Therefore, we believe that the main discussion regarding the more reliably recovered parameters, colour and , are robust.
PG 0052+251 – The host galaxy associated with this radio quiet quasar is a spiral as classified by various imaging studies (Bahcall et al., 1997; Hamilton et al., 2002). Our results are consistent with a significant young population of 35.319.2% by flux and an old population of 43.7%. Multiple residual narrow emission lines are noted for this object.
PG 1444+407 – The host of this radio quiet quasar is classified as a spiral by Hamilton et al. (2002). Bahcall et al. (1997) note that the host has the appearance of an elliptical; however the light profile is best fit by an exponential disc model. Additionally, Ho (2005) estimate a significant star formation rate (19.4 ) based on the [O II] luminosity. Our results indicate a 60.827.6% intermediate population, a 37.417.7% old population and a statistically insignificant young population. Multiple residual narrow emission lines are noted for this object.
References
- Bahcall et al. (1997) Bahcall, J. N., Kirhakos, S., Saxe, D. H., & Schneider, D. P. 1997, ApJ, 479, 642
- Barthel (2006) Barthel, P. D. 2006, A&A, 458, 107
- Bell et al. (2004) Bell, E. F., et al. 2004, ApJ, 608, 752
- Bennert et al. (2008) Bennert, N., Canalizo, G., Jungwiert, B., Stockton, A., Schweizer, F., Peng, C. Y., & Lacy, M. 2008, ApJ, 677, 846
- Benson et al. (2003) Benson, A. J., Bower, R. G., Frenk, C. S., Lacey, C. G., Baugh, C. M., & Cole, S. 2003, ApJ, 599, 38
- Bershady et al. (2005) Bershady, M. A., Andersen, D. R., Verheijen, M. A. W., Westfall, K. B., Crawford, S. M., & Swaters, R. A. 2005, ApJS, 156, 311
- Best et al. (2005) Best, P. N., Kauffmann, G., Heckman, T. M., Brinchmann, J., Charlot, S., Ivezić, Ž., & White, S. D. M. 2005, MNRAS, 362, 25
- Boroson et al. (1985) Boroson, T. A., Persson, S. E., & Oke, J. B. 1985, ApJ, 293, 120
- Bruzual & Charlot (2003) Bruzual, G., & Charlot, S. 2003, MNRAS, 344, 1000
- Canalizo & Stockton (2001) Canalizo, G., & Stockton, A. 2001, ApJ, 555, 719
- Canalizo et al. (2006) Canalizo, G., Stockton, A., Brotherton, M. S., & Lacy, M. 2006, New Astronomy Review, 50, 650
- Canalizo et al. (2007) Canalizo, G., Bennert, N., Jungwiert, B., Stockton, A., Schweizer, F., Lacy, M., & Peng, C. 2007, ApJ, 669, 801
- Cardelli et al. (1989) Cardelli, J. A., Clayton, G. C., & Mathis, J. S. 1989, ApJ, 345, 245
- Cattaneo et al. (2006) Cattaneo, A., Dekel, A., Devriendt, J., Guiderdoni, B., & Blaizot, J. 2006, MNRAS, 370, 1651
- Chabrier (2003) Chabrier, G. 2003, PASP, 115, 763
- Cid Fernandes et al. (2005) Cid Fernandes, R., Mateus, A., Sodré, L., Stasińska, G., & Gomes, J. M. 2005, MNRAS, 358, 363
- Condon et al. (1998) Condon, J. J., Cotton, W. D., Greisen, E. W., Yin, Q. F., Perley, R. A., Taylor, G. B., & Broderick, J. J. 1998, AJ, 115, 1693
- Dunlop et al. (1993) Dunlop, J. S., Taylor, G. L., Hughes, D. H., & Robson, E. I. 1993, MNRAS, 264, 455
- Dunlop et al. (2003) Dunlop, J. S., McLure, R. J., Kukula, M. J., Baum, S. A., O’Dea, C. P., & Hughes, D. H. 2003, MNRAS, 340, 1095
- Falomo & Ulrich (2000) Falomo, R., & Ulrich, M.-H. 2000, A&A, 357, 91
- Fukugita et al. (1995) Fukugita, M., Shimasaku, K., & Ichikawa, T. 1995, PASP, 107, 945
- Gebhardt et al. (2000) Gebhardt, K., et al. 2000, ApJ, 539, L13
- Govoni et al. (2000) Govoni, F., Falomo, R., Fasano, G., & Scarpa, R. 2000, A&A, 353, 507
- Guyon et al. (2006) Guyon, O., Sanders, D. B., & Stockton, A. N. 2006, New Astronomy Review, 50, 748
- Hamilton et al. (2002) Hamilton, T. S., Casertano, S., & Turnshek, D. A. 2002, ApJ, 576, 61
- Ho (2005) Ho, L. C. 2005, ApJ, 629, 680
- Hooper et al. (1997) Hooper, E. J., Impey, C. D., & Foltz, C. B. 1997, ApJ, 480, L95
- Hopkins et al. (2006) Hopkins, P. F., Hernquist, L., Cox, T. J., Di Matteo, T., Robertson, B., & Springel, V. 2006, ApJS, 163, 1
- Hopkins et al. (2008) Hopkins, P. F., Cox, T. J., Kereš, D., & Hernquist, L. 2008, ApJS, 175, 390
- Hughes et al. (2000) Hughes, D. H., Kukula, M. J., Dunlop, J. S., & Boroson, T. 2000, MNRAS, 316, 204
- Hutchings et al. (1988) Hutchings, J. B., Johnson, I., & Pyke, R. 1988, ApJS, 66, 361
- Hutchings & Neff (1992) Hutchings, J. B., & Neff, S. G. 1992, AJ, 104, 1
- Hyvönen et al. (2007) Hyvönen, T., Kotilainen, J. K., Falomo, R., Örndahl, E., & Pursimo, T. 2007, A&A, 476, 723
- Jahnke et al. (2004) Jahnke, K., Kuhlbrodt, B., & Wisotzki, L. 2004, MNRAS, 352, 399
- Jahnke et al. (2007) Jahnke, K., Wisotzki, L., Courbin, F., & Letawe, G. 2007, MNRAS, 378, 23
- Kauffmann et al. (2003) Kauffmann, G., et al. 2003, MNRAS, 346, 1055
- Kellermann et al. (1994) Kellermann, K. I., Sramek, R. A., Schmidt, M., Green, R. F., & Shaffer, D. B. 1994, AJ, 108, 1163
- Kormendy (2000) Kormendy, J. 2000, arXiv:astro-ph/0007400
- Lacy (2006) Lacy, M. 2006, Astrophysics Update 2, 195
- Letawe et al. (2007) Letawe, G., Magain, P., Courbin, F., Jablonka, P., Jahnke, K., Meylan, G., & Wisotzki, L. 2007, MNRAS, 378, 83
- Mateus et al. (2006) Mateus, A., Sodré, L., Cid Fernandes, R., Stasińska, G., Schoenell, W., & Gomes, J. M. 2006, MNRAS, 370, 721
- McLure et al. (1999) McLure, R. J., Kukula, M. J., Dunlop, J. S., Baum, S. A., O’Dea, C. P., & Hughes, D. H. 1999, MNRAS, 308, 377
- Miller & Sheinis (2003) Miller, J. S., & Sheinis, A. I. 2003, ApJ, 588, L9
- Nolan et al. (2001) Nolan, L. A., Dunlop, J. S., Kukula, M. J., Hughes, D. H., Boroson, T., & Jimenez, R. 2001, MNRAS, 323, 308
- Oke et al. (1994) Oke, J. B., et al. 1994, SPIE, 2198, 178
- Peletier et al. (1990) Peletier, R. F., Valentijn, E. A., & Jameson, R. F. 1990, A&A, 233, 62
- Press (1992) Press, W., Teukolsky, S., Vetterling, W., & Flannery, B. 1992, Numerical Recipes in C: The Art of Scientific Computing (Cambridge, MA: Cambridge Univ. Press)
- Schlegel et al. (1998) Schlegel, D. J., Finkbeiner, D. P., & Davis, M. 1998, ApJ, 500, 525
- Sheinis (2002) Sheinis, A. I. 2002, Ph.D. Thesis, Univ. California
- Tremonti (2003) Tremonti, C. A. 2003, Ph.D. Thesis, Johns Hopkins Univ.
- Vanden Berk et al. (2001) Vanden Berk, D. E., et al. 2001, AJ, 122, 549
- Vanden Berk et al. (2006) Vanden Berk, D. E., et al. 2006, AJ, 131, 84
- Wolf et al. (2004) Wolf, C., et al. 2004, A&A, 421, 913
- Wolf & Sheinis (2008) Wolf, M. J., & Sheinis, A. I. 2008, AJ, 136, 1587
- Wright et al. (1998) Wright, S. C., McHardy, I. M., & Abraham, R. G. 1998, MNRAS, 295, 799
- Yu & Tremaine (2002) Yu, Q., & Tremaine, S. 2002, MNRAS, 335, 965
- Zakamska et al. (2003) Zakamska, N. L., et al. 2003, AJ, 126, 2125