A Two-Component Power Law Covering Nearly Four Orders of Magnitude in the Power Spectrum of Spitzer Far-Infrared Emission from the Large Magellanic Cloud
Abstract
Power spectra of Large Magellanic Cloud (LMC) emission at 24, 70 and 160 m observed with the Spitzer Space Telescope have a two-component power-law structure with a shallow slope of at low wavenumber, , and a steep slope of at high . The break occurs at pc, which is interpreted as the line-of-sight thickness of the LMC disk. The slopes are slightly steeper for longer wavelengths, suggesting the cooler dust emission is smoother than the hot emission. The power spectrum covers orders of magnitude and the break in the slope is in the middle of this range on a logarithmic scale. Large-scale driving from galactic and extragalactic processes, including disk self-gravity, spiral waves and bars, presumably cause the low- structure in what is effectively a two-dimensional geometry. Small-scale driving from stellar processes and shocks cause the high- structure in a 3D geometry. This transition in dimensionality corresponds to the observed change in power spectrum slope. A companion paper models the observed power-law with a self-gravitating hydrodynamics simulation of a galaxy like the LMC.
1 Introduction
The Large Magellanic Cloud (LMC) is the first spiral galaxy in which an elongated feature of stars was identified. In a remarkable drawing of the LMC as seen with the naked eye made by Sir John Herschel, a bar is clearly shown, which Sir John termed an “axis of light”. Also faithfully represented in that drawing is a prominent spiral arm to the north, as well as two “embryonic” arms. The LMC belongs to the de Vaucouleurs classification bin SB(s)m, and is approximately 50 kpc distant (based on the distance modulus , following Freedman et al., 2001). Studies of the LMC concur that the inclination to the line-of-sight of the (warped) disk lies in the range 30∘–50∘ while the position angle of the line of nodes lies between 120∘ and 150∘; an excellent review is provided by van der Marel et al. (2008). The study by van der Marel & Cioni (2001) using DENIS and 2MASS surveys yields an inclination of 35∘ and position angle of 125∘, which are the values adopted in this study.
The infrared emission from dust in the diffuse interstellar medium of our Galaxy has been extensively studied from IRAS to the Herschel Space Observatory. The quantitative Galactic model of Draine & Li (2007) consists of a mixture of amorphous silicate grains and carbonaceous grains, each with a wide size distribution: sizes range from molecules containing tens of atoms to large grains greater than 1 m. Dust grain temperatures at the surfaces of giant molecular clouds in our Galaxy are hotter than in their cold interiors (Greenberg & Li, 1996), varying from 15 K to 7 K, respectively. Cold dust grains are a crucial component in the ISM of galaxies (e.g., Block et al. 1994). With regard to the dust temperature - metallicity relations in external systems, Engelbracht et al. (2008) find an anticorrelation between dust temperature and metallicity. Equilibrium dust temperatures are 23 K for solar-type metallicities, increasing to 40 K at a low metallicity of (see their Figure 5). First insights from a Herschel study of Messier 33, with its strong metallicity gradient, show that dust temperatures are 25 K in the central portion of the stellar disk, declining to 15 K in the outer domains (Figure 2 in Braine et al., 2010).
Here we study the power spectrum (PS) of FIR dust emission from the LMC. Power spectra of emission maps are an important but poorly understood diagnostic for interstellar structures and the motions that cause them. PS of HI emission from sections of the Milky Way are approximately power laws throughout the entire range of observed spatial frequencies (Crovisier & Dickey, 1983; Green, 1993; Dickey et al., 2001; Khalil et al., 2006). Similar slopes occur for PS of Milky Way CO emission (Stützki et al., 1998), IRAS and DIRBE 100 m emission (Gautier et al., 1992; Schlegel, Finkbeiner, & Davis, 1998) and HI absorption (Deshpande, Dwarakanath, & Goss, 2000). These power laws resemble theoretical expectations from passive gas motions (Goldman, 2000) and compressions (Lazarian & Pogosyan, 2000) in a turbulent fluid, so it is natural to interpret them in this way (Elmegreen & Scalo, 2004). The situation is much more complex for entire galaxies, however, as galaxies undergo rotation and contain supernovae, spiral waves, and other physical processes that are not present in localized clouds. Still, Stanimirovic et al. (1999) found a power law covering 2.5 orders of magnitude in the PS of HI emission from the Small Magellanic Cloud (SMC). Subsequent analysis of SMC dust emission (Stanimirovic et al., 2000) gave a similar result. In all of these cases, the two-dimensional PS is approximately a single power law with a slope between and , depending on the tracer and the depth of the velocity slice (e.g., Dickey et al., 2001).
The PS of HI emission from the Large Magellanic Cloud (LMC) is significantly different from these others. Elmegreen, Kim, & Staveley-Smith (2001) found a two-component power-law with a break at a wavenumber that is consistent with the inverse of the disk thickness. They proposed that turbulent processes and other gas motions are approximately 2D on scales larger than the disk thickness, and similar processes are 3D on scales smaller than the disk thickness. PS for integrated emission from turbulent gas has a slope that differs by 1 in these two cases, with the steeper slope corresponding to 3D motions at large wavenumbers (Lazarian & Pogosyan, 2000; Lazarian et al., 2001). In the LMC, the break scale increases with radius, indicative of a reasonable level of flare in the HI disk. Subsequent models of disk PS by Padoan et al. (2001) confirmed this interpretation.
The same two-part PS was also found for discrete clouds in the Milky Way. Miville-Deschênes et al. (2003) found it in HI emission from the Ursa Major Galactic cirrus and modeled it with a fractal Brownian motion cloud. Their model suggested that the break in the PS occurs at a wavenumber for cloud depth , and that the power-law slope changes by 1 at the break. Ingalls et al. (2004) observed a two-component PS using Spitzer IR observations of a molecular cloud in the GUM nebula. They found that the PS slope changed from at wavenumbers less than arcsec-1 to at wavenumbers greater than arcsec-1. The inferred cloud depth was 0.3 pc.
A break in the PS of HI emission has not generally been observed in galaxies other than the LMC. Dutta et al. (2008) studied HI emission from the face-on galaxy NGC 628 and derived a PS slope of without a break. Their PS covered only a factor of 10 in scale, which may be too small to resolve out two separate components. Dutta et al. (2009a) saw a break in NGC 1058 with a steepening of the slope from to at an inverse wavenumber of 1.5 kpc, which they converted to a disk thickness of 490 pc. Their PS also spanned a factor of 10 in scale, but the galaxy may be too distant (10 Mpc) to resolve the disk thickness with HI (their angular resolution was , corresponding to 660 pc). PS of H and HI emission from several dwarf galaxies showed power laws and no breaks (Willett, Elmegreen, & Hunter, 2005; Begum, et al., 2006; Dutta et al., 2009b). In the SMC there is no break either. For the SMC, this lack of a break could be because the line-of-sight depth is comparable to the transverse length (Westerlund, 1997). This could be the case for the dwarf galaxies also (Roychowdhury et al., 2010).
PS miss the break if the high frequency part is dominated by the point spread function of bright unresolved emission sources. These sources introduce a Gaussian-shaped dip at high frequency in the PS (e.g., Dickey et al., 2001). Models of this dip are shown in Elmegreen, et al. (2003) and Block et al. (2009). To see a double power law, the part at high frequency has to extend for a long wavenumber range from the inverse thickness of the disk to the inverse spatial scale of the telescope resolution. If the thickness is smaller than the scale of the resolution, then the high frequency power law from 3D turbulence cannot be observed. This problem is present for conventional HI resolution in galaxies at distances greater than 2 Mpc. Our Spitzer infrared observations of the LMC have a resolution scale at least 10 times smaller than the disk thickness, so we should be able to see any high-frequency power law clearly.
Optical observations of galaxy PS have sufficient resolution to see the thickness, but unless there are large numbers of stellar groupings with sizes spanning a wide range around the disk thickness, the clarity of the PS break will be poor. A tentative PS break was observed optically in NGC 5055 (Elmegreen, Elmegreen & Leitner, 2003), but not in NGC 628 (Elmegreen et al., 2006). A break in the slope of the autocorrelation function for young stars in several nearby galaxies was inferred to mark a change in geometric properties of the gas by Odekon (2008).
Spitzer Space Telescope observations have such high angular resolution that 3.5-4 orders of magnitude in spatial scale can be covered for the LMC. This is much larger than is possible for any other galaxy in any other gas tracer at the present time. The smallest resolvable scale is only a few parsecs, which is much smaller than the disk thickness, so there is no contamination in the PS from the point spread function. Thus the FIR observations of the LMC are ideal for an unprecedented view of correlated structures in a galaxy. In a companion paper (Bournaud et al., 2010), we describe self-gravitating hydrodynamic simulations of galaxies like the LMC, with and without energy input from star formation. We obtain a two component PS for projected density structure in the simulations too, and we examine the velocities and energy sources that lead to this structure.
2 Observations
2.1 Data
Our data for the LMC come from SAGE (“Surveying the Agents of a Galaxy’s Evolution”; Meixner et al., 2006). The images at 24, 70 and 160 m were obtained with MIPS on the Spitzer Space Telescope; they cover degrees. The total integration time is 217 hours, which improves the point source sensitivity over previous surveys (e.g., IRAS) by 3 orders of magnitude. In Spitzer, all bands sample the point-spread function at better than the Nyquist frequency (0.4 at 24 and 160 m, 0.3 at 70 m). Thus, the instrument allows the telescope-limited resolution of 6′′, 18′′, and 40′′ at 24, 70, and 160 m, respectively (Rieke et al., 2004). The first of these, , corresponds to a spatial scale of 1.45 pc in the LMC. The theoretical Nyquist limit is 2 pixels, but in reality, the true Nyquist limit is 2 resolution elements.
At 24 m and 70 m, the images sizes we use are 8192 8192 pixels at a scale of 98 and per pixel, respectively (the SAGE 24 m image was binned to limit computer memory requirements). At 160 m, the image size is 2048 pixels at a scale of px. As far as deprojecting images of the LMC are concerned, there is no unique “center” - the dynamical center of the HI is offset by almost a full degree from the photometric center of the bar (Westerlund, 1997). We choose to conduct our deprojections about the dynamical centre of the LMC, which has right ascension and declination (J2000.0), following section 7 in van der Marel et al. (2002).
2.2 Power Spectra
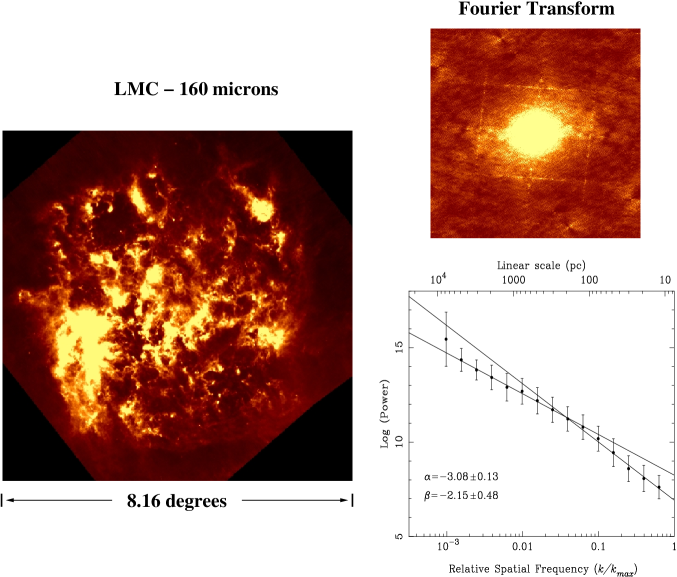
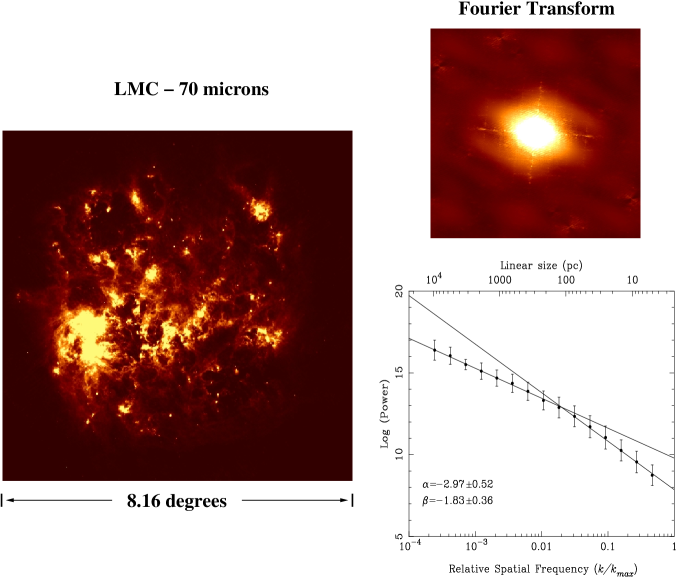
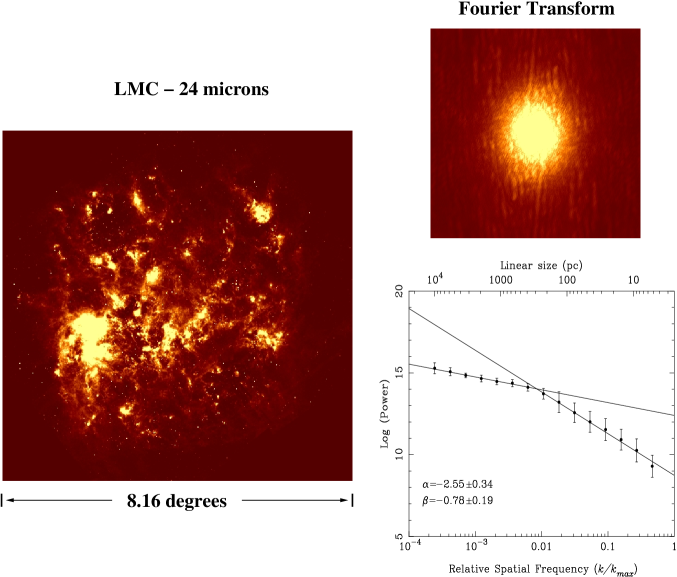
Figure 1 shows the MIPS image at 160 m and the 2D PS at the bottom right. The PS is the sum of the squares of the real and imaginary parts of the 2D Fourier transform (made with fourn from Numerical Recipes), averaged over each 2D wavenumber . We divided the PS into 15 wavenumber intervals and plotted the arithmetic mean for each interval as a dot in Figure 1. The PS has 2 distinct parts with different power law slopes. The steep slope at high is and the shallow slope at low is . The break is at approximately parsecs. Double power laws also occur in the PS of the other MIPS channels (Figs. 2 and 3). The break in the middle of the PS on a log scale allows both power laws to be seen clearly; there are orders of magnitude of wavenumber on each side for the shorter wavelength bands.
Emission at 160 m arises from cold dust in dark clouds. At 70 m, the emission comes from both warm and cold dust, and at 24 m the emission is from warm dust and PAH’s. The figures indicate that all of this dust has correlated structure spanning the entire resolvable disk of the LMC. The PS break is at pc for all 3 MIPS bands, suggesting that the disk thickness is about this value for each dust component. The least-square slopes are similar but with a slight progression. At high spatial frequency, they are , and for 160 m, 70 m and 24 m, respectively, and at low spatial frequency, they are , and for these three passbands. The steepening of the slope with FIR passband indicates that there is relatively more spectral power on large scales for longer wavelengths. This suggests that cool dust is more diffuse and less structured on small scales than warm dust. This conclusion is true regardless of the total fluxes and column densities of cool and warm dust, as these quantities contribute only to the component of the PS.
For comparison, the 2D PS of HI emission from the LMC has a slope of at high spatial frequency and a slope of at low spatial frequency (Elmegreen, Kim, & Staveley-Smith, 2001). The break is at a scale of pc, increasing slightly with galactocentric radius. These slopes are both higher than the corresponding slopes for the dust emission. The HI PS is most like the 160 m PS, although even steeper, suggesting that HI is even more dominated by large scale structure than cool dust.
In order to test the robustness of our analysis, we also deprojected the MIPS images about the bar center as opposed to the dynamical center of the LMC; the resulting PS at 24 m remained unchanged, while the slopes of the two power laws at 70 m and 160 m were only marginally affected. We conclude that choice of center for deprojection purposes is not responsible for the presence of two distinct power laws.
3 Discussion
The figures indicate that the relative thickness of the LMC dust disk compared to its diameter is only a few percent. This value comes from the ratio of the smallest wavenumber in the PS (the inverse of the largest scale) to the wavenumber at the break in the PS (the inverse of the disk thickness). The smallness of this ratio indicates that the LMC geometry is effectively 2D for some processes.
Turbulence in a strictly 2D medium (infinitely thin) differs from turbulence in a 3D medium. For incompressible turbulence, an infinitely thin layer can have an inverse cascade of energy, i.e., energy moves from smaller to larger scales, and a direct cascade of mean-squared vorticity, i.e., from larger to smaller scales (Kraichnan, 1967; Leith, 1968; Batchelor, 1969). For 3D turbulence, the energy generally cascades to smaller scales. Thus 2D turbulence on large scales can be fed by small scale motions, while 3D turbulence on large scales can only be fed by larger scale motions (in the absence of a magnetic field or other physical processes that force a connection between large and small scales).
It would be interesting if an inverse cascade of turbulence occurred in a very thin galaxy. Then localized energy from gravitational instabilities on the scale of the Jeans length, which is the disk scale height, and from supernovae, superbubbles, and so on, could power large scale motions and density correlations. A galactic disk is not strictly 2D even if it is thin, but the gas motions can still be highly anisotropic, making the disk effectively 2D. For example, density-wave and bar-driven streaming motions are often 5 to 10 times faster than the perpendicular motions that produce the disk thickness. Large scale motions may be generated by disk self-gravity, tidal forces from companion galaxies (Mastropietro et al., 2009), intergalactic ram pressure (Tonnesen & Bryan, 2009; Dutta et al., 2010), and other forcings. They contribute to large-scale structure and to the low- part of the density PS. More localized energy input from stars and OB associations should drive 3D motions and structures that contribute to the high- part of the density PS (see also Hodge & Deshpande, 2006). Turbulence driven on large scales would have a shallow PS because of the 2D nature of the resulting flows, while turbulence driven on small scales would have a steep PS because of the 3D nature of its associated flows.
Bournaud et al. (2010) ran simulations of galaxies like the LMC and found a two-component PS similar to what we observe here. This result occurred whether or not there was input from supernova energy, suggesting that gravitational energy alone can drive galactic turbulence over a wide range of scales. The study also suggested that there may be some contribution to the large-scale motions from an inverse cascade of energy in 2D. For example, they found a PS for the mean-squared vorticity, as in numerical experiments of strictly 2D turbulence in protoplanetary disks (Peterson et al., 2007). Thus the LMC PS could be the result of gravity-driven turbulence and other large-scale motions contributing to gas structure in an effectively 2D medium wider than the disk thickness, supernovae, cloud-scale gravity and other small-scale motions contributing to turbulence in a 3D medium within the disk thickness, and an inverse cascade of energy at the thickness scale up to larger scales, contributing to turbulence throughout the disk.
4 Conclusions
The LMC is the only disk galaxy where we can currently study interstellar motions on a range of scales covering a factor of or more. An essential component of this study is the Spitzer Space Telescope, which provides the highest possible angular resolution for large-scale maps of interstellar emission. Using the SAGE images at 24 m, 70 m, and 160 m, we derived 2D power spectra of dust emission over the whole LMC disk. The results showed one power law covering a factor of 100 in scales at low spatial frequency and another, steeper, power law covering another factor of 100 in scales at high frequency. The low frequency power law had been observed before with HI emission, but the high frequency power law was more limited before, spanning only a factor of in range (Elmegreen, Kim, & Staveley-Smith, 2001). The current observations confirm the two-component nature of the interstellar motions, suggesting that gas motions and turbulence are two-dimensional on scales larger than the disk thickness, and three-dimensional on scales smaller than the disk thickness. The line-of-sight thickness is measured at the break point, and is between 100 pc and 200 pc, depending on the wavelength of observation.
Acknowledgments We are grateful to G.G. Fazio and J. Hora for providing us with timely access to the SAGE Survey images of the LMC after their public release. We are indebted to S. Stanimirovic, L. Staveley-Smith and S. Kim for sending us their HI images of the SMC and LMC for testing our PS code. We are grateful to J. Scalo for comments on an early version of this manuscript. A note of deep appreciation is expressed by DLB to AVENG and to Mr. F. Titi for their sponsorship of his research. DLB is indebted to Roger Jardine, Kim Heller and to the AVENG Board of Trustees. This research is partially supported by the Mexican Foundation CONACYT. This study is based on observations made with the Spitzer Space Telescope, which is operated by the Jet Propulsion Laboratory, California Institute of Technology under a contract with NASA.
References
- Batchelor (1969) Batchelor, G.K. 1969, Phys. Fluids, 12, 233
- Begum, et al. (2006) Begum, A., Chengalur, J.N., & Bhardwaj, S. 2006, MNRAS, 372, L33
- Block et al. (1994) Block, D.L., Witt, A.N., Grosbøl, P., Stockton, A. & Moneti, A. 1994, A&A, 288, 383
- Block et al. (2009) Block, D. L., Puerari, I., Elmegreen, B. G., Elmegreen, D. M., Fazio, G. G., & Gehrz, R. D. 2009, ApJ, 694, 115
- Bournaud et al. (2010) Bournaud, F., Elmegreen, B.G., Teyssier, R., Block, D., & Puerari, I. 2010, ApJ, submitted
- Braine et al. (2010) Braine, J. et al., 2010, astro-ph/1005.3422v1
- Crovisier & Dickey (1983) Crovisier, J., & Dickey, J.M. 1983, A&A 122, 282
- Deshpande, Dwarakanath, & Goss (2000) Deshpande, A.A., Dwarakanath, K.S. & Goss, W.M. 2000, ApJ, 543, 227
- Dickey et al. (2001) Dickey, J.M., McClure-Griffiths, N.M., Stanimirovic, S., Gaensler, B.M., & Green, A.J. 2001, ApJ, 561, 264
- Draine & Li (2007) Draine, B.T., & Li, A. 2007, ApJ, 657, 810
- Dutta et al. (2008) Dutta, P., Begum, A., Bharadwaj, S., & Chengalur, J.N. 2008, MNRAS, 384, L34
- Dutta et al. (2009a) Dutta, P., Begum, A., Bharadwaj, S., & Chengalur, J.N. 2009a, MNRAS, 397, L60
- Dutta et al. (2009b) Dutta, P., Begum, A., Bharadwaj, S., & Chengalur, J.N. 2009b, MNRAS, 398, 887
- Dutta et al. (2010) Dutta, P., Begum, A., Bharadwaj, S., & Chengalur, J.N. 2010, arXiv1004.1528
- Elmegreen, Kim, & Staveley-Smith (2001) Elmegreen, B.G., Kim, S. & Staveley-Smith, L. 2001, ApJ, 548, 749
- Elmegreen & Scalo (2004) Elmegreen, B.G. & Scalo, J. 2004, ARAA, 42, 211
- Elmegreen, Elmegreen & Leitner (2003) Elmegreen, B.G., Elmegreen, D.M., & Leitner, S. 2003, ApJ, 590, 271
- Elmegreen, et al. (2003) Elmegreen, B.G., Elmegreen, D.M., Leitner, S., & Cuillandre, J.-C. 2003, ApJ, 593, 333
- Elmegreen et al. (2006) Elmegreen, B.G., Elmegreen, D.M., Chandar, R., Whitmore, B., & Regan, M. 2006, ApJ, 644, 879
- Engelbracht et al. (2008) Engelbracht, C.W. et al. 2008, ApJ, 678, 804
- Freedman et al. (2001) Freedman, W.L. et al. 2001, ApJ, 553, 47
- Gautier et al. (1992) Gautier, T.N., Boulanger, F., Perault, M., & Puget, J.L. 1992, AJ, 103, 1313
- Goldman (2000) Goldman, I. 2000, ApJ, 541, 701
- Green (1993) Green, D.A. 1993, MNRAS 262, 327
- Greenberg & Li (1996) Greenberg, J.M. & Li, A. 1996, in “New Extragalactic Perspectives in the New South Africa”, Edited by D.L. Block & J.M. Greenberg, Kluwer Academic Publishers, Dordrecht, p. 118
- Hodge & Deshpande (2006) Hodge, J.A., & Deshpande, A.A. 2006, ApJ, 646, 232
- Ingalls et al. (2004) Ingalls, J.G. et al. 2004, ApJS, 154, 281
- Khalil et al. (2006) Khalil, A., Joncas, G., Nekka, F., Kestener, P., & Arneodo, A. 2006, ApJS, 165, 512
- Kraichnan (1967) Kraichnan, R.H. 1967, Phys. Fluids, 10, 1417
- Lazarian & Pogosyan (2000) Lazarian, A. & Pogosyan, D. 2000, ApJ, 537, 720
- Lazarian et al. (2001) Lazarian, A., Pogosyan, D., Vázquez-Semadeni, E., & Pichardo, B. 2001, ApJ, 555, 130
- Leith (1968) Leith, C.E. 1968, Phys. Fluids, 11, 671
- Mastropietro et al. (2009) Mastropietro, C., Burkert, A., & Moore, B. 2009, MNRAS, 399, 2004
- Meixner et al. (2006) Meixner, M. et al. 2006, AJ, 132, 2268
- Miville-Deschênes et al. (2003) Miville-Deschênes, M.-A., Joncas, G., Falgarone, E., & Boulanger, F. 2003, A&A, 411, 109
- Odekon (2008) Odekon, M.C. 2008, ApJ, 681, 1248
- Padoan et al. (2001) Padoan, P., Kim, S., Goodman, A., & Staveley-Smith, L. 2001, ApJ, 555, L33
- Peterson et al. (2007) Petersen, M.R., Julien, K., & Weiss, J.B. 2006, Physics of Fluids, 18, 26601
- Rieke et al. (2004) Rieke, G.H. et al. 2004, ApJS, 154, 25
- Roychowdhury et al. (2010) Roychowdhury, S., Chengalur, J.N., Begum, A., & Karachentsev, I.D. 2010, MNRAS, 404, L60
- Schlegel, Finkbeiner, & Davis (1998) Schlegel, D.J., Finkbeiner, D.P. & Davis, M. 1998, ApJ, 500, 525
- Stanimirovic et al. (1999) Stanimirovic, S., Staveley-Smith, L., Dickey, J.M., Sault, R.J. & Snowden, S.L. 1999, MNRAS, 302, 417
- Stanimirovic et al. (2000) Stanimirovic, S., Staveley-Smith, L., van der Hulst, J. M., Bontekoe, T.J. R., Kester, D. J. M., & Jones, P. A. 2000, MNRAS, 315, 791
- Stützki et al. (1998) Stützki, J., Bensch, F., Heithausen, A., Ossenkopf, V. & Zielinsky, M. 1998, A&A, 336, 697
- Tonnesen & Bryan (2009) Tonnesen, S., & Bryan, G.L. 2009, ApJ, 694, 789
- van der Marel & Cioni (2001) van der Marel, R.P. & Cioni, M.-R. L. 2001, AJ, 122, 1807
- van der Marel et al. (2002) van der Marel, R.P., Alves, D.R., Hardy, E. & Suntzeff, N.B. 2002, AJ, 124, 2639
- van der Marel et al. (2008) van der Marel, R.P., Kallivayalil, N. & Besla, G. 2008, Proceedings IAU Symposium No. 256, eds. Jaco Th. Van Loon and Joana M. Oliviera, p. 81
- Westerlund (1997) Westerlund, B.E. 1997, The Magellanic Clouds, Cambridge Astrophysics Series, Cambridge University Press
- Willett, Elmegreen, & Hunter (2005) Willett, K. W., Elmegreen, B. G., & Hunter, D. A. 2005, AJ, 129, 2186