789\Yearpublication2010\Yearsubmission2010\Month11\Volume999\Issue88
later
Pulsational content and abundance analysis of some Scuti stars
observed by CoRoT
††thanks:
The CoRoT space mission was developed and is operated by the French
space agency CNES, with participation of ESA’s RSSD and Science Programmes,
Austria, Belgium, Brazil, Germany, and Spain.
This work is based on observations made with ESO Telescopes at the La Silla Observatory under
the ESO Large Programmes LP 178.D-0361, LP 182.D-0356, and LP 185.D-0056.
Abstract
Several Sct stars were photometrically monitored with the satellite CoRoT and observed in high–resolution spectroscopy from ground. We present here the preliminary analysis of the abundance analysis of several potential CoRoT targets. Moreover, new insights are given about the problem of the huge number of detected frequencies by comparing Sct stars with normal A-stars.
keywords:
stars: abundances, stars: oscillations, stars: individual (HD50844, HD 50870, HD 292790, HD 171586, HD 172588, HD 1712748), delta Scuti stars, stars: rotation1 Combining space photometry and ground–based spectroscopy
The ground–based campaigns on Sct stars revealed richer and richer frequency spectra of these opacity–driven pulsators. The continuous improvements in their exploitation suggested that the detection of a wealth of very low amplitude modes was only a matter of signal–to–noise ratio (Garrido & Poretti 2004). The confirmation of this suggestion was offered by the space mission CoRoT (COnvection, ROtation and planetary Transits; Baglin et al. 2006). As a matter of fact, the frequency analysis of the CoRoT timeseries on HD 50844 (Poretti et al. 2009), the first Sct star observed by CoRoT in the Initial Run, revealed hundreds of terms in the frequency range 0–30 d-1.
The mode identification of solar-like oscillators rely on the regularity of the frequency pattern in the power spectrum. This method may not be applicable to larger amplitude pulsators, as Sct stars, for which non–linear effects select the observed modes in a way which is not yet fully understood. For these targets, the identification of modes observed by CoRoT may present some difficulties, and will require additional data collected from the ground. In particular, ground-based spectroscopic observations are needed to assign -values to the detected modes and low–degree modes have to be complemented with the observation of the high–degree ones. Moreover, diagnostics of stellar interiors are often strongly weighted toward the surface; one example is the rotational splitting, for which the structure and rotation of sub–surface regions play a dominant role. A precise and reliable knowledge of sub–surface layers can be extracted from high–degree modes and these modes can be typified by high-resolution spectroscopy only. Figure 1 shows the case of the Sct star HD 50870 (Mantegazza et al., in preparation). The amplitude and phase plots suggest the identification of the displayed modes as radial (top panels), prograde non-radial (middle panels), and retrograde non-radial (bottom panels).

In the specific case of HD 50844, the spectroscopic data allowed us to identify high–degree modes up to . As an immediate consequence, we were forced to admit that the cancellation effects are not sufficient in removing the flux variations associated to these modes at the noise level of the CoRoT measurements. Moreover, the predominant term (=6.92 d-1) was typified as the fundamental radial mode.

2 Abundance analysis of CoRoT Sct stars
The ground-based observations indicate that HD 50844 is an evolved star that is slightly underabundant in heavy elements, located on the Terminal Age Main Sequence. The CoRoT scientific programme contains other Sct stars, with different evolutionary statuses, and a careful abundance analysis can greatly help in the selection process.
Our analysis follows the methodology presented in Niemczura & Połubek (2006) and relies on an efficient spectral synthesis based on a least-squares optimisation algorithm (see Takeda 1995; Bevington 1969). The method allows for the simultaneous determination of various parameters involved in stellar spectra and consists of the minimisation of the deviation between the theoretical flux distribution and the observed normalised one. The synthetic spectrum depends on the stellar parameters. The effective temperature , surface gravity , and microturbulence were obtained before the determination of abundances of chemical elements and were considered as input parameters. The rotational velocity , radial velocity , and the relative abundances of the elements can be determined simultaneously because they produce detectable and different spectral signatures. The values were determined by comparing the shapes of metal line profiles with the computed profiles, as shown in Gray (2005). The theoretical spectrum was fitted to the normalised observed one and the continuum was objectively drawn by connecting the highest points of the analysed spectrum part. For the adopted input values, the solution is typically reached after 10 iterations. The program stops if the values of the determined parameters remain the same within 2% for three consecutive steps. The atmospheric models used in this analysis were computed with the line-blanketed LTE ATLAS9 code (Kurucz 1993). The synthetic spectra were obtained with the SYNTHE code (Kurucz 1993).
Figure 2 illustrates the positions in the HR diagram for the candidate targets having HARPS and/or FEROS spectra. The effective temperature was determined by using both photometric and spectroscopic approaches. We used colours of three different photometries: Strömgren uvby (Moon & Dworetsky 1985; Napiwotzki, Schoenberner & Wenske 1993), Geneva (Künzli et al. 1997) and index (Masana, Jordi & Ribas 2006). The spectroscopic methods included the determination of from shapes of Balmer lines and from lines of neutral iron, Fe I. The effective temperature was adjusted till there was no trend in the Fe I abundance versus excitation potential of the atomic level causing the line. The last method was used for stars with small projected rotational velocity ( 35 km s-1). On Fig. 2 the average values of effective temperature obtained from all used methods are shown. The luminosities were determined from the standard relation , where . The magnitudes and Hipparcos parallaxes (van Leeuwen 2007) were taken from SIMBAD database. Bolometric corrections () are based on data summarized by Flower (1996). The solar values and are adopted from Bessell, Castelli & Plez (1998). The evolutionary tracks were taken from Lejeune & Schaerer (2001) for two metallicities ( and ) and for stellar masses 1.25, 1.5, 1.7, 2.0 and 2.5. The two stars located after TAMS are HD 172588 and HD 172748 ( Sct). Both these objects are giants with spectral types F0 II-III and F2 IIIp, respectively. The location of HD 172588, the most evolved star on HR diagram, can be determined by the error in luminosity, resulting from the uncertainty of Hipparcos parallax. The presented errors of effective temperatures are the standard deviations derived from all values obtained for a given star.
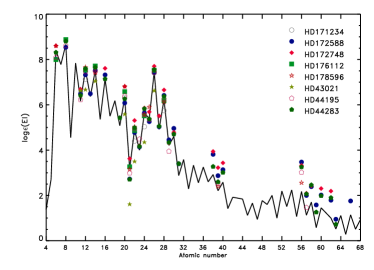
On Figure 3 the chemical abundances collected for the analysed objects are compared with the solar values taken from Grevesse, Asplund & Sauval (2007). Almost for all stars the rare-earth and heavy elements are overabundant. This result can be caused by the small number of lines of these elements in the stellar spectra. Additionally, all these features are weak or are blends of lines of other elements. In most cases, the light and iron peak elements are in the error bars similar to the solar values. The peculiar abundances of HD 172748 were confirmed. The detailed description of used methods and obtained results will be presented in Niemczura et al. (2010, in preparation).
3 New insights into the pulsational content

The potential contribution of granulation to the huge number of significant pics has been considered (Michel 2010 and also Kallinger & Matthews 2010). Most of the peaks detected in the frequency spectrum of HD 50844 could be the signature of non–white granulation noise. This possibility deserves attention and we bring here a new contribution. Figure 4 shows the amplitude spectra of three stars. In the top panel we see the spectrum of the rotational variable HD 292790. The peaks at 5 d-1 are due to the rotational frequency and harmonics. There is no other relevant peak, except those of the CoRoT orbital frequency (13.97 d-1) and harmonics. The level of the noise is below 0.01 mmag. The two panels in the middle show the amplitude spectra of the Sct star HD 50844 after subtracting 250 and 500 frequencies. The level of the peaks is 0.10 mmag in the second panel, 0.05 mmag in the third. The bottom panel shows the amplitude spectrum of another rotational variable (HD 171856, Lüftinger et al., in preparation). In this latter case the rotational frequency and harmonics were subtracted and as a matter of fact the spectrum shows the expected white-noise at the level of 0.002 mmag. It is of interest to note that HD 171856 has the same spectral type of HD 50844 and it does not show any trace of noise due to granulation. Therefore, it seems that the problem of the huge number of frequencies detected in the amplitude spectra of Sct stars is not solved yet, since noise excess is not observed in non–pulsating stars. Of course, rotation and chemical composition near surface can be different and might influence granulation. However, if we admit that granulation is contributing significantly to the excess of power below 30 d-1, Fig. 4 suggests that the onset of granulation effects is related to pulsation. It is quite evident that the physical scenario of A–stars needs a careful revisitation to match the results obtained from CoRoT observations.
Acknowledgements.
We acknowledge the support from the Centre National d’Etudes Spatiales (CNES). The spectroscopic data are being obtained as part of the ESO Large Programmes LP178.D-0361, LP182.D-0356, and LP185.D-0056 (PI.: E. Poretti) in the framework of the Italian ESS project, contract ASI/INAF I/015/07/0, WP 03170. EP acknowledges the support from the European Helio and Asteroseismology Network (HELAS) for the participation to the Conference. EN acknowledges financial support of the N N203 302635 grant from the MNiSW.References
- [Baglin et al.(2006)] Baglin, A., Auvergne, M., Barge, P., et al., 2006, in “The CoRoT Mission, Pre-Launch Status, Stellar Seismology and Planet Finding”, M. Fridlund, A. Baglin, J. Lochard, & L. Conroy, Eds. (ESA SP-1306, ESA Publications Division, Nordwijk, Netherlands), p. 33
- [Bessell et al.(1998)] Bessell, M. S., Castelli, F., Plez, B., 1998, A&A, 333, 231 (Erratum: 1998, A&A, 337, 321)
- [1969] Bevington, P.R., 1969, in Data reduction and error analysis for the physical sciences, New York: McGraw-Hill
- [1996] Flower, P.J., 1996, ApJ, 469, 355
- [Garrido & Poretti(2004)] Garrido, R., & Poretti, E., 2004, in “Variable Stars in the Local Group”, IAU Colloq. 193, D.W. Kurtz & K.R. Pollard Eds., ASP Conf. Series, 310, 560
- [2005] Gray, D.F., 2005, The Observation an Analysis of Stellar Photospheres, Cambridge University Press, The Edinburgh Building, Cambridge, CB2 2Ru, UK
- [2007] Grevesse, N., Asplund, M., Sauval, A.J., 2007, SSRv, 130, 105
- [] Kallinger, Th., Matthews, J.M., 2010, ApJ, 711, L35
- [1997] Künzli, M., North, P., Kurucz, R.L., Nicolet, B., 1997, A&AS, 122, 51
- [1993] Kurucz, R., 1993, CD-ROM 18
- [2001] Lejeune, T., Schaerer, D., 2001, A&A, 366,538
- [2010] Lüftinger, T., et al., in preparation
- [2010] Mantegazza, L., et al., in preparation
- [2006] Masana, E., Jordi, C., Ribas, I., 2006, A&A, 450, 735
- [2010] Michel, E., 2010, these proceedings
- [1985] Moon, T., Dworetsky, M.M., 1985, MNRAS, 217, 305
- [1993] Napiwotzki, R., Schoenberner, D., Wenske, V., 1993, A&A, 268, 653
- [2006] Niemczura, E., Połubek, G., 2006, ESASP, 624, 120
- [2010] Niemczura, E., et al., in preparation
- [Poretti et al. (2009)] Poretti, E., E. Michel, R. Garrido, et al., 2009, A&A, 506, 85
- [1995] Takeda, Y., 1995, PASJ, 47, 287
- [2007] van Leeuwen, F., 2007, A&A, 474, 653